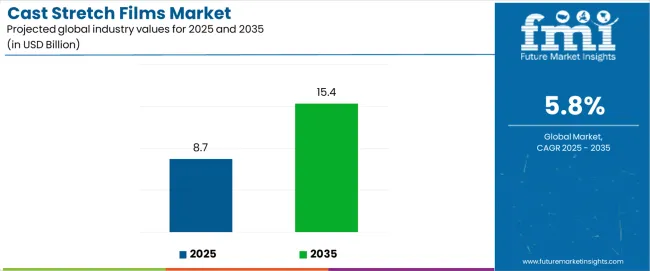
The cast stretch films market is projected to grow from USD 8.7 billion in 2025 to USD 15.4 billion by 2035, at a CAGR of 5.8%. Expansion will be driven by rising demand for logistics protection and pallet wrapping across warehousing, e-commerce distribution, manufacturing, and freight transportation sectors. The rise from USD 8.7 billion to USD 15.4 billion underscores accelerating adoption of advanced cling technology and load containment solutions across supply chain networks, automated packaging lines, and shipping operations.
Between 2025 and 2030, the market is projected to expand from USD 8.7 billion to about USD 11.5 billion, generating USD 2.8 billion in additional value, which accounts for 42% of the decade’s growth. This stage will be characterized by adoption of puncture-resistant films with higher cling force and optical clarity. Secure pallet unitization and enhanced load stability will evolve from optional upgrades to baseline requirements across logistics operations.
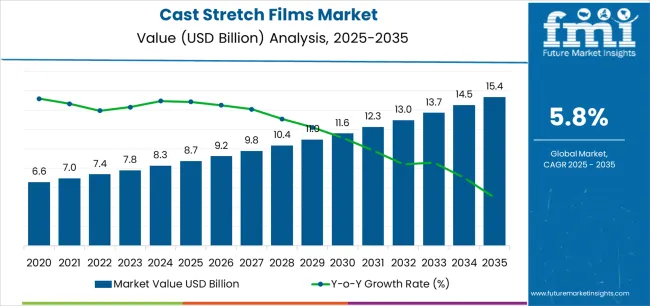
From 2030 to 2035, the market is expected to grow further from USD 11.5 billion to USD 15.4 billion, adding USD 3.9 billion in value, or 58% of decade-long expansion. This phase will be shaped by penetration of multilayer cast films, integration with automated wrapping platforms, and compatibility with robotic palletizing and material handling infrastructure. The growth trajectory indicates structural shifts in how manufacturers and logistics providers manage load securing and transport protection.
Distinct phases reveal evolving competitive dynamics. Between 2025 and 2030, the market will post annual average growth of 5.7%, marking the shift from hand-applied films and basic wrapping systems to multilayer films with pre-stretch technology and improved holding force. Market maturation will be supported by standardized gauge specifications, declining resin costs, and growing recognition of containment benefits, delivering 68–74% effectiveness in transport protection. Key producers such as Berry Global and Sigma Plastics will expand cast film portfolios, while new entrants pursue nano-layer technologies and specialized cling formulations.
From 2030 to 2035, expansion will accelerate with USD 3.9 billion in added value. Market focus will shift from load stabilization toward full supply chain optimization, where advanced film systems integrate with automated logistics and high-speed packaging lines. Competitive emphasis will move toward throughput efficiency, advanced performance metrics, and adaptability across diverse logistics environments.
| Metric | Value |
|---|---|
| Market Value (2025) | USD 8.7 billion |
| Market Forecast (2035) | USD 15.4 billion |
| Growth Rate | 5.80% CAGR |
| Leading Film Type | Machine Stretch Films |
| Primary End Use | Food & Beverage |
The market demonstrates strong fundamentals with machine stretch film systems capturing a dominant share through superior pre-stretch capabilities and automated application efficiency. Food & beverage applications drive primary demand, supported by increasing cold chain logistics requirements and automated distribution center solutions. Geographic expansion remains concentrated in developed markets with established warehousing infrastructure, while emerging economies show accelerating adoption rates driven by e-commerce expansion projects and rising manufacturing export activity.
Market expansion rests on three fundamental shifts driving adoption across logistics and manufacturing sectors. E-commerce acceleration creates compelling advantages through cast stretch films that provide comprehensive load protection with consistent wrapping performance, enabling distribution centers to secure palletized shipments and reduce material consumption while maintaining load stability assurance and justifying investment over traditional blown stretch films. Automated packaging enhancement accelerates as warehouses worldwide seek high-speed wrapping systems that deliver load containment directly to shipping operations, enabling labor cost reduction that aligns with operational efficiency expectations and maximizes throughput capacity. Supply chain optimization drives adoption from logistics providers requiring reliable stretch film solutions that minimize packaging waste while maintaining load integrity performance during transportation and handling operations.
The growth faces headwinds from resin price volatility variations that differ across polyethylene markets regarding raw material availability and processing costs, potentially limiting performance reliability in tight-margin logistics categories. Equipment compatibility complexity also persists regarding stretch wrapper calibration and film tension settings that may increase operational adjustments in facilities with diverse automated packaging standards.
The cast stretch films market represents a compelling intersection of logistics optimization innovation, automated packaging enhancement, and load containment management. With robust growth projected from USD 8,742 million in 2025 to USD 15,368 million by 2035 at a 5.80% CAGR, this market is driven by increasing e-commerce fulfillment trends, warehouse automation requirements, and commercial demand for reduced packaging material consumption formats.
The market's expansion reflects a fundamental shift in how logistics providers and manufacturing companies approach pallet securing infrastructure. Strong growth opportunities exist across diverse applications, from automated distribution centers requiring high-speed wrapping to export operations demanding superior load stability. Geographic expansion is particularly pronounced in Asia-Pacific markets, led by China (7.2% CAGR) and India (6.9% CAGR), while established markets in North America and Europe drive innovation and specialized segment development.
The dominance of machine stretch films and food & beverage applications underscores the importance of proven load containment technology and supply chain efficiency in driving adoption. Film performance validation and equipment compatibility remain key challenges, creating opportunities for companies that can deliver reliable performance while maintaining cost efficiency.
Primary Classification: The market segments by film type into machine stretch films, hand stretch films, and specialty films categories, representing the evolution from manual pallet wrapping to advanced automated load containment formats for comprehensive supply chain protection operations.
Secondary Breakdown: End use segmentation divides the market into food & beverage, consumer goods, pharmaceuticals, building & construction, electronics, and others sectors, reflecting distinct requirements for load stability, optical clarity, and supply chain efficiency.
Regional Classification: Geographic distribution covers North America, Europe, Asia Pacific, Latin America, and the Middle East & Africa, with developed markets leading innovation while emerging economies show accelerating growth patterns driven by manufacturing expansion programs.
The segmentation structure reveals technology progression from standard hand films toward integrated multi-layer machine platforms with enhanced pre-stretch ratios and cling force capabilities, while application diversity spans from automated distribution operations to export facilities requiring comprehensive load securing and validated containment-prevention solutions.
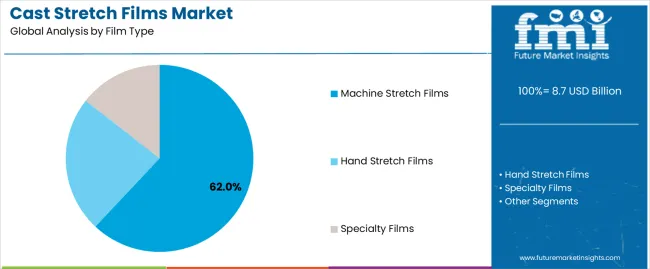
Machine stretch films segment is estimated to account for 62% of the cast stretch films market share in 2025. The segment's leading position stems from its fundamental role as a critical component in automated warehouse packaging applications and its extensive use across multiple logistics and manufacturing sectors. Machine stretch films' dominance is attributed to its superior pre-stretch capability, including material efficiency, consistent application tension, and equipment compatibility that make it indispensable for high-volume pallet wrapping operations.
Market Position: Machine stretch film systems command the leading position in the cast stretch films market through advanced coextrusion technologies, including comprehensive layer structuring, precise gauge control, and reliable cling performance that enable manufacturers to deploy wrapping solutions across diverse logistics environments.
Value Drivers: The segment benefits from warehouse operator preference for proven automated wrapping that provides exceptional load stability without requiring manual labor. Efficient material usage enables deployment in high-speed wrapping lines, robotic systems, and turntable applications where throughput and cost efficiency represent critical selection requirements.
Competitive Advantages: Machine stretch film systems differentiate through excellent pre-stretch ratios, proven load retention performance, and integration with automated packaging equipment that enhance logistics capabilities while maintaining validated film profiles suitable for diverse load containment applications.
Key market characteristics:
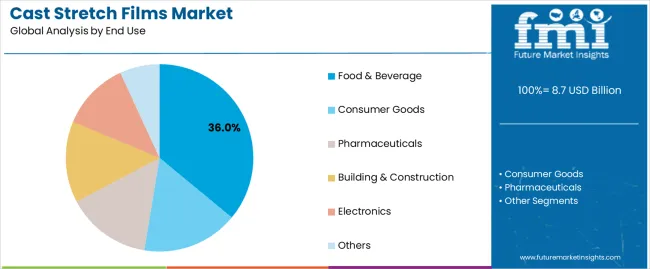
Food & beverage segment is projected to hold 36% of the cast stretch films market share in 2025. The segment's market leadership is driven by the extensive use of cast stretch films in beverage distribution, packaged food logistics, fresh produce handling, and cold chain operations, where secure pallet unitization serves as both a protective containment and supply chain efficiency component. The food & beverage industry's consistent investment in automated distribution solutions supports the segment's dominant position.
Market Context: Food & beverage applications dominate the market due to widespread adoption of high-clarity films and increasing focus on cold chain temperature management, load stability maintenance, and hygiene standards that enhance product protection while maintaining delivery freshness.
Appeal Factors: Food distributors prioritize optical clarity, puncture resistance, and integration with refrigerated warehouse systems that enable coordinated deployment across multiple distribution channels. The segment benefits from substantial grocery retail growth and food safety standards that emphasize secure wrapping for palletized food applications.
Growth Drivers: E-commerce grocery expansion programs incorporate cast stretch films as standard protocol for home delivery pallets and fresh produce distribution. At the same time, beverage manufacturer initiatives are increasing demand for cost-effective wrapping systems that comply with food safety standards and enhance distribution efficiency.
Market Challenges: Cold storage condensation effects and temperature cycling exposure may constrain deployment flexibility in ultra-cold freezer applications or extreme humidity distribution scenarios.
Application dynamics include:
Growth Accelerators: E-commerce expansion drives primary adoption as cast stretch films provide exceptional load securing capabilities that enable pallet stability without manual labor, supporting material reduction achievement and operational efficiency that require automated wrapping formats. Warehouse automation accelerates market growth as logistics facilities seek high-speed packaging solutions that maintain load containment during transport while enhancing throughput capacity through verified pre-stretch design. Cost reduction emphasis increases worldwide, creating demand for efficient cast film systems that complement automated equipment requirements and provide competitive advantages in logistics optimization.
Growth Inhibitors: Resin cost volatility challenges differ across polyethylene markets regarding raw material pricing and supply availability, which may limit market penetration and performance reliability in tight-margin logistics categories with demanding cost requirements. Equipment calibration complexity persists regarding stretch wrapper tension settings and film unwind characteristics that may increase total operational adjustments in facilities with diverse automated packaging specifications. Market fragmentation across multiple film gauge standards and wrapping equipment creates compatibility concerns between different warehouse operators and existing material handling infrastructure.
Market Evolution Patterns: Adoption accelerates in automated distribution and e-commerce sectors where throughput efficiency justifies equipment investments, with geographic concentration in developed markets transitioning toward mainstream adoption in emerging economies driven by manufacturing expansion and export growth improvement. Technology development focuses on enhanced downgauging optimization, improved nano-layer structures, and integration with robotic wrapping systems that optimize material consumption and operational efficiency. The market could face disruption if alternative load containment technologies or packaging innovations significantly challenge cast film advantages in automated warehouse applications.
The cast stretch films market demonstrates varied regional dynamics with Growth Leaders including China (7.2% CAGR) and India (6.9% CAGR) driving expansion through manufacturing export growth and logistics infrastructure modernization. Steady Performers encompass the USA (6.5% CAGR), Germany (5.7% CAGR), and Japan (5.2% CAGR), benefiting from established automated warehousing sectors and e-commerce distribution innovation.
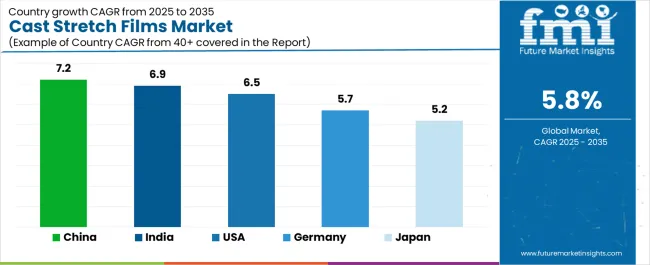
| Country | CAGR (2025-2035) |
|---|---|
| China | 7.2% |
| India | 6.9% |
| USA | 6.5% |
| Germany | 5.7% |
| Japan | 5.2% |
Regional synthesis reveals Asia-Pacific markets leading growth through manufacturing production expansion and logistics infrastructure enhancement, while European countries maintain steady expansion supported by specialized automated packaging applications and warehouse efficiency requirements. North American markets show strong growth driven by e-commerce acceleration and distribution center automation applications.
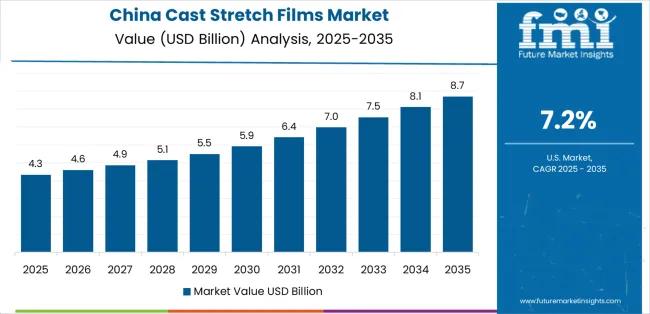
China establishes regional leadership through explosive manufacturing production expansion and comprehensive logistics infrastructure modernization, integrating advanced cast stretch films as standard components in warehouse operations and export packaging activities. The country's 7.2% CAGR through 2035 reflects manufacturing investment growth promoting domestic production and international trade activity that mandate the use of efficient load containment systems in distribution operations. Growth concentrates in major logistics hubs, including Shanghai, Shenzhen, and Guangzhou, where automated warehouses showcase integrated stretch wrapping systems that appeal to domestic manufacturers seeking cost-effective packaging and export compliance.
Chinese logistics providers are developing innovative cast film solutions that combine local cost advantages with international performance specifications, including multi-layer barrier films and advanced cling capabilities.
Strategic Market Indicators:
The Indian market emphasizes manufacturing applications, including rapid industrial production development and comprehensive warehouse modernization that increasingly incorporates cast stretch films for export pallets and domestic distribution applications. The country is projected to show a 6.9% CAGR through 2035, driven by massive logistics infrastructure activity under government infrastructure initiatives and commercial demand for affordable, efficient wrapping systems. Indian manufacturers prioritize cost-effectiveness with cast films delivering load stability through economical film specifications and efficient material consumption capabilities.
Technology deployment channels include major manufacturing companies, third-party logistics providers, and export-oriented facilities that support high-volume usage for domestic and international markets.
Performance Metrics:
The USA market emphasizes advanced cast film features, including innovative automated wrapping integration and comprehensive e-commerce distribution platforms that manage load stability, material efficiency, and throughput optimization applications through unified packaging systems. The country is projected to show a 6.5% CAGR through 2035, driven by distribution center automation under online retail growth trends and commercial demand for validated, high-performance wrapping systems. American logistics companies prioritize operational efficiency with cast films delivering comprehensive load containment through advanced pre-stretch technology and proven cling performance.
Technology deployment channels include major e-commerce retailers, third-party logistics providers, and automated warehouse operators that support custom development for specialized operations.
Performance Metrics:
In Hamburg, Frankfurt, and Munich, German logistics providers and manufacturing companies are implementing advanced cast stretch film systems to enhance load containment capabilities and support operational efficiency that aligns with Industry 4.0 protocols and warehouse standards. The German market demonstrates growth with a 5.7% CAGR through 2035, driven by automated warehousing innovation programs and manufacturing investments that emphasize efficient packaging systems for export and distribution applications. German logistics facilities are prioritizing cast film systems that provide exceptional load stability while maintaining material consumption efficiency and minimizing waste generation, particularly important in automated packaging operations and international freight distribution operations.
Market expansion benefits from warehouse modernization programs that mandate efficient wrapping in logistics specifications, creating demand across Germany's distribution and manufacturing sectors, where load integrity and operational efficiency represent critical requirements.
Strategic Market Indicators:
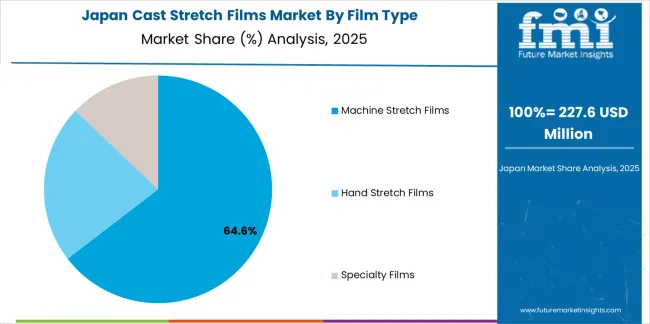
The sophisticated manufacturing market in Japan demonstrates meticulous cast stretch film deployment, growing at a 5.2% CAGR, with documented operational excellence in load containment and export packaging applications through integration with existing automated wrapping systems and quality control infrastructure. The country leverages engineering expertise in polymer science and film technology to maintain market leadership. Logistics centers, including Tokyo, Osaka, and Nagoya, showcase advanced installations where cast film systems integrate with comprehensive robotic palletizing platforms and automated material handling systems to optimize load stability and operational efficiency.
Japanese manufacturers prioritize film performance precision and material consistency in packaging development, creating demand for premium cast stretch films with advanced features, including ultra-high pre-stretch ratios and integration with high-speed wrapping protocols. The market benefits from established logistics infrastructure and willingness to invest in specialized film technologies that provide superior load containment and operational documentation.
Market Intelligence Brief:
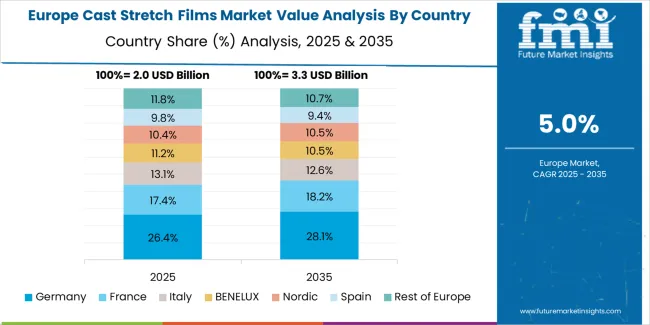
The cast stretch films market in Europe is projected to grow from USD 2,318 million in 2025 to USD 3,896 million by 2035, registering a CAGR of 5.3% over the forecast period. Germany is expected to maintain its leadership position with a 38.7% market share in 2025, declining slightly to 38.2% by 2035, supported by its automated warehousing excellence and major logistics centers, including North Rhine-Westphalia and Baden-Württemberg.
France follows with a 22.4% share in 2025, projected to reach 23.1% by 2035, driven by comprehensive e-commerce fulfillment and distribution innovation initiatives. The United Kingdom holds a 19.6% share in 2025, expected to maintain 20.1% by 2035 through established retail logistics sectors and warehouse automation adoption. Italy commands a 11.2% share, while Spain accounts for 6.4% in 2025. The Rest of Europe region is anticipated to gain momentum, expanding its collective share from 1.7% to 2.3% by 2035, attributed to increasing manufacturing activity in Eastern European countries and emerging Scandinavian logistics companies implementing automated packaging programs.
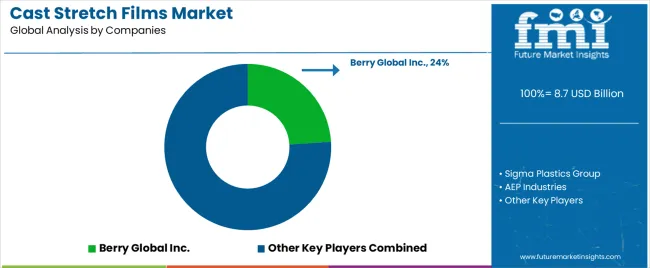
The cast stretch films market operates with moderate concentration, featuring approximately 32-40 participants, where leading companies control roughly 38-44% of the global market share through established logistics customer networks and comprehensive film production capabilities. Competition emphasizes performance reliability, equipment compatibility, and cost efficiency rather than price-based rivalry.
Market leaders encompass Berry Global Inc., Sigma Plastics Group, and AEP Industries, which maintain competitive advantages through extensive stretch film expertise, global manufacturing networks, and comprehensive technical support capabilities that create warehouse operator loyalty and support operational requirements. These companies leverage decades of film production experience and ongoing polymer technology investments to develop advanced cast stretch systems with exceptional load stability and material efficiency features.
Specialty challengers include Integrated Packaging Group, Paragon Films, and Manuli Stretch, which compete through specialized film innovation focus and efficient production solutions that appeal to automated warehouse operators seeking advanced wrapping formats and custom film flexibility. These companies differentiate through coextrusion engineering emphasis and specialized application focus.
Market dynamics favor participants that combine reliable load containment performance with advanced equipment support, including stretch wrapper calibration and film tension optimization capabilities. Competitive pressure intensifies as traditional packaging film manufacturers expand into automated wrapping systems. At the same time, specialized polymer suppliers challenge established players through innovative nano-layer technology and cost-effective production targeting emerging e-commerce segments.
| Item | Value |
|---|---|
| Quantitative Units | USD 8.7 billion |
| Film Type | Machine Stretch Films, Hand Stretch Films, Specialty Films |
| End Use | Food & Beverage, Consumer Goods, Pharmaceuticals, Building & Construction, Electronics, Others |
| Regions Covered | North America, Europe, Asia Pacific, Latin America, Middle East & Africa |
| Countries Covered | USA, Germany, Japan, China, India, and 25+ additional countries |
| Key Companies Profiled | Berry Global Inc., Sigma Plastics Group, AEP Industries, Integrated Packaging Group, Paragon Films, Manuli Stretch |
| Additional Attributes | Dollar sales by film type and end use categories, regional adoption trends across North America, Europe, and Asia-Pacific, competitive landscape with stretch film manufacturers and polymer suppliers, warehouse operator preferences for pre-stretch performance and equipment compatibility, integration with automated wrapping equipment and robotic palletizing systems, innovations in nano-layer technology and cling formulations, and development of specialized e-commerce solutions with enhanced material efficiency capabilities and validated load containment features |
The global cast stretch films market is estimated to be valued at USD 8.7 billion in 2025.
The market size for the cast stretch films market is projected to reach USD 15.4 billion by 2035.
The cast stretch films market is expected to grow at a 5.8% CAGR between 2025 and 2035.
The key product types in cast stretch films market are machine stretch films , hand stretch films and specialty films.
In terms of end use, food & beverage segment to command 36.0% share in the cast stretch films market in 2025.


Full Research Suite comprises of:
Market outlook & trends analysis
Interviews & case studies
Strategic recommendations
Vendor profiles & capabilities analysis
5-year forecasts
8 regions and 60+ country-level data splits
Market segment data splits
12 months of continuous data updates
DELIVERED AS:
PDF EXCEL ONLINE
Casted Automotive Components Market Size and Share Forecast Outlook 2025 to 2035
Casting Multi-stage Centrifugal Blower Market Size and Share Forecast Outlook 2025 to 2035
Castor Oil Polyol Market Size and Share Forecast Outlook 2025 to 2035
Cast Polymers Market Size and Share Forecast Outlook 2025 to 2035
Cast Resin Transformer Market Size and Share Forecast Outlook 2025 to 2035
Cast Aluminum Heating Board Market Size and Share Forecast Outlook 2025 to 2035
Casters Market Size and Share Forecast Outlook 2025 to 2035
Castor Oil-Based Biopolymer Market Size and Share Forecast Outlook 2025 to 2035
Cast Acrylic Sheets Market Size and Share Forecast Outlook 2025 to 2035
Castor Oil Market Growth – Trends & Forecast 2025 to 2035
Castration-Resistant Prostate Cancer (CRPC) Treatment Market Insights - Demand, Size & Industry Trends 2025 to 2035
Castor Oil Derivatives Market Growth - Trends & Forecast 2025 to 2035
Precast Concrete Market Size and Share Forecast Outlook 2025 to 2035
Podcasting Market Size and Share Forecast Outlook 2025 to 2035
Die Cast Toys Market Size and Share Forecast Outlook 2025 to 2035
Die Casting Services Market Analysis - Growth & Forecast 2025 to 2035
Grid Casting Machine Market Size and Share Forecast Outlook 2025 to 2035
Broadcast Switchers Market Size and Share Forecast Outlook 2025 to 2035
Broadcast Equipment Market Growth - Trends & Forecast 2025 to 2035
Metal Casting Market Size and Share Forecast Outlook 2025 to 2035

Thank you!
You will receive an email from our Business Development Manager. Please be sure to check your SPAM/JUNK folder too.
Chat With
MaRIA