Reports

- Global Locations -

Headquarters

Future Market Insights, Inc.

Christiana Corporate, 200
Continental Drive, Suite 401,
Newark, Delaware - 19713,
United States

T: +1-845-579-5705

Americas

Future Market Insights, Inc.

616 Corporate Way, Suite 2-9018,
Valley Cottage, NY 10989, United States

T: +1-347-918-3531

MEA

Future Market Insights

1602-6 Jumeirah Bay X2 Tower, Plot No: JLT-PH2-X2A,
Jumeirah Lakes Towers, Dubai,
United Arab Emirates

Europe

Future Market Insights

3rd Floor, 207 Regent Street,
W1B 3HH London
United Kingdom

T: + 44 (0) 20 8123 9659
D: +44 (0) 20 3287 4268

Asia Pacific

Future Market Insights

IndiaLand Global Tech Park, Unit UG-1, Behind Grand HighStreet, Phase 1, Hinjawadi, MH, Pune – 411057, India

Grid Casting Machine Market Outlook from 2024 to 2034

More vehicles are getting electrified and more countries are investing in mass-scale renewable energy projects. Lead-acid batteries are widely used in these applications, which rely on grid casting machines for manufacturing.

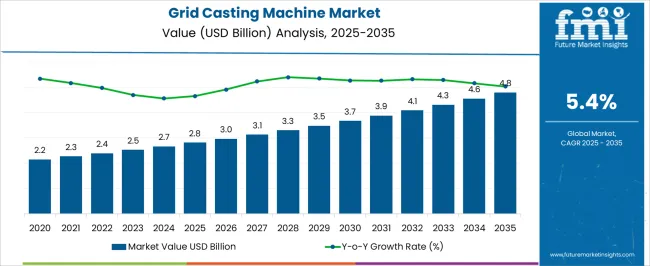
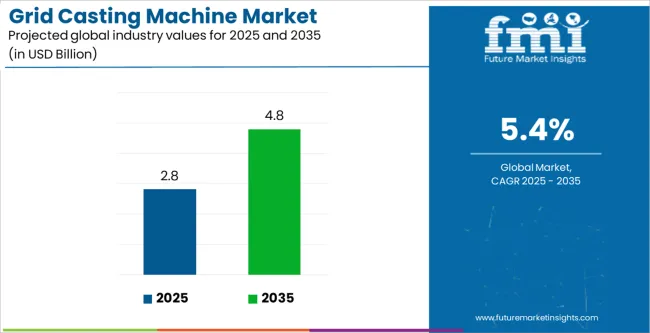
As more batteries are produced, the grid casting machine market size is expected to cross US$ 6,085.80 million by 2034. In 2024, the market size stands at US$ 2,818.90 million. Industry expansion is estimated at a 5.50% CAGR for 2024 to 2034.

Attribute Details
Industry Size in 2023 US$ 2,664.40 million
Industry Size in 2024 US$ 2,818.90 million
Industry Size by 2034 US$ 6,085.80 million
Value CAGR (2024 to 2034) 5.50%

Don't pay for what you don't need

Customize your report by selecting specific countries or regions and save 30%!

Key Industry Highlights

  • Electrification of Vehicles and EV Demand Boosts Industry Growth

As more vehicles get electrified, the machines used to make the lead grids for batteries are also in demand. Although electric vehicles mostly use lithium-ion batteries, traditional lead-acid batteries are still needed for some, like hybrids. These lead grids are made using grid casting equipment.

As more cars go electric to reduce pollution, the demand for these lead grids and the machines that make them keeps growing. This shows how the move to electric vehicles impacts the demand for these machines. As more electric vehicles are, sold the industry benefits. Grid casting equipment manufacturers can prosper with this shift.

  • More Countries Investing in Renewable Energy Fosters Industry Growth

As more countries turn to solar and wind power to fight climate change, they need better ways to store this energy. Lead-acid batteries, made using grid casting equipment, are essential for storing this power. So, as more energy from renewable sources is produced, the demand for these machines grows too. This shows how the move to renewable energy is boosting the industry.

A greater emphasis on a future without fossil fuels is expected. As the focus on renewable energy projects rises, manufacturers can benefit.

Grid Casting Machine Market Trends Analysis

  • Expansion of telecommunication networks in developing regions supports industry growth. The need for backup power solutions nurtures the industry.
  • Microgrid projects in remote and off-grid areas aid industry expansion. The need for energy resilience boosts demand.
  • Lead-acid battery recycling programs are becoming popular in the battery industry. Demand for grid casting equipment that can process reclaimed materials is increasing.
  • Expansion of global infrastructure is helping the industry prosper, as these machines are used to make lead-acid batteries for backup power systems and uninterruptible power supplies.
  • Use of lead-acid batteries in disaster recovery and emergency response helps the industry expand. As the severity and frequency of natural disasters keep increasing, disaster-resilient energy storage systems are required.
Nikhil Kaitwade
Nikhil Kaitwade

Principal Consultant

Talk to Analyst

Find your sweet spots for generating winning opportunities in this market.

Grid Casting Machine Market Opportunity Analysis

  • Rise in Industry 4.0 adoption can be beneficial for the industry.
  • The need for customization in energy storage systems is opportunistic for manufacturers. Developing flexible grid casting equipment for industries like automotive, telecommunication, and other industrial sectors can increase revenues.
  • Increase in IoT devices and remote monitoring systems across industries means more demand for compact and reliable energy solutions. Manufacturers can tap into these niche segments.
  • Rise of energy harvesting solutions and wearables presents opportunities. These machines can be used to make miniature batteries that have high energy density and long cycle life to power devices.
  • Electrification of the maritime industry provides prospects. Businesses can benefit by developing casting technologies for marine battery production.

Comparative View of Adjacent Industries

This section compares the forged and casting component market and the metal stampings, forgings, and castings market with the grid casting machine market.

Grid Casting Machine Market:

Attributes Grid Casting Machine Market
CAGR (2024 to 2034) 5.50%
Growth Factors
  • Increasing demand for renewable energy
  • Growth of automotive industry
Future Opportunity Advancements in battery technology
Trend Rising urbanization and industrialization in developing countries

Forged and Casting Component Market:

Attributes Forged and Casting Component Market
CAGR (2024 to 2034) 6.0%
Growth Factors
  • Increasing demand in automotive and aerospace industries
  • Rising demand for complex and lightweight components
Future Opportunity Increase in infrastructure projects worldwide
Trend Shift toward electrification and sustainable mobility

Metal Stampings, Forgings, and Castings Market:

Attributes Metal Stampings, Forgings, and Castings Market
CAGR (2024 to 2034) 5.7%
Growth Factors
  • Rising demand from automotive, aerospace, and construction industries
  • Growth of manufacturing industry
Future Opportunity Technological advancements in metal stamping methods
Trends Growing demand for precision metal stamping

Get the data you need at a Fraction of the cost

Personalize your report by choosing insights you need
and save 40%!

Category-wise Insights

Continuous Grid Casting Machines Gain Top Share

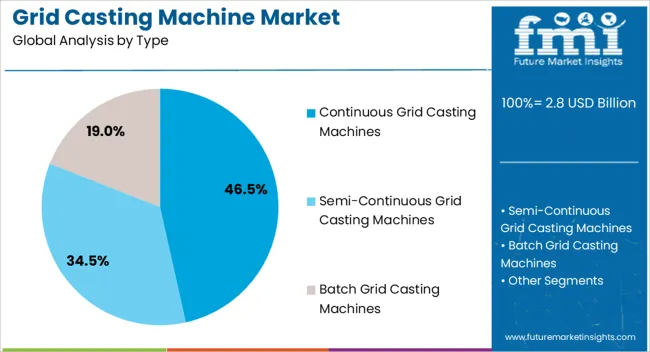
Segment Continuous Grid Casting Machines (Type)
Value Share (2024) 46.50%

Continuous grid casting machines are expected to lead in 2024. These machines are considered better than batch ones because they produce faster and without stopping. They ensure that the lead grids made for batteries are of the same quality every time.

These machines can also change how they work easily to make different kinds of grids. They use advanced technology to work automatically and can fit in with other machines easily.

Even though they cost more at first, they end up being cheaper in the long run because they can make more grids without any problems. And if a company wants to make more grids, they can just add on to these machines without much trouble. These traits boost their demand in the industry.

Automotive Dominates as the Leading End Use Industry

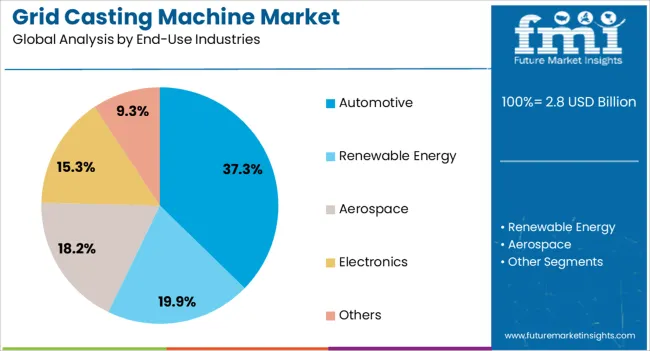
Segment Automotive (End-use Industries)
Value Share (2024) 37.30%

The automotive industry segment is expected to lead in the end-use indsutry category in 2024. More cars are becoming electric, but regular cars with gas engines are still popular. These regular cars use lead-acid batteries. Hybrid vehicles that use both gas and electricity also use these batteries.

Even when vehicles get old and need new batteries, people often choose lead-acid batteries because they're cheaper and work with many different vehicles. Trucks, buses, and heavy machines also use these batteries. All of this means that machines used to make these batteries are in high demand in the automotive industry.
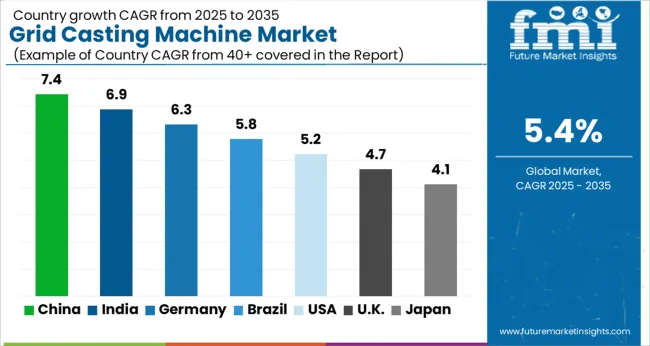
Country-wise Insights

Countries Value CAGR (2024 to 2034)
United States 4.80%
Germany 5.20%
China 4.70%
India 6.30%
Australia 5.80%

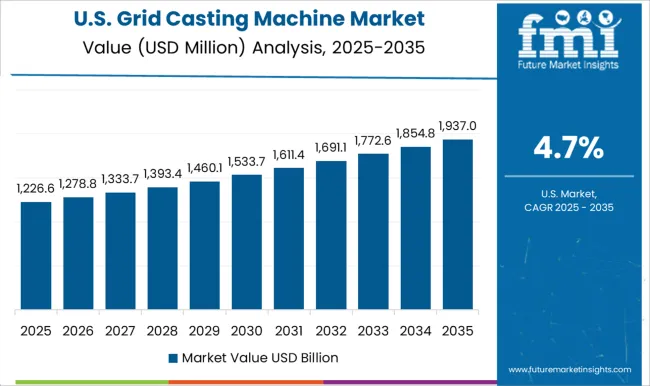
Pursuit of Energy Independence Drives Industry Growth in the United States

The demand for grid casting machines in the United States is anticipated to amplify at 4.80% CAGR until 2034. Making sure the country has enough energy and is safe from threats is given importance. Batteries made using special machines play a big part in this by providing backup power and helping keep the electricity stable.

The government encourages using cleaner energy with incentives like tax breaks, which boosts the demand for these batteries. Also, as extreme weather becomes more common, there's a need for stronger electricity systems.

This means more batteries are needed, creating opportunities for companies that make these special machines. So, by focusing on clean energy and helping make the electricity system stronger, businesses can do well in the United States industry.

Wirtz Manufacturing Company specializes in battery manufacturing equipment and is located in the United States. The brand focuses on research and development to introduce new technology and strengthen its networks.
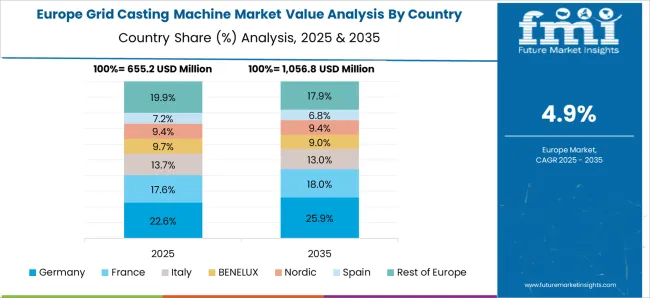
Need for E-mobility Surges Sales in Germany

The sales of grid casting machine in Germany is in line to amplify at 5.20% CAGR till 2034. German consumers want more electric cars and cleaner industries, so they need machines that make batteries for these cars and factories. These machines make batteries that help electric cars work better and also support industries by providing backup power.

As more electric cars are used and industries become cleaner, the need for these machines grows. So, German companies that make these machines have a chance to sell more because they can help meet the country's goals for cleaner transportation and industries.

Electric Vehicle Dominance Bolsters Growth in China

The growth of the grid casting machine market in China is estimated at 4.70% CAGR until 2034. Chinese manufacturers sell a significant number of electric cars, so they need a greater number of machines to make batteries for these cars. These machines are also used to make batteries for other vehicles.

As China's cities get bigger and they need more electricity, there's a bigger demand for batteries and the machines that make them. Chinese companies are working on making these machines better and smarter to keep up with the demand.

Zhongshan Kaixiang Electric Technology Co., Ltd. engages in battery equipment production and is popular in China. The company focuses on product innovation and customization. It invests in talent development and technological advancements for unparalleled growth.

Push for Renewable Energy Catapults Demand in India

Market trends and drivers for the grid casting machine industry hint expansion at 6.30% CAGR in India till 2034. The government helps companies that make these machines, and India is also starting to use more electric vehicles. This means more demand for batteries and the machines that make them. Overall, it's a good time for companies in India that make grid casting equipment.

Gravita India Limited is a pioneer in lead products and equipment for the battery industry. The company focuses on diversification into new product categories. It focuses on sustainable practices to comply with regulations and consumer preferences.

Shift toward Renewable Energy Sources Boosts Sales in Australia

Grid casting machine market analysis in Australia indicates expansion at 5.80% CAGR until 2034. Like other countries, Australia is using more renewable energy like solar and wind power. This means there's a bigger need for batteries to store this energy. Also, in remote areas and islands of the country, they use batteries for power, and these machines help make them too.

In Australia's mining industry, big machines need batteries to work, and these machines help make these batteries strong. When there are big storms or disasters, Australia needs batteries to keep things running. So, there's notable demand for grid casting equipment in Australia to make batteries for different uses.
Competitive Analysis of Grid Casting Sector

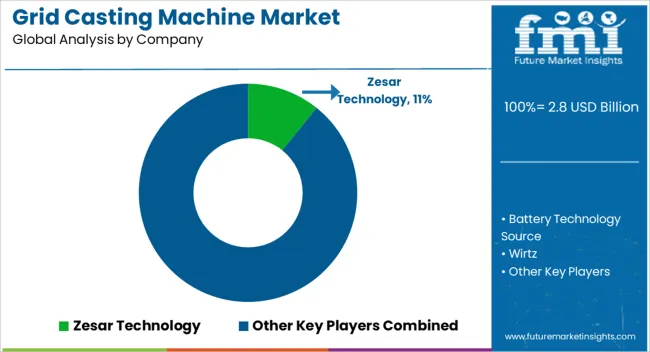
The grid casting machine industry is highly competitive, with prominent companies vying for global supremacy. Established businesses such as WIRTZ Manufacturing Company and SoVema Group dominate the industry due to their significant experience and technological knowledge.

To preserve their competitive advantage, they spend on research and development, strategic alliances, and acquisitions. However, smaller specialized firms flourish by providing bespoke solutions at competitive prices. Technological improvements and industry trends fuel competitiveness, whilst regulatory concerns and industry dynamics influence strategic decisions.

Recent Development

  • In April 2024, Magnus Metal, a pioneer in industrial, high-volume digital casting for metal alloys, announced that it had secured US$ 74 million in Series B investment. Magnus Metal plans to use the additional financing to further develop its revolutionary casting methods, as well as expand its operations locally and worldwide to assist its Fortune 100 customers.
  • Nissan Motor announced in April 2024 that the company will commence large-scale production of solid-state batteries for electric vehicles by early 2029.

Key Players in the Grid Casting Machine Industry

  • WIRTZ Manufacturing Company
  • SoVema Group
  • MAC Engineering
  • HADI Manufacturing Company
  • AXFA Corporation
  • Borit NV
  • EK Battemakina
  • Kunshan Lead Power Equipment Co., Ltd.
  • CAM Elit Batarya
  • Daramic, LLC

Key Coverage in the Grid Casting Machine Market Report

  • Demand Analysis of Automatic Grid Casting Machine
  • Sales Analysis of Gravity Grid Casting Machine
  • Revenue Analysis of Semi-automatic Grid Casting Machines
  • Demand Analysis of Automotive Grid Gravity Casting Machines

Key Segments of the Grid Casting Machine Market

By Type:

  • Continuous Grid Casting Machines
  • Semi-Continuous Grid Casting Machines
  • Batch Grid Casting Machines

By End-use Industries:

  • Automotive
  • Renewable Energy
  • Aerospace
  • Electronics
  • Others

By Region:

  • North America
  • Latin America
  • Western Europe
  • Eastern Europe
  • Asia Pacific (APAC)
  • Middle East & Africa (MEA)
  • Japan

Frequently Asked Questions

What is the Worth of the Grid Casting Machine Market?

The industry is in line to be valued at US$ 2,818.90 million in 2024.

What is the Probable CAGR of the Grid Casting Machine Market?

The industry size is estimated to increase at 5.50% CAGR through 2034.

What is the Future Stance for the Grid Casting Machine Market?

The industry is expected to be worth US$ 6,085.80 million by 2034.

Which is the Leading Type in the Grid Casting Machine Industry?

Continuous grid casting machine is highly preferred in the industry.

Which Country is Rising at a Higher CAGR in the Grid Casting Machine Market?

The industry in India is predicted to expand at 6.30% CAGR through 2034.

Table of Content

1. Executive Summary

    1.1. Global Market Outlook

    1.2. Demand Side Trends

    1.3. Supply Side Trends

    1.4. Technology Roadmap

    1.5. Analysis and Recommendations

2. Market Overview

    2.1. Market Coverage / Taxonomy

    2.2. Market Definition / Scope / Limitations

3. Key Market Trends

    3.1. Key Trends Impacting the Market

    3.2. Product Innovation / Development Trends

4. Key Success Factors

    4.1. Product Adoption / Usage Analysis

    4.2. Product USPs / Features

    4.3. Strategic Promotional Strategies

5. Global Market Demand Analysis 2019 to 2023 and Forecast, 2024 to 2034

    5.1. Historical Market Volume (Tons) Analysis, 2019 to 2023

    5.2. Current and Future Market Volume (Tons) Projections, 2024 to 2034

    5.3. Y-o-Y Growth Trend Analysis

6. Global Market - Pricing Analysis

    6.1. Regional Pricing Analysis By Product Type

    6.2. Global Average Pricing Analysis Benchmark

7. Global Market Demand (in Value or Size in US$ Million) Analysis 2019 to 2023 and Forecast, 2024 to 2034

    7.1. Historical Market Value (US$ Million) Analysis, 2019 to 2023

    7.2. Current and Future Market Value (US$ Million) Projections, 2024 to 2034

        7.2.1. Y-o-Y Growth Trend Analysis

        7.2.2. Absolute $ Opportunity Analysis

8. Market Background

    8.1. Macro-Economic Factors

        8.1.1. Global GDP Growth Outlook

        8.1.2. Global Chemical Industry Overview

        8.1.3. Manufacturing Value-Added

        8.1.4. Industry Value Added

        8.1.5. Parent Market Outlook

        8.1.6. Other Macro-Economic Factors

    8.2. Forecast Factors - Relevance & Impact

        8.2.1. Top Companies Historical Growth

        8.2.2. GDP Growth Forecast

        8.2.3. Manufacturing Industry Forecast

        8.2.4. Global Urbanization Growth Outlook

        8.2.5. End-use Industry Growth Outlook

        8.2.6. Other Forecast Factors

    8.3. Value Chain

        8.3.1. Product Manufacturers

        8.3.2. End Users

        8.3.3. Avg. Profitability Margins

    8.4. COVID-19 Crisis - Impact Assessment

        8.4.1. Current Statistics

        8.4.2. Short-Mid-Long Term Outlook

        8.4.3. Likely Rebound

    8.5. Market Dynamics

        8.5.1. Drivers

        8.5.2. Restraints

        8.5.3. Opportunity Analysis

    8.6. Global Supply Demand Analysis

    8.7. Key Regulations & Certifications

    8.8. Trade Scenario

    8.9. Parent Market Overview

    8.10. Key Developments

    8.11. Patent Analysis

    8.12. Porter’s and PEST Analysis

    8.13. Production Process Overview

9. Global Market Analysis 2019 to 2023 and Forecast 2024 to 2034, By Product Type

    9.1. Introduction / Key Findings

    9.2. Historical Market Size (US$ Million) and Volume Analysis By Product Type, 2019 to 2023

    9.3. Current and Future Market Size (US$ Million) and Volume Analysis and Forecast By Product Type, 2024 to 2034

        9.3.1. Continuous Grid Casting Machines

        9.3.2. Semi-Continuous Grid Casting Machines

        9.3.3. Batch Grid Casting Machines

    9.4. Market Attractiveness Analysis By Product Type

10. Global Market Analysis 2019 to 2023 and Forecast 2024 to 2034, By End-Use Industries

    10.1. Introduction / Key Findings

    10.2. Historical Market Size (US$ Million) and Volume Analysis By End-Use Industries, 2019 to 2023

    10.3. Current and Future Market Size (US$ Million) and Volume Analysis and Forecast By End-Use Industries, 2024 to 2034

        10.3.1. Automotive

        10.3.2. Renewable Energy

        10.3.3. Aerospace

        10.3.4. Electronics

        10.3.5. Others

    10.4. Market Attractiveness Analysis By End-Use Industries

11. Global Market Analysis 2019 to 2023 and Forecast 2024 to 2034, by Region

    11.1. Introduction

    11.2. Historical Market Size (US$ Million) and Volume Analysis By Region, 2019 to 2023

    11.3. Current Market Size (US$ Million) and Volume Analysis and Forecast By Region, 2024 to 2034

        11.3.1. North America

        11.3.2. Latin America

        11.3.3. East Asia

        11.3.4. South Asia Pacific

        11.3.5. Western Europe

        11.3.6. Eastern Europe

        11.3.7. Middle East and Africa (MEA)

    11.4. Market Attractiveness Analysis By Region

12. North America Market Analysis 2019 to 2023 and Forecast 2024 to 2034

    12.1. Introduction

    12.2. Pricing Analysis

    12.3. Historical Market Size (US$ Million) and Volume Trend Analysis By Market Taxonomy, 2019 to 2023

    12.4. Market Size (US$ Million) and Volume Forecast By Market Taxonomy, 2024 to 2034

        12.4.1. By Country

            12.4.1.1. USA

            12.4.1.2. Canada

            12.4.1.3. Mexico

        12.4.2. By Product Type

        12.4.3. By End-Use Industries

    12.5. Market Attractiveness Analysis

        12.5.1. By Country

        12.5.2. By Product Type

        12.5.3. By End-Use Industries

    12.6. Market Trends

    12.7. Key Market Participants - Intensity Mapping

    12.8. Drivers and Restraints - Impact Analysis

13. Latin America Market Analysis 2019 to 2023 and Forecast 2024 to 2034

    13.1. Introduction

    13.2. Pricing Analysis

    13.3. Historical Market Size (US$ Million) and Volume Trend Analysis By Market Taxonomy, 2019 to 2023

    13.4. Market Size (US$ Million) and Volume Forecast By Market Taxonomy, 2024 to 2034

        13.4.1. By Country

            13.4.1.1. Brazil

            13.4.1.2. Chile

            13.4.1.3. Rest of Latin America

        13.4.2. By Product Type

        13.4.3. By End-Use Industries

    13.5. Market Attractiveness Analysis

        13.5.1. By Country

        13.5.2. By Product Type

        13.5.3. By End-Use Industries

    13.6. Market Trends

    13.7. Key Market Participants - Intensity Mapping

    13.8. Drivers and Restraints - Impact Analysis

14. East Asia Market Analysis 2019 to 2023 and Forecast 2024 to 2034

    14.1. Introduction

    14.2. Pricing Analysis

    14.3. Historical Market Size (US$ Million) and Volume Trend Analysis By Market Taxonomy, 2019 to 2023

    14.4. Market Size (US$ Million) and Volume Forecast By Market Taxonomy, 2024 to 2034

        14.4.1. By Country

            14.4.1.1. China

            14.4.1.2. Japan

            14.4.1.3. South Korea

        14.4.2. By Product Type

        14.4.3. By End-Use Industries

    14.5. Market Attractiveness Analysis

        14.5.1. By Country

        14.5.2. By Product Type

        14.5.3. By End-Use Industries

    14.6. Market Trends

    14.7. Key Market Participants - Intensity Mapping

    14.8. Drivers and Restraints - Impact Analysis

15. South Asia Pacific Market Analysis 2019 to 2023 and Forecast 2024 to 2034

    15.1. Introduction

    15.2. Pricing Analysis

    15.3. Historical Market Size (US$ Million) and Volume Trend Analysis By Market Taxonomy, 2019 to 2023

    15.4. Market Size (US$ Million) and Volume Forecast By Market Taxonomy, 2024 to 2034

        15.4.1. By Country

            15.4.1.1. India

            15.4.1.2. ASEAN

            15.4.1.3. ANZ

            15.4.1.4. Rest of SAP

        15.4.2. By Product Type

        15.4.3. By End-Use Industries

    15.5. Market Attractiveness Analysis

        15.5.1. By Country

        15.5.2. By Product Type

        15.5.3. By End-Use Industries

    15.6. Market Trends

    15.7. Key Market Participants - Intensity Mapping

    15.8. Drivers and Restraints - Impact Analysis

16. Western Europe Market Analysis 2019 to 2023 and Forecast 2024 to 2034

    16.1. Introduction

    16.2. Pricing Analysis

    16.3. Historical Market Size (US$ Million) and Volume Trend Analysis By Market Taxonomy, 2019 to 2023

    16.4. Market Size (US$ Million) and Volume Forecast By Market Taxonomy, 2024 to 2034

        16.4.1. By Country

            16.4.1.1. Germany

            16.4.1.2. Italy

            16.4.1.3. France

            16.4.1.4. UK

            16.4.1.5. Spain

            16.4.1.6. BENELUX

            16.4.1.7. NORDICS

            16.4.1.8. Rest of W. Europe

        16.4.2. By Product Type

        16.4.3. By End-Use Industries

    16.5. Market Attractiveness Analysis

        16.5.1. By Country

        16.5.2. By Product Type

        16.5.3. By End-Use Industries

    16.6. Market Trends

    16.7. Key Market Participants - Intensity Mapping

    16.8. Drivers and Restraints - Impact Analysis

17. Eastern Europe Market Analysis 2019 to 2023 and Forecast 2024 to 2034

    17.1. Introduction

    17.2. Pricing Analysis

    17.3. Historical Market Size (US$ Million) and Volume Trend Analysis By Market Taxonomy, 2019 to 2023

    17.4. Market Size (US$ Million) and Volume Forecast By Market Taxonomy, 2024 to 2034

        17.4.1. By Country

            17.4.1.1. Russia

            17.4.1.2. Poland

            17.4.1.3. Hungary

            17.4.1.4. Balkan & Baltics

            17.4.1.5. Rest of E. Europe

        17.4.2. By Product Type

        17.4.3. By End-Use Industries

    17.5. Market Attractiveness Analysis

        17.5.1. By Country

        17.5.2. By Product Type

        17.5.3. By End-Use Industries

    17.6. Market Trends

    17.7. Key Market Participants - Intensity Mapping

    17.8. Drivers and Restraints - Impact Analysis

18. Middle East and Africa Market Analysis 2019 to 2023 and Forecast 2024 to 2034

    18.1. Introduction

    18.2. Pricing Analysis

    18.3. Historical Market Size (US$ Million) and Volume Trend Analysis By Market Taxonomy, 2019 to 2023

    18.4. Market Size (US$ Million) and Volume Forecast By Market Taxonomy, 2024 to 2034

        18.4.1. By Country

            18.4.1.1. KSA

            18.4.1.2. Other GCC Countries

            18.4.1.3. Türkiye

            18.4.1.4. South Africa

            18.4.1.5. Other African Union

            18.4.1.6. Rest of MEA

        18.4.2. By Product Type

        18.4.3. By End-Use Industries

    18.5. Market Attractiveness Analysis

        18.5.1. By Country

        18.5.2. By Product Type

        18.5.3. By End-Use Industries

    18.6. Market Trends

    18.7. Key Market Participants - Intensity Mapping

    18.8. Drivers and Restraints - Impact Analysis

19. Country-wise Market Analysis

    19.1. Introduction

        19.1.1. Market Value Proportion Analysis, By Key Countries

        19.1.2. Global Vs. Country Growth Comparison

    19.2. USA Market Analysis

        19.2.1. By Product Type

        19.2.2. By End-Use Industries

    19.3. Canada Market Analysis

        19.3.1. By Product Type

        19.3.2. By End-Use Industries

    19.4. Mexico Market Analysis

        19.4.1. By Product Type

        19.4.2. By End-Use Industries

    19.5. Brazil Market Analysis

        19.5.1. By Product Type

        19.5.2. By End-Use Industries

    19.6. Chile Market Analysis

        19.6.1. By Product Type

        19.6.2. By End-Use Industries

    19.7. China Market Analysis

        19.7.1. By Product Type

        19.7.2. By End-Use Industries

    19.8. Japan Market Analysis

        19.8.1. By Product Type

        19.8.2. By End-Use Industries

    19.9. South Korea Market Analysis

        19.9.1. By Product Type

        19.9.2. By End-Use Industries

    19.10. India Market Analysis

        19.10.1. By Product Type

        19.10.2. By End-Use Industries

    19.11. ASEAN Market Analysis

        19.11.1. By Product Type

        19.11.2. By End-Use Industries

    19.12. ANZ Market Analysis

        19.12.1. By Product Type

        19.12.2. By End-Use Industries

    19.13. Germany Market Analysis

        19.13.1. By Product Type

        19.13.2. By End-Use Industries

    19.14. Italy Market Analysis

        19.14.1. By Product Type

        19.14.2. By End-Use Industries

    19.15. France Market Analysis

        19.15.1. By Product Type

        19.15.2. By End-Use Industries

    19.16. UK Market Analysis

        19.16.1. By Product Type

        19.16.2. By End-Use Industries

    19.17. Spain Market Analysis

        19.17.1. By Product Type

        19.17.2. By End-Use Industries

    19.18. BENELUX Market Analysis

        19.18.1. By Product Type

        19.18.2. By End-Use Industries

    19.19. NORDICS Market Analysis

        19.19.1. By Product Type

        19.19.2. By End-Use Industries

    19.20. Russia Market Analysis

        19.20.1. By Product Type

        19.20.2. By End-Use Industries

    19.21. Poland Market Analysis

        19.21.1. By Product Type

        19.21.2. By End-Use Industries

    19.22. Hungary Market Analysis

        19.22.1. By Product Type

        19.22.2. By End-Use Industries

    19.23. Balkan & Baltics Market Analysis

        19.23.1. By Product Type

        19.23.2. By End-Use Industries

    19.24. KSA Market Analysis

        19.24.1. By Product Type

        19.24.2. By End-Use Industries

    19.25. Other GCC Countries Market Analysis

        19.25.1. By Product Type

        19.25.2. By End-Use Industries

    19.26. Türkiye Market Analysis

        19.26.1. By Product Type

        19.26.2. By End-Use Industries

    19.27. South Africa Market Analysis

        19.27.1. By Product Type

        19.27.2. By End-Use Industries

    19.28. Other African Union Market Analysis

        19.28.1. By Product Type

        19.28.2. By End-Use Industries

20. Market Structure Analysis

    20.1. Market Analysis by Tier of Companies

    20.2. Market Concentration

    20.3. Market Share Analysis of Top Players

    20.4. Production Capacity Analysis

    20.5. Market Presence Analysis

        20.5.1. By Product Footprint of Players

        20.5.2. By Regional Footprint of Players

        20.5.3. By Application Footprint of Players

21. Competition Analysis

    21.1. Competition Dashboard

    21.2. Competition Benchmarking

    21.3. Competition Deep Dive

        21.3.1. Zesar Technology

            21.3.1.1. Overview

            21.3.1.2. Product Portfolio

            21.3.1.3. Profitability by Market Segments (Product/Channel/Region)

            21.3.1.4. Sales Footprint

            21.3.1.5. Strategy Overview

        21.3.2. Battery Technology Source

        21.3.3. Wirtz

        21.3.4. TC Machinery

        21.3.5. Sovema

        21.3.6. PDC Machine Kylt

        21.3.7. Hilans

        21.3.8. Better Technology Group Ltd

        21.3.9. MAC Engineering

        21.3.10. GridMaster Machinery

        21.3.11. Leadline Machinery

        21.3.12. PowerGrid Technology

        21.3.13. PCE Pacific, Inc.

        21.3.14. Eastman Casting

        21.3.15. Conmach Machinery

        21.3.16. GridTech Solutions

        21.3.17. ElectroGrid Machinery

        21.3.18. AlphaGrid Machinery

        21.3.19. GridCast Technologies

        21.3.20. MetalForming Inc.

        21.3.21. Other Key Players

22. Primary Insights

23. Assumptions and Acronyms Used

24. Research Methodology

List of Tables

Table 1: Global Value (US$ Million) Forecast by Region, 2019 & 2034

Table 2: Global Volume (Tons) Forecast by Region, 2019 & 2034

Table 3: Global Value (US$ Million) Forecast by Product Type, 2019 & 2034

Table 4: Global Volume (Tons) Forecast by Product Type, 2019 & 2034

Table 5: Global Value (US$ Million) Forecast by End-Use Industries, 2019 & 2034

Table 6: Global Volume (Tons) Forecast by End-Use Industries, 2019 & 2034

Table 7: North America Value (US$ Million) Forecast by Country, 2019 & 2034

Table 8: North America Volume (Tons) Forecast by Country, 2019 & 2034

Table 9: North America Value (US$ Million) Forecast by Product Type, 2019 & 2034

Table 10: North America Volume (Tons) Forecast by Product Type, 2019 & 2034

Table 11: North America Value (US$ Million) Forecast by End-Use Industries, 2019 & 2034

Table 12: North America Volume (Tons) Forecast by End-Use Industries, 2019 & 2034

Table 13: Latin America Value (US$ Million) Forecast by Country, 2019 & 2034

Table 14: Latin America Volume (Tons) Forecast by Country, 2019 & 2034

Table 15: Latin America Value (US$ Million) Forecast by Product Type, 2019 & 2034

Table 16: Latin America Volume (Tons) Forecast by Product Type, 2019 & 2034

Table 17: Latin America Value (US$ Million) Forecast by End-Use Industries, 2019 & 2034

Table 18: Latin America Volume (Tons) Forecast by End-Use Industries, 2019 & 2034

Table 19: Western Europe Value (US$ Million) Forecast by Country, 2019 & 2034

Table 20: Western Europe Volume (Tons) Forecast by Country, 2019 & 2034

Table 21: Western Europe Value (US$ Million) Forecast by Product Type, 2019 & 2034

Table 22: Western Europe Volume (Tons) Forecast by Product Type, 2019 & 2034

Table 23: Western Europe Value (US$ Million) Forecast by End-Use Industries, 2019 & 2034

Table 24: Western Europe Volume (Tons) Forecast by End-Use Industries, 2019 & 2034

Table 25: Eastern Europe Value (US$ Million) Forecast by Country, 2019 & 2034

Table 26: Eastern Europe Volume (Tons) Forecast by Country, 2019 & 2034

Table 27: Eastern Europe Value (US$ Million) Forecast by Product Type, 2019 & 2034

Table 28: Eastern Europe Volume (Tons) Forecast by Product Type, 2019 & 2034

Table 29: Eastern Europe Value (US$ Million) Forecast by End-Use Industries, 2019 & 2034

Table 30: Eastern Europe Volume (Tons) Forecast by End-Use Industries, 2019 & 2034

Table 31: East Asia Value (US$ Million) Forecast by Country, 2019 & 2034

Table 32: East Asia Volume (Tons) Forecast by Country, 2019 & 2034

Table 33: East Asia Value (US$ Million) Forecast by Product Type, 2019 & 2034

Table 34: East Asia Volume (Tons) Forecast by Product Type, 2019 & 2034

Table 35: East Asia Value (US$ Million) Forecast by End-Use Industries, 2019 & 2034

Table 36: East Asia Volume (Tons) Forecast by End-Use Industries, 2019 & 2034

Table 37: South Asia Pacific Value (US$ Million) Forecast by Country, 2019 & 2034

Table 38: South Asia Pacific Volume (Tons) Forecast by Country, 2019 & 2034

Table 39: South Asia Pacific Value (US$ Million) Forecast by Product Type, 2019 & 2034

Table 40: South Asia Pacific Volume (Tons) Forecast by Product Type, 2019 & 2034

Table 41: South Asia Pacific Value (US$ Million) Forecast by End-Use Industries, 2019 & 2034

Table 42: South Asia Pacific Volume (Tons) Forecast by End-Use Industries, 2019 & 2034

Table 43: Middle East & Africa Value (US$ Million) Forecast by Country, 2019 & 2034

Table 44: Middle East & Africa Volume (Tons) Forecast by Country, 2019 & 2034

Table 45: Middle East & Africa Value (US$ Million) Forecast by Product Type, 2019 & 2034

Table 46: Middle East & Africa Volume (Tons) Forecast by Product Type, 2019 & 2034

Table 47: Middle East & Africa Value (US$ Million) Forecast by End-Use Industries, 2019 & 2034

Table 48: Middle East & Africa Volume (Tons) Forecast by End-Use Industries, 2019 & 2034

List of Charts

Figure 1: Global Value (US$ Million) by Product Type, 2024 & 2034

Figure 2: Global Value (US$ Million) by End-Use Industries, 2024 & 2034

Figure 3: Global Value (US$ Million) by Region, 2024 & 2034

Figure 4: Global Value (US$ Million) Analysis by Region, 2019 & 2034

Figure 5: Global Volume (Tons) Analysis by Region, 2019 & 2034

Figure 6: Global Value Share (%) and BPS Analysis by Region, 2024 & 2034

Figure 7: Global Y-o-Y Growth (%) Projections by Region, 2024 to 2034

Figure 8: Global Value (US$ Million) Analysis by Product Type, 2019 & 2034

Figure 9: Global Volume (Tons) Analysis by Product Type, 2019 & 2034

Figure 10: Global Value Share (%) and BPS Analysis by Product Type, 2024 & 2034

Figure 11: Global Y-o-Y Growth (%) Projections by Product Type, 2024 to 2034

Figure 12: Global Value (US$ Million) Analysis by End-Use Industries, 2019 & 2034

Figure 13: Global Volume (Tons) Analysis by End-Use Industries, 2019 & 2034

Figure 14: Global Value Share (%) and BPS Analysis by End-Use Industries, 2024 & 2034

Figure 15: Global Y-o-Y Growth (%) Projections by End-Use Industries, 2024 to 2034

Figure 16: Global Attractiveness by Product Type, 2024 to 2034

Figure 17: Global Attractiveness by End-Use Industries, 2024 to 2034

Figure 18: Global Attractiveness by Region, 2024 to 2034

Figure 19: North America Value (US$ Million) by Product Type, 2024 & 2034

Figure 20: North America Value (US$ Million) by End-Use Industries, 2024 & 2034

Figure 21: North America Value (US$ Million) by Country, 2024 & 2034

Figure 22: North America Value (US$ Million) Analysis by Country, 2019 & 2034

Figure 23: North America Volume (Tons) Analysis by Country, 2019 & 2034

Figure 24: North America Value Share (%) and BPS Analysis by Country, 2024 & 2034

Figure 25: North America Y-o-Y Growth (%) Projections by Country, 2024 to 2034

Figure 26: North America Value (US$ Million) Analysis by Product Type, 2019 & 2034

Figure 27: North America Volume (Tons) Analysis by Product Type, 2019 & 2034

Figure 28: North America Value Share (%) and BPS Analysis by Product Type, 2024 & 2034

Figure 29: North America Y-o-Y Growth (%) Projections by Product Type, 2024 to 2034

Figure 30: North America Value (US$ Million) Analysis by End-Use Industries, 2019 & 2034

Figure 31: North America Volume (Tons) Analysis by End-Use Industries, 2019 & 2034

Figure 32: North America Value Share (%) and BPS Analysis by End-Use Industries, 2024 & 2034

Figure 33: North America Y-o-Y Growth (%) Projections by End-Use Industries, 2024 to 2034

Figure 34: North America Attractiveness by Product Type, 2024 to 2034

Figure 35: North America Attractiveness by End-Use Industries, 2024 to 2034

Figure 36: North America Attractiveness by Country, 2024 to 2034

Figure 37: Latin America Value (US$ Million) by Product Type, 2024 & 2034

Figure 38: Latin America Value (US$ Million) by End-Use Industries, 2024 & 2034

Figure 39: Latin America Value (US$ Million) by Country, 2024 & 2034

Figure 40: Latin America Value (US$ Million) Analysis by Country, 2019 & 2034

Figure 41: Latin America Volume (Tons) Analysis by Country, 2019 & 2034

Figure 42: Latin America Value Share (%) and BPS Analysis by Country, 2024 & 2034

Figure 43: Latin America Y-o-Y Growth (%) Projections by Country, 2024 to 2034

Figure 44: Latin America Value (US$ Million) Analysis by Product Type, 2019 & 2034

Figure 45: Latin America Volume (Tons) Analysis by Product Type, 2019 & 2034

Figure 46: Latin America Value Share (%) and BPS Analysis by Product Type, 2024 & 2034

Figure 47: Latin America Y-o-Y Growth (%) Projections by Product Type, 2024 to 2034

Figure 48: Latin America Value (US$ Million) Analysis by End-Use Industries, 2019 & 2034

Figure 49: Latin America Volume (Tons) Analysis by End-Use Industries, 2019 & 2034

Figure 50: Latin America Value Share (%) and BPS Analysis by End-Use Industries, 2024 & 2034

Figure 51: Latin America Y-o-Y Growth (%) Projections by End-Use Industries, 2024 to 2034

Figure 52: Latin America Attractiveness by Product Type, 2024 to 2034

Figure 53: Latin America Attractiveness by End-Use Industries, 2024 to 2034

Figure 54: Latin America Attractiveness by Country, 2024 to 2034

Figure 55: Western Europe Value (US$ Million) by Product Type, 2024 & 2034

Figure 56: Western Europe Value (US$ Million) by End-Use Industries, 2024 & 2034

Figure 57: Western Europe Value (US$ Million) by Country, 2024 & 2034

Figure 58: Western Europe Value (US$ Million) Analysis by Country, 2019 & 2034

Figure 59: Western Europe Volume (Tons) Analysis by Country, 2019 & 2034

Figure 60: Western Europe Value Share (%) and BPS Analysis by Country, 2024 & 2034

Figure 61: Western Europe Y-o-Y Growth (%) Projections by Country, 2024 to 2034

Figure 62: Western Europe Value (US$ Million) Analysis by Product Type, 2019 & 2034

Figure 63: Western Europe Volume (Tons) Analysis by Product Type, 2019 & 2034

Figure 64: Western Europe Value Share (%) and BPS Analysis by Product Type, 2024 & 2034

Figure 65: Western Europe Y-o-Y Growth (%) Projections by Product Type, 2024 to 2034

Figure 66: Western Europe Value (US$ Million) Analysis by End-Use Industries, 2019 & 2034

Figure 67: Western Europe Volume (Tons) Analysis by End-Use Industries, 2019 & 2034

Figure 68: Western Europe Value Share (%) and BPS Analysis by End-Use Industries, 2024 & 2034

Figure 69: Western Europe Y-o-Y Growth (%) Projections by End-Use Industries, 2024 to 2034

Figure 70: Western Europe Attractiveness by Product Type, 2024 to 2034

Figure 71: Western Europe Attractiveness by End-Use Industries, 2024 to 2034

Figure 72: Western Europe Attractiveness by Country, 2024 to 2034

Figure 73: Eastern Europe Value (US$ Million) by Product Type, 2024 & 2034

Figure 74: Eastern Europe Value (US$ Million) by End-Use Industries, 2024 & 2034

Figure 75: Eastern Europe Value (US$ Million) by Country, 2024 & 2034

Figure 76: Eastern Europe Value (US$ Million) Analysis by Country, 2019 & 2034

Figure 77: Eastern Europe Volume (Tons) Analysis by Country, 2019 & 2034

Figure 78: Eastern Europe Value Share (%) and BPS Analysis by Country, 2024 & 2034

Figure 79: Eastern Europe Y-o-Y Growth (%) Projections by Country, 2024 to 2034

Figure 80: Eastern Europe Value (US$ Million) Analysis by Product Type, 2019 & 2034

Figure 81: Eastern Europe Volume (Tons) Analysis by Product Type, 2019 & 2034

Figure 82: Eastern Europe Value Share (%) and BPS Analysis by Product Type, 2024 & 2034

Figure 83: Eastern Europe Y-o-Y Growth (%) Projections by Product Type, 2024 to 2034

Figure 84: Eastern Europe Value (US$ Million) Analysis by End-Use Industries, 2019 & 2034

Figure 85: Eastern Europe Volume (Tons) Analysis by End-Use Industries, 2019 & 2034

Figure 86: Eastern Europe Value Share (%) and BPS Analysis by End-Use Industries, 2024 & 2034

Figure 87: Eastern Europe Y-o-Y Growth (%) Projections by End-Use Industries, 2024 to 2034

Figure 88: Eastern Europe Attractiveness by Product Type, 2024 to 2034

Figure 89: Eastern Europe Attractiveness by End-Use Industries, 2024 to 2034

Figure 90: Eastern Europe Attractiveness by Country, 2024 to 2034

Figure 91: East Asia Value (US$ Million) by Product Type, 2024 & 2034

Figure 92: East Asia Value (US$ Million) by End-Use Industries, 2024 & 2034

Figure 93: East Asia Value (US$ Million) by Country, 2024 & 2034

Figure 94: East Asia Value (US$ Million) Analysis by Country, 2019 & 2034

Figure 95: East Asia Volume (Tons) Analysis by Country, 2019 & 2034

Figure 96: East Asia Value Share (%) and BPS Analysis by Country, 2024 & 2034

Figure 97: East Asia Y-o-Y Growth (%) Projections by Country, 2024 to 2034

Figure 98: East Asia Value (US$ Million) Analysis by Product Type, 2019 & 2034

Figure 99: East Asia Volume (Tons) Analysis by Product Type, 2019 & 2034

Figure 100: East Asia Value Share (%) and BPS Analysis by Product Type, 2024 & 2034

Figure 101: East Asia Y-o-Y Growth (%) Projections by Product Type, 2024 to 2034

Figure 102: East Asia Value (US$ Million) Analysis by End-Use Industries, 2019 & 2034

Figure 103: East Asia Volume (Tons) Analysis by End-Use Industries, 2019 & 2034

Figure 104: East Asia Value Share (%) and BPS Analysis by End-Use Industries, 2024 & 2034

Figure 105: East Asia Y-o-Y Growth (%) Projections by End-Use Industries, 2024 to 2034

Figure 106: East Asia Attractiveness by Product Type, 2024 to 2034

Figure 107: East Asia Attractiveness by End-Use Industries, 2024 to 2034

Figure 108: East Asia Attractiveness by Country, 2024 to 2034

Figure 109: South Asia Pacific Value (US$ Million) by Product Type, 2024 & 2034

Figure 110: South Asia Pacific Value (US$ Million) by End-Use Industries, 2024 & 2034

Figure 111: South Asia Pacific Value (US$ Million) by Country, 2024 & 2034

Figure 112: South Asia Pacific Value (US$ Million) Analysis by Country, 2019 & 2034

Figure 113: South Asia Pacific Volume (Tons) Analysis by Country, 2019 & 2034

Figure 114: South Asia Pacific Value Share (%) and BPS Analysis by Country, 2024 & 2034

Figure 115: South Asia Pacific Y-o-Y Growth (%) Projections by Country, 2024 to 2034

Figure 116: South Asia Pacific Value (US$ Million) Analysis by Product Type, 2019 & 2034

Figure 117: South Asia Pacific Volume (Tons) Analysis by Product Type, 2019 & 2034

Figure 118: South Asia Pacific Value Share (%) and BPS Analysis by Product Type, 2024 & 2034

Figure 119: South Asia Pacific Y-o-Y Growth (%) Projections by Product Type, 2024 to 2034

Figure 120: South Asia Pacific Value (US$ Million) Analysis by End-Use Industries, 2019 & 2034

Figure 121: South Asia Pacific Volume (Tons) Analysis by End-Use Industries, 2019 & 2034

Figure 122: South Asia Pacific Value Share (%) and BPS Analysis by End-Use Industries, 2024 & 2034

Figure 123: South Asia Pacific Y-o-Y Growth (%) Projections by End-Use Industries, 2024 to 2034

Figure 124: South Asia Pacific Attractiveness by Product Type, 2024 to 2034

Figure 125: South Asia Pacific Attractiveness by End-Use Industries, 2024 to 2034

Figure 126: South Asia Pacific Attractiveness by Country, 2024 to 2034

Figure 127: Middle East & Africa Value (US$ Million) by Product Type, 2024 & 2034

Figure 128: Middle East & Africa Value (US$ Million) by End-Use Industries, 2024 & 2034

Figure 129: Middle East & Africa Value (US$ Million) by Country, 2024 & 2034

Figure 130: Middle East & Africa Value (US$ Million) Analysis by Country, 2019 & 2034

Figure 131: Middle East & Africa Volume (Tons) Analysis by Country, 2019 & 2034

Figure 132: Middle East & Africa Value Share (%) and BPS Analysis by Country, 2024 & 2034

Figure 133: Middle East & Africa Y-o-Y Growth (%) Projections by Country, 2024 to 2034

Figure 134: Middle East & Africa Value (US$ Million) Analysis by Product Type, 2019 & 2034

Figure 135: Middle East & Africa Volume (Tons) Analysis by Product Type, 2019 & 2034

Figure 136: Middle East & Africa Value Share (%) and BPS Analysis by Product Type, 2024 & 2034

Figure 137: Middle East & Africa Y-o-Y Growth (%) Projections by Product Type, 2024 to 2034

Figure 138: Middle East & Africa Value (US$ Million) Analysis by End-Use Industries, 2019 & 2034

Figure 139: Middle East & Africa Volume (Tons) Analysis by End-Use Industries, 2019 & 2034

Figure 140: Middle East & Africa Value Share (%) and BPS Analysis by End-Use Industries, 2024 & 2034

Figure 141: Middle East & Africa Y-o-Y Growth (%) Projections by End-Use Industries, 2024 to 2034

Figure 142: Middle East & Africa Attractiveness by Product Type, 2024 to 2034

Figure 143: Middle East & Africa Attractiveness by End-Use Industries, 2024 to 2034

Figure 144: Middle East & Africa Attractiveness by Country, 2024 to 2034

Recommendations

Industrial Automation

Forged and Casting Component Market

Published : November 2023

Industrial Automation

Metal Stampings, Forgings, and Castings Market

Published : May 2023

Explore Industrial Automation Insights

View Reports

Grid Casting Machine Market