Reports

- Global Locations -

Headquarters

Future Market Insights, Inc.

Christiana Corporate, 200
Continental Drive, Suite 401,
Newark, Delaware - 19713,
United States

T: +1-347-918-3531

Americas

Future Market Insights, Inc.

616 Corporate Way, Suite 2-9018,
Valley Cottage, NY 10989, United States

MEA

Future Market Insights

1602-6 Jumeirah Bay X2 Tower, Plot No: JLT-PH2-X2A,
Jumeirah Lakes Towers, Dubai,
United Arab Emirates

Europe

Future Market Insights

3rd Floor, 207 Regent Street,
W1B 3HH London
United Kingdom

T: + 44 (0) 20 8123 9659

Asia Pacific

Future Market Insights

IndiaLand Global Tech Park, Unit UG-1, Behind Grand HighStreet, Phase 1, Hinjawadi, MH, Pune – 411057, India

Check Weighing Equipment Market Outlook from 2024 to 2034

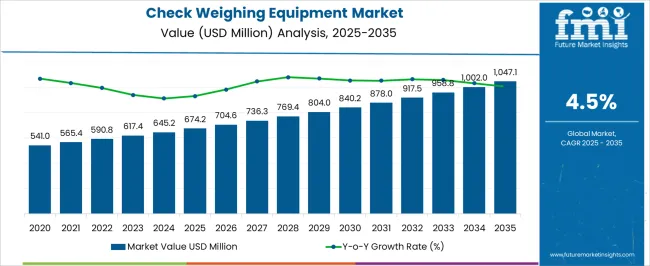
The global check weighing equipment market size reached US$ 619.5 million in 2023. Over the forecast period, global check weighing equipment demand is anticipated to rise at 4.5% CAGR. The market is predicted to increase from US$ 645.2 million in 2024 to US$ 1,023.9 million by 2034.

Attributes Key Insights
Check Weighing Equipment Market Size in 2023 US$ 619.5 million
Estimated Check Weighing Equipment Market Value (2024) US$ 645.2 million
Projected Check Weighing Equipment Market Revenue (2034) US$ 1,023.9 million
Value-based Check Weighing Equipment Market CAGR (2024 to 2034) 4.5%

Don't pay for what you don't need

Customize your report by selecting specific countries or regions and save 30%!

Key Check Weighing Equipment Market Highlights

  • Market to Expand over 1.6X through 2034

The global check weighing equipment market is projected to expand over 1.6X through 2034, with a 2.4% increase in the expected CAGR compared to the historical one. This is due to the increasing demand for automated weighing solutions.

Global sales of check-weighing equipment are expected to rise due to the growing demand for customization & flexible solutions and the rising preference for cloud-based weighing systems. By 2034, the total market revenue is set to reach US$ 1,023.9 million.

  • East Asia Leads the Check Weighing Equipment Market

East Asia is poised to emerge as a frontrunner in driving the demand for check weighing equipment, exhibiting a leading market share of 22.9% by 2034. This significant growth trajectory is anticipated to unfold by 2024, marking East Asia's pivotal role in shaping the check weighing equipment market landscape.

  • The surging demand for precise and efficient weighing technologies across diverse industries, including manufacturing, logistics, and others, positions East Asia as a key player driving innovation and meeting the evolving needs of the global market.
  • East Asia's inclination toward technological innovations and early adoption of Industry 4.0 principles positions it at the forefront of integrating advanced technologies into industrial processes.
  • The market for check weighing equipment in East Asia is anticipated to witness sustained growth, reflecting the region's commitment to efficiency, precision, and compliance with evolving industry standards.
  • Dominance of 13 to 60kg Load Capacity in the Check Weighing Equipment Market

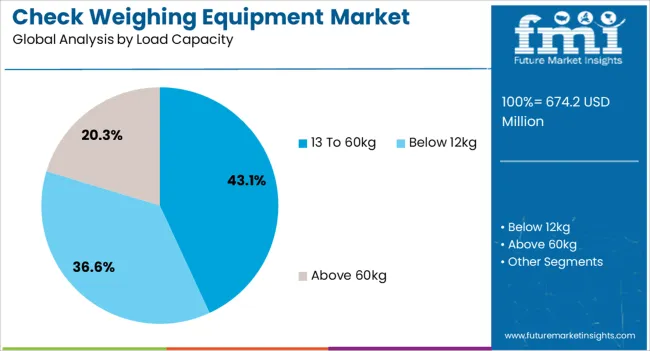
The 13 to 60 kg segment is expected to lead the global check-weighing equipment market with a volume share of 43.1% in 2024.

  • The 13 to 60kg load capacity segment plays a pivotal role in catering to the diverse weighing needs across industries, striking a balance between precision and versatility.
  • Products falling within the 13 to 60kg load capacity bracket are crucial for a wide array of applications, from packaging in the food and beverage sector to ensuring compliance in pharmaceutical manufacturing.
  • The reliability and accuracy offered by check weighing equipment within this segment make it indispensable for companies aiming to optimize production efficiency, maintain product quality, and meet regulatory standards in several dynamic & evolving sectors.

2019 to 2023 Check Weighing Equipment Market Outlook Vs. 2024 to 2034

The check weighing equipment market grew at a CAGR of 2.3% between 2019 and 2023. Total market revenue reached a value of US$ 619.5 million in 2023. In the forecast period, the check weighing equipment industry is set to thrive at a CAGR of 4.5%.

Historical CAGR (2019 to 2023) 2.3%
Forecast CAGR (2024 to 2034) 4.5%

The global check-weighing equipment market witnessed moderate growth between 2019 and 2023. Rising awareness of the benefits of using check-weighing equipment to optimize processes and reduce manual errors fueled market growth.

The COVID-19 pandemic highlighted the critical relevance of precise measurements for medication manufacturing and dose accuracy in the pharmaceutical and healthcare industries. The epidemic hastened the introduction of automation, increasing the need for sophisticated weighing systems to boost productivity and reduce reliance on manual labor.

Nikhil Kaitwade
Nikhil Kaitwade

Principal Consultant

Talk to Analyst

Find your sweet spots for generating winning opportunities in this market.

Future Scope of the Check Weighing Equipment Market

Over the forecast period, the global check weighing equipment market is poised to exhibit healthy growth, totaling a valuation of US$ 1,023.9 million by 2034. Increasing manufacturing activities across several sectors necessitated precise weighing equipment for quality control and production efficiency, driving demand for check weighing equipment.

Technological advancements, such as the integration of automation and Industry 4.0 principles, led to a growing demand for more sophisticated weighing solutions.

Strict regulatory standards and a focus on accurate measurements in industries such as pharmaceuticals and food & beverages are contributing to the adoption of check weighing equipment.

Check Weighing Equipment Market Trends

  • Growing Stringency of Regulations

The check weighing equipment market is experiencing a notable surge in demand due to the growing stringency of regulations, particularly in the food and pharmaceutical industries. As regulatory bodies enforce strict standards to ensure consumer safety and product quality, manufacturers in these sectors are investing in precise and reliable check-weighing solutions.

In the food industry, accurate weight measurement is crucial for compliance with labeling requirements and preventing under or overfilling packaged products. The demand for checkweighers in the pharma industry is increasing for calculating the weight of capsules, standing pouches, sachets/sticks, bags/cartons/cases, and bottles/cans.

  • Rising E-commerce Industry

The thriving e-commerce industry stands out as a significant driver propelling the demand for check-weighing equipment. As the e-commerce sector continues its exponential growth globally, there is an escalating need for accurate and efficient weight verification processes across warehouses and distribution centers.

In the e-commerce supply chain, precision in weighing plays a crucial role in several aspects, including order fulfillment, inventory management, and shipping accuracy. Checkweighing equipment ensures that packaged products meet specified weight criteria, reducing shipment errors and enhancing customer satisfaction.

  • Increasing Adoption in the Food and Beverage Industry

The escalating adoption of check weighing equipment in the food & beverage industry is a pivotal driver for the market's growth. With a focus on quality control, efficiency, and compliance with stringent regulations, the food and beverage sector increasingly integrates advanced check-weighing solutions into its production processes.

Checkweighers ensure accurate weight measurements of packaged food products, helping manufacturers maintain consistency and meet regulatory standards. As the demand for packaged and processed foods rises globally, reliable and high-throughput check-weighing equipment becomes paramount.

Get the data you need at a Fraction of the cost

Personalize your report by choosing insights you need
and save 40%!

Key Factors Restraining Check Weighing Equipment Market Growth

  • High Initial Investment and Maintenance Costs

The market for check weighing equipment is severely constrained by the high initial outlay and ongoing maintenance expenses linked to these advanced systems. For certain organizations, acquiring and installing sophisticated weighing equipment can be unaffordable, creating an obstacle to entrance.

  • Availability of Low-quality Check Weighing Equipment

An increase in low-quality checkweigher systems is restraining the market growth. Using low-quality checkweigher systems that do not require maintenance is set to result in unexpected negative consequences in small to large industrial premises.

Customers encountering these low-quality options are expected to experience operational inefficiencies, inaccuracies in weight measurement, and increased maintenance requirements. This hampers the trust in check-weighing equipment, making it crucial for buyers to carefully assess and select reputable suppliers to ensure the reliability and effectiveness of their checkweighing equipment.

Comparative View of Adjacent Check Weighing Equipment Markets

The section analyzes the industrial weighing equipment market and glass reactor market compared to the check weighing equipment market. The movement and trends in the associated markets have been highlighted in the section below.

The industrial weighing equipment market is projected to register a CAGR of 6.0% over the forecast period. Rising demand for weighing equipment that provides high levels of precision is expected to surge demand for industrial weighing equipment.

The glass reactor market is estimated to expand at a CAGR of 6.5% over the forecast period. The growing interest in glass reactors that facilitate continuous flow processes is anticipated to drive market expansion.

Check Weighing Equipment/Automatic Checkweigher Market:

Attributes Check Weighing Equipment/Automatic Checkweigher Market
CAGR (2024 to 2034) 4.5%
Growth Factor The escalating adoption of check weighing equipment in the food & beverage industry serves as a pivotal driver for the market's growth.
Automatic Checkweigher Market Trends The adoption of advanced and precise check-weighing solutions is fueled by industry standards and regulations, particularly in the pharmaceutical industry.

Industrial Weighing Equipment Market:

Attributes Industrial Weighing Equipment Market
CAGR (2024 to 2034) 6.0%
Growth Factor Portable industrial weighing equipment offers versatility and user-friendliness in agriculture and logistics settings, fueling the market.
Key Trend Automation, data analytics, and the internet of things (IoT) are the Industry 4.0 technologies that the industrial weighing equipment market is incorporating to enhance real-time monitoring and operational effectiveness.

Glass Reactor Market:

Attributes Glass Reactor Market
CAGR (2024 to 2034) 6.5%
Growth Factor The glass reactor market is influenced by a shift in technology toward single-use or throwaway items. Single-use glass reactors do not require cleaning or sterilizing in between batches as they are made for specific uses.
Key Trend In order to increase safety, durability, and efficiency, manufacturers are concentrating on creating glass reactors with better designs and materials. This covers advancements in the materials utilized for construction, sealing systems, and reactor design as a whole.

Country-wise Insights

The table below highlights key countries’ check weighing equipment market revenues. China, the United States, and India are expected to remain the top three consumers of check weighing equipment, with expected valuations of US$ 92.9 million, US$ 87.2 million, and US$ 64.5 million, respectively, in 2034.

Countries Check Weighing Equipment Market Revenue (2034)
United States US$ 87.2 million
China US$ 92.9 million
Japan US$ 77.5 million
South Korea US$ 64.4 million
India US$ 64.5 million

The table below shows the estimated growth rates of the top six countries. India, South Korea, and Japan are set to record high CAGRs of 4.9%, 5.9%, and 5.1%, respectively, through 2034.

Countries Projected CAGR (2024 to 2034)
United States 3.0%
United Kingdom 3.6%
China 4.6%
Japan 5.1%
South Korea 5.9%
India 4.9%

Growing Demand for Energy-efficient Weighing Equipment to Spur the United States

The United States check weighing equipment market is projected to reach US$ 87.2 million by 2034. Over the assessment period, demand for check weighing equipment in the United States is set to rise at 3.0% CAGR. The factors driving the country’s growth are as follows:

  • The United States check weighing equipment market is expanding and innovating due to rising manufacturing process precision requirements and technological breakthroughs.
  • As industries such as food and pharmaceuticals prioritize quality control and regulatory compliance, the usage of advanced check-weighing solutions is on the rise.
  • Manufacturers include cutting-edge features such as better load cell technology and communication with Industry 4.0 technologies to increase accuracy and efficiency.

Rising Industrialization and Infrastructure Projects in China Push Growth

Sales of check weighing equipment in China are projected to soar at a CAGR of 4.6% during the assessment period. The market is anticipated to reach US$ 92.9 million by 2034. The factors responsible for this growth are as follows:

  • Due to a combination of concurrent technology breakthroughs and the increasing rate of industrialization, the check weighing equipment market in China is experiencing a remarkable surge.
  • The government's severe rules and regulations, which create a favorable environment for manufacturing development, demonstrate China's consistent commitment to industrial expansion.

Growing Manufacturing Landscape in India Paving the Road for Success

India's check weighing equipment market value is anticipated to reach US$ 64.5 million by 2034. Over the forecast period, check weighing equipment demand is set to increase at a robust CAGR of 4.9%. The factors driving the market growth are as follows:

  • India's checkweigher market is experiencing a significant surge amid the country's expanding manufacturing landscape, fueled by initiatives such as ‘Make in India.’
  • India's active participation in global trade and the need to meet export demands further bolster the adoption of checkweighers, ensuring product consistency and adherence to weight specifications.
  • Technological advancements, government initiatives promoting industry-friendly policies, and the broad trend of automation in manufacturing processes contribute to the widespread integration of check-weighing equipment across sectors.

Rising Sales of Electronic Weighing Machines to Make Japan a Lucrative Pocket

Japan is expected to surge at a CAGR of 5.1% through 2034. This is attributable to a combination of factors, including:

  • The manufacturing, logistics, and mining sectors are seeing a sharp increase in demand for precise weighing solutions in Japan.
  • Investing in state-of-the-art check weighing equipment is a trend among manufacturers who want to increase operational efficiency by embracing sophisticated technologies such as automation and digitalization.
  • The market is growing rapidly as a result of the government's emphasis on standardization and quality control.

Continuing Technical Improvements Propelling Demand in the United Kingdom

The United Kingdom is expected to rise at 3.6% CAGR by 2034. The primary factors bolstering the market size are:

  • The demand for sophisticated weighing systems is driven by the nation's quick industrialization and an increasing focus on accuracy & efficiency in manufacturing processes.
  • Modern weighing equipment is gaining traction in the United Kingdom as enterprises embrace automation and Industry 4.0 technologies to maximize output, guarantee quality control, and simplify transportation.

Category-wise Insights

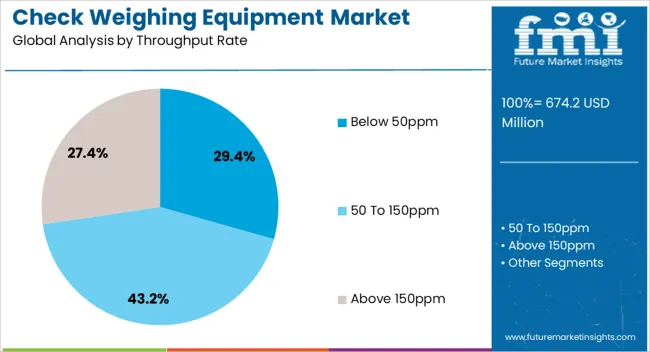
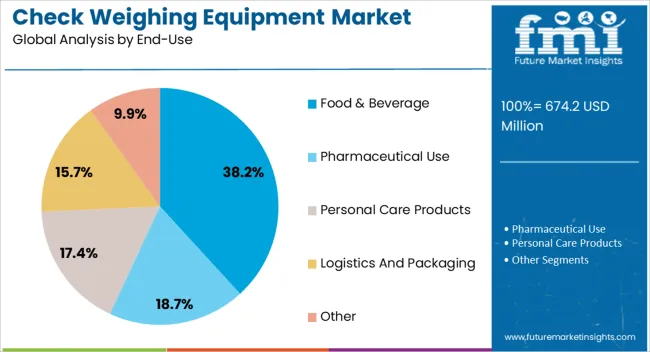
The section below shows the above 150ppm segment dominating based on throughput rate. It is forecast to thrive at 4.6% CAGR between 2024 and 2034. Based on end-use, the food and beverage segment is anticipated to hold a dominant share through 2034. It is set to exhibit a CAGR of 3.6% during the forecast period.

Above 150ppm Segment to Lead by Throughput Rate by 2034

Top Segment (Throughput Rate) Above 150ppm
CAGR (2024 to 2034) 4.6%
  • Food, pharmaceutical, and manufacturing industries are increasingly adopting check-weighing solutions that are capable of handling over 150 pieces per minute.
  • Manufacturers increasingly rely on advanced checkweighers equipped with sophisticated technology, precision load cells, and real-time data analytics to ensure speed & precision in weight measurements.
  • The rising demand for the above 150ppm rate underscores the industry's commitment to achieving optimal efficiency and meeting the challenges of modern, fast-paced production requirements.

Demand to Remain High in the Food and Beverage Industry

Top Segment (End-use) Food and Beverages
Projected CAGR (2024 to 2034) 3.6%
  • To maintain compliance with high regulatory standards, check weighers are essential for assuring precise weight measurements of packaged food and beverages.
  • Manufacturers increasingly depend on this precision equipment to confirm weights, prevent underfilling or overfilling, and comply with labeling rules as consumer expectations for product safety and consistency rise.
  • The global trend toward processed and packaged foods increases the demand for high-throughput, dependable check-weighing equipment.

Competitive Landscape

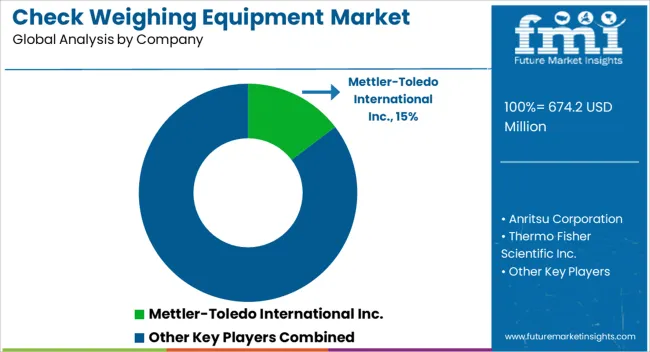
The global check weighing equipment market is consolidated, with leading players accounting for around 40% to 45% of the share. Mettler-Toledo International Inc., Thermo Fisher Scientific Inc., Minebea Intec, Teraoka Seiko Co., Ltd., Bizerba, Soc. Coop. Bilanciai Campogalliano and NEMESIS are the leading manufacturers and suppliers of check-weighing equipment listed in the report.

Key companies are investing in continuous research to produce new items and increase their capacity to meet end-user demand. They are also inclined toward adopting strategies to strengthen their footprint, including acquisitions, partnerships, mergers, and facility expansions.

Recent Developments

  • In October 2022, Mettler-Toledo Product Inspection launched a new Track & Trace and Checkweighing combination solution for pharmaceutical and cosmetics industries.
  • In April 2021, Loma Systems, a United Kingdom-based company, launched two new checkweigher systems: the CW3 RUN-WET Combo and the basic CW3 RUN-WET.

Key Companies Profiled

  • Mettler-Toledo International Inc.
  • Anritsu Corporation
  • Thermo Fisher ScientificInc.
  • Minebea Intec GmbH
  • Teraoka Seiko Co., Ltd.
  • Bizerba SE&Co.KG
  • Soc.Coop.Bilanciai Campogalliano
  • WIPOTEC-OCS GmbH
  • ANTARES VISIONS.p.A
  • SF Engineering
  • CASSEL Messtechnik GmbH
  • Marel
  • IshidaCo., Ltd.

Check Weighing Equipment Market Segmentation by Category

By Throughput Rate:

  • Below 50ppm
  • 50 to 150ppm
  • Above 150ppm

By Load Capacity:

  • Below 12kg
  • 13 to 60kg
  • Above 60kg

By End-use:

  • Food & Beverage
    • Dairy Products
    • Flesh Foods
    • Agricultural Produce
    • Ready to Eat
    • Bakery and Confectionary
  • Pharmaceutical Use
  • Personal Care Products
  • Logistics and Packaging
  • Other

By Region:

  • North America
  • Latin America
  • Western Europe
  • Eastern Europe
  • East Asia
  • South Asia and Pacific
  • Middle East and Africa

Frequently Asked Questions

How big is the check weighing equipment market?

The market is set to reach US$ 645.2 million in 2024.

What is the forecast for the check weighing equipment market?

Demand for check weighing equipment is slated to expand at a 4.5% CAGR by 2034.

What is the outlook for the check weighing equipment market?

The market is expected to reach US$ 1,023.9 million in 2034.

Who are the key players in the check weighing equipment market?

Anritsu Corporation, Teraoka Seiko Co., Ltd. and Bizerba are the key players.

Which end-use would lead the check weighing equipment market?

Food and beverages segment is estimated to surge at 3.6% CAGR by 2034.

Table of Content

1. Executive Summary

    1.1. Global Market Outlook

    1.2. Demand Side Trends

    1.3. Supply Side Trends

    1.4. Technology Roadmap

    1.5. Analysis and Recommendations

2. Market Overview

    2.1. Market Coverage / Taxonomy

    2.2. Market Definition / Scope / Limitations

3. Key Market Trends

    3.1. Key Trends Impacting the Market

    3.2. Product Innovation / Development Trends

4. Key Success Factors

    4.1. Product Adoption / Usage Analysis

    4.2. Product USPs / Features

    4.3. Strategic Promotional Strategies

5. Global Market Demand Analysis 2019 to 2023 and Forecast, 2024 to 2034

    5.1. Historical Market Volume (Units) Analysis, 2019 to 2023

    5.2. Current and Future Market Volume (Units) Projections, 2024 to 2034

    5.3. Y-o-Y Growth Trend Analysis

6. Global Market - Pricing Analysis

    6.1. Regional Pricing Analysis By Throughput Rate

    6.2. Global Average Pricing Analysis Benchmark

7. Global Market Demand (in Value or Size in US$ million) Analysis 2019 to 2023 and Forecast, 2024 to 2034

    7.1. Historical Market Value (US$ million) Analysis, 2019 to 2023

    7.2. Current and Future Market Value (US$ million) Projections, 2024 to 2034

        7.2.1. Y-o-Y Growth Trend Analysis

        7.2.2. Absolute $ Opportunity Analysis

8. Market Background

    8.1. Macro-Economic Factors

        8.1.1. Global GDP Growth Outlook

        8.1.2. Global Packaging Industry Overview

        8.1.3. Manufacturing Value-Added

        8.1.4. Industry Value Added

        8.1.5. Parent Market Outlook

        8.1.6. Other Macro-Economic Factors

    8.2. Forecast Factors - Relevance & Impact

        8.2.1. Top Companies Historical Growth

        8.2.2. GDP Growth Forecast

        8.2.3. Manufacturing Industry Forecast

        8.2.4. Global Urbanization Growth Outlook

        8.2.5. End-use Industry Growth Outlook

        8.2.6. Other Forecast Factors

    8.3. Value Chain

        8.3.1. Product Manufacturers

        8.3.2. End Users

        8.3.3. Avg. Profitability Margins

    8.4. COVID-19 Crisis - Impact Assessment

        8.4.1. Current Statistics

        8.4.2. Short-Mid-Long Term Outlook

        8.4.3. Likely Rebound

    8.5. Market Dynamics

        8.5.1. Drivers

        8.5.2. Restraints

        8.5.3. Opportunity Analysis

    8.6. PESTLE Analysis

    8.7. Patent Analysis

9. Global Market Analysis 2019 to 2023 and Forecast 2024 to 2034, By Throughput Rate

    9.1. Introduction / Key Findings

    9.2. Historical Market Size (US$ million) and Volume Analysis By Throughput Rate, 2019 to 2023

    9.3. Current and Future Market Size (US$ million) and Volume Analysis and Forecast By Throughput Rate, 2024 to 2034

        9.3.1. Below 50ppm

        9.3.2. 50 to 150ppm

        9.3.3. Above 150ppm

    9.4. Market Attractiveness Analysis By Throughput Rate

10. Global Market Analysis 2019 to 2023 and Forecast 2024 to 2034, By Load Capacity

    10.1. Introduction / Key Findings

    10.2. Historical Market Size (US$ million) and Volume Analysis By Load Capacity, 2019 to 2023

    10.3. Current and Future Market Size (US$ million) and Volume Analysis and Forecast By Load Capacity, 2024 to 2034

        10.3.1. Below 12kg

        10.3.2. 13 to 60kg

        10.3.3. Above 60kg

    10.4. Market Attractiveness Analysis By Load Capacity

11. Global Market Analysis 2019 to 2023 and Forecast 2024 to 2034, By End-use

    11.1. Introduction / Key Findings

    11.2. Historical Market Size (US$ million) and Volume Analysis By End-use, 2019 to 2023

    11.3. Current and Future Market Size (US$ million) and Volume Analysis and Forecast By End-use, 2024 to 2034

        11.3.1. Food and Beverages

            11.3.1.1. Dairy Products

            11.3.1.2. Flesh Foods

            11.3.1.3. Agricultural Produce

            11.3.1.4. Ready to Eat

            11.3.1.5. Bakery and Confectionary

        11.3.2. Pharmaceutical Use

        11.3.3. Personal Care Products

        11.3.4. Logistics and Packaging

        11.3.5. Other

    11.4. Market Attractiveness Analysis By End-use

12. Global Market Analysis 2019 to 2023 and Forecast 2024 to 2034, by Region

    12.1. Introduction

    12.2. Historical Market Size (US$ million) and Volume Analysis By Region, 2019 to 2023

    12.3. Current Market Size (US$ million) and Volume Analysis and Forecast By Region, 2024 to 2034

        12.3.1. North America

        12.3.2. Latin America

        12.3.3. East Asia

        12.3.4. South Asia Pacific

        12.3.5. Western Europe

        12.3.6. Eastern Europe

        12.3.7. Middle East and Africa

    12.4. Market Attractiveness Analysis By Region

13. North America Market Analysis 2019 to 2023 and Forecast 2024 to 2034

    13.1. Introduction

    13.2. Pricing Analysis

    13.3. Historical Market Size (US$ million) and Volume Trend Analysis By Market Taxonomy, 2019 to 2023

    13.4. Market Size (US$ million) and Volume Forecast By Market Taxonomy, 2024 to 2034

        13.4.1. By Country

            13.4.1.1. United States

            13.4.1.2. Canada

            13.4.1.3. Mexico

        13.4.2. By Throughput Rate

        13.4.3. By Load Capacity

        13.4.4. By End-use

    13.5. Market Attractiveness Analysis

        13.5.1. By Country

        13.5.2. By Throughput Rate

        13.5.3. By Load Capacity

        13.5.4. By End-use

    13.6. Market Trends

    13.7. Key Market Participants - Intensity Mapping

    13.8. Drivers and Restraints - Impact Analysis

14. Latin America Market Analysis 2019 to 2023 and Forecast 2024 to 2034

    14.1. Introduction

    14.2. Pricing Analysis

    14.3. Historical Market Size (US$ million) and Volume Trend Analysis By Market Taxonomy, 2019 to 2023

    14.4. Market Size (US$ million) and Volume Forecast By Market Taxonomy, 2024 to 2034

        14.4.1. By Country

            14.4.1.1. Brazil

            14.4.1.2. Chile

            14.4.1.3. Rest of Latin America

        14.4.2. By Throughput Rate

        14.4.3. By Load Capacity

        14.4.4. By End-use

    14.5. Market Attractiveness Analysis

        14.5.1. By Country

        14.5.2. By Throughput Rate

        14.5.3. By Load Capacity

        14.5.4. By End-use

    14.6. Market Trends

    14.7. Key Market Participants - Intensity Mapping

    14.8. Drivers and Restraints - Impact Analysis

15. East Asia Market Analysis 2019 to 2023 and Forecast 2024 to 2034

    15.1. Introduction

    15.2. Pricing Analysis

    15.3. Historical Market Size (US$ million) and Volume Trend Analysis By Market Taxonomy, 2019 to 2023

    15.4. Market Size (US$ million) and Volume Forecast By Market Taxonomy, 2024 to 2034

        15.4.1. By Country

            15.4.1.1. China

            15.4.1.2. Japan

            15.4.1.3. South Korea

        15.4.2. By Throughput Rate

        15.4.3. By Load Capacity

        15.4.4. By End-use

    15.5. Market Attractiveness Analysis

        15.5.1. By Country

        15.5.2. By Throughput Rate

        15.5.3. By Load Capacity

        15.5.4. By End-use

    15.6. Market Trends

    15.7. Key Market Participants - Intensity Mapping

    15.8. Drivers and Restraints - Impact Analysis

16. South Asia Pacific Market Analysis 2019 to 2023 and Forecast 2024 to 2034

    16.1. Introduction

    16.2. Pricing Analysis

    16.3. Historical Market Size (US$ million) and Volume Trend Analysis By Market Taxonomy, 2019 to 2023

    16.4. Market Size (US$ million) and Volume Forecast By Market Taxonomy, 2024 to 2034

        16.4.1. By Country

            16.4.1.1. India

            16.4.1.2. ASEAN

            16.4.1.3. Australia and New Zealand

            16.4.1.4. Rest of South Asia Pacific

        16.4.2. By Throughput Rate

        16.4.3. By Load Capacity

        16.4.4. By End-use

    16.5. Market Attractiveness Analysis

        16.5.1. By Country

        16.5.2. By Throughput Rate

        16.5.3. By Load Capacity

        16.5.4. By End-use

    16.6. Market Trends

    16.7. Key Market Participants - Intensity Mapping

    16.8. Drivers and Restraints - Impact Analysis

17. Western Europe Market Analysis 2019 to 2023 and Forecast 2024 to 2034

    17.1. Introduction

    17.2. Pricing Analysis

    17.3. Historical Market Size (US$ million) and Volume Trend Analysis By Market Taxonomy, 2019 to 2023

    17.4. Market Size (US$ million) and Volume Forecast By Market Taxonomy, 2024 to 2034

        17.4.1. By Country

            17.4.1.1. Germany

            17.4.1.2. Italy

            17.4.1.3. France

            17.4.1.4. United Kingdom

            17.4.1.5. Spain

            17.4.1.6. BENELUX

            17.4.1.7. NORDICS

            17.4.1.8. Rest of W. Europe

        17.4.2. By Throughput Rate

        17.4.3. By Load Capacity

        17.4.4. By End-use

    17.5. Market Attractiveness Analysis

        17.5.1. By Country

        17.5.2. By Throughput Rate

        17.5.3. By Load Capacity

        17.5.4. By End-use

    17.6. Market Trends

    17.7. Key Market Participants - Intensity Mapping

    17.8. Drivers and Restraints - Impact Analysis

18. Eastern Europe Market Analysis 2019 to 2023 and Forecast 2024 to 2034

    18.1. Introduction

    18.2. Pricing Analysis

    18.3. Historical Market Size (US$ million) and Volume Trend Analysis By Market Taxonomy, 2019 to 2023

    18.4. Market Size (US$ million) and Volume Forecast By Market Taxonomy, 2024 to 2034

        18.4.1. By Country

            18.4.1.1. Russia

            18.4.1.2. Poland

            18.4.1.3. Hungary

            18.4.1.4. Balkan and Baltics

            18.4.1.5. Rest of Eastern Europe

        18.4.2. By Throughput Rate

        18.4.3. By Load Capacity

        18.4.4. By End-use

    18.5. Market Attractiveness Analysis

        18.5.1. By Country

        18.5.2. By Throughput Rate

        18.5.3. By Load Capacity

        18.5.4. By End-use

    18.6. Market Trends

    18.7. Key Market Participants - Intensity Mapping

    18.8. Drivers and Restraints - Impact Analysis

19. Middle East and Africa Market Analysis 2019 to 2023 and Forecast 2024 to 2034

    19.1. Introduction

    19.2. Pricing Analysis

    19.3. Historical Market Size (US$ million) and Volume Trend Analysis By Market Taxonomy, 2019 to 2023

    19.4. Market Size (US$ million) and Volume Forecast By Market Taxonomy, 2024 to 2034

        19.4.1. By Country

            19.4.1.1. Kingdom of Saudi Arabia

            19.4.1.2. Other GCC Countries

            19.4.1.3. Türkiye

            19.4.1.4. South Africa

            19.4.1.5. Other African Union

            19.4.1.6. Rest of Middle East and Africa

        19.4.2. By Throughput Rate

        19.4.3. By Load Capacity

        19.4.4. By End-use

    19.5. Market Attractiveness Analysis

        19.5.1. By Country

        19.5.2. By Throughput Rate

        19.5.3. By Load Capacity

        19.5.4. By End-use

    19.6. Market Trends

    19.7. Key Market Participants - Intensity Mapping

    19.8. Drivers and Restraints - Impact Analysis

20. Country-wise Market Analysis

    20.1. Introduction

        20.1.1. Market Value Proportion Analysis, By Key Countries

        20.1.2. Global Vs. Country Growth Comparison

    20.2. United States Market Analysis

        20.2.1. By Throughput Rate

        20.2.2. By Load Capacity

        20.2.3. By End-use

    20.3. Canada Market Analysis

        20.3.1. By Throughput Rate

        20.3.2. By Load Capacity

        20.3.3. By End-use

    20.4. Mexico Market Analysis

        20.4.1. By Throughput Rate

        20.4.2. By Load Capacity

        20.4.3. By End-use

    20.5. Brazil Market Analysis

        20.5.1. By Throughput Rate

        20.5.2. By Load Capacity

        20.5.3. By End-use

    20.6. Chile Market Analysis

        20.6.1. By Throughput Rate

        20.6.2. By Load Capacity

        20.6.3. By End-use

    20.7. China Market Analysis

        20.7.1. By Throughput Rate

        20.7.2. By Load Capacity

        20.7.3. By End-use

    20.8. Japan Market Analysis

        20.8.1. By Throughput Rate

        20.8.2. By Load Capacity

        20.8.3. By End-use

    20.9. South Korea Market Analysis

        20.9.1. By Throughput Rate

        20.9.2. By Load Capacity

        20.9.3. By End-use

    20.10. India Market Analysis

        20.10.1. By Throughput Rate

        20.10.2. By Load Capacity

        20.10.3. By End-use

    20.11. ASEAN Market Analysis

        20.11.1. By Throughput Rate

        20.11.2. By Load Capacity

        20.11.3. By End-use

    20.12. Australia and New Zealand Market Analysis

        20.12.1. By Throughput Rate

        20.12.2. By Load Capacity

        20.12.3. By End-use

    20.13. Germany Market Analysis

        20.13.1. By Throughput Rate

        20.13.2. By Load Capacity

        20.13.3. By End-use

    20.14. Italy Market Analysis

        20.14.1. By Throughput Rate

        20.14.2. By Load Capacity

        20.14.3. By End-use

    20.15. France Market Analysis

        20.15.1. By Throughput Rate

        20.15.2. By Load Capacity

        20.15.3. By End-use

    20.16. United Kingdom Market Analysis

        20.16.1. By Throughput Rate

        20.16.2. By Load Capacity

        20.16.3. By End-use

    20.17. Spain Market Analysis

        20.17.1. By Throughput Rate

        20.17.2. By Load Capacity

        20.17.3. By End-use

    20.18. BENELUX Market Analysis

        20.18.1. By Throughput Rate

        20.18.2. By Load Capacity

        20.18.3. By End-use

    20.19. NORDICS Market Analysis

        20.19.1. By Throughput Rate

        20.19.2. By Load Capacity

        20.19.3. By End-use

    20.20. Russia Market Analysis

        20.20.1. By Throughput Rate

        20.20.2. By Load Capacity

        20.20.3. By End-use

    20.21. Poland Market Analysis

        20.21.1. By Throughput Rate

        20.21.2. By Load Capacity

        20.21.3. By End-use

    20.22. Hungary Market Analysis

        20.22.1. By Throughput Rate

        20.22.2. By Load Capacity

        20.22.3. By End-use

    20.23. Balkan & Baltics Market Analysis

        20.23.1. By Throughput Rate

        20.23.2. By Load Capacity

        20.23.3. By End-use

    20.24. Kingdom of Saudi Arabia Market Analysis

        20.24.1. By Throughput Rate

        20.24.2. By Load Capacity

        20.24.3. By End-use

    20.25. Other GCC Countries Market Analysis

        20.25.1. By Throughput Rate

        20.25.2. By Load Capacity

        20.25.3. By End-use

    20.26. Türkiye Market Analysis

        20.26.1. By Throughput Rate

        20.26.2. By Load Capacity

        20.26.3. By End-use

    20.27. South Africa Market Analysis

        20.27.1. By Throughput Rate

        20.27.2. By Load Capacity

        20.27.3. By End-use

    20.28. Other African Union Market Analysis

        20.28.1. By Throughput Rate

        20.28.2. By Load Capacity

        20.28.3. By End-use

21. Market Structure Analysis

    21.1. Market Analysis by Tier of Companies

    21.2. Market Concentration

    21.3. Market Share Analysis of Top Players

22. Competition Analysis

    22.1. Competition Dashboard

    22.2. Competition Benchmarking

    22.3. Competition Deep Dive

        22.3.1. Mettler-Toledo International Inc

            22.3.1.1. Overview

            22.3.1.2. Product Portfolio

            22.3.1.3. Profitability by Market Segments (Product/Channel/Region)

            22.3.1.4. Sales Footprint

            22.3.1.5. Strategy Overview

        22.3.2. Anritsu Corporation

        22.3.3. Thermo Fisher ScientificInc.

        22.3.4. Minebea Intec GmbH

        22.3.5. Teraoka Seiko Co.,Ltd.

        22.3.6. Bizerba SE&Co.KG

        22.3.7. Soc.Coop.Bilanciai Campogalliano

        22.3.8. WIPOTEC-OCS GmbH

        22.3.9. ANTARES VISIONS.p.A

        22.3.10. SF Engineering

        22.3.11. CASSEL Messtechnik GmbH

        22.3.12. Marel

        22.3.13. IshidaCo.,Ltd.

        22.3.14. Other Key Players

23. Assumptions and Acronyms Used

24. Research Methodology

List of Tables

Table 01: Global Market Size (US$ million) and Volume (Units) Analysis and Forecast By Throughput Rate, 2019 to 2034

Table 02: Global Market Size (US$ million) and Volume (Units) Analysis and Forecast By Load Capacity, 2019 to 2034

Table 03: Global Market Size Volume (Units) Analysis and Forecast By End-use, 2019 to 2034

Table 04: Global Market Size(US$ million) Analysis and Forecast By End-use, 2019 to 2034

Table 05: Global Market Size Volume (Units) Analysis and Forecast By Region, 2019 to 2034

Table 06: Global Market Size (US$ million) Analysis and Forecast By Region, 2019 to 2034

Table 07: North America Market Size (US$ million) and Volume (Units) Analysis and Forecast By Throughput Rate, 2019 to 2034

Table 08: North America Market Size (US$ million) and Volume (Units) Analysis and Forecast By Load Capacity, 2019 to 2034

Table 09: North America Market Size Volume (Units) Analysis and Forecast By End-use, 2019 to 2034

Table 10: North America Market Size(US$ million) Analysis and Forecast By End-use, 2019 to 2034

Table 11: Latin America Market Size (US$ million) and Volume (Units) Analysis and Forecast By Throughput Rate, 2019 to 2034

Table 12: Latin America Market Size (US$ million) and Volume (Units) Analysis and Forecast By Load Capacity, 2019 to 2034

Table 13: Latin America Market Size Volume (Units) Analysis and Forecast By End-use, 2019 to 2034

Table 14: Latin America Market Size(US$ million) Analysis and Forecast By End-use, 2019 to 2034

Table 15: East Asia Market Size (US$ million) and Volume (Units) Analysis and Forecast By Throughput Rate, 2019 to 2034

Table 16: East Asia Market Size (US$ million) and Volume (Units) Analysis and Forecast By Load Capacity, 2019 to 2034

Table 17: East Asia Market Size Volume (Units) Analysis and Forecast By End-use, 2019 to 2034

Table 18: East Asia Market Size(US$ million) Analysis and Forecast By End-use, 2019 to 2034

Table 19: South Asia Pacific Market Size (US$ million) and Volume (Units) Analysis and Forecast By Throughput Rate, 2019 to 2034

Table 20: South Asia Pacific Market Size (US$ million) and Volume (Units) Analysis and Forecast By Load Capacity, 2019 to 2034

Table 21: South Asia Pacific Market Size Volume (Units) Analysis and Forecast By End-use, 2019 to 2034

Table 22: South Asia Pacific Market Size(US$ million) Analysis and Forecast By End-use, 2019 to 2034

Table 23: Western Europe Market Size (US$ million) and Volume (Units) Analysis and Forecast By Throughput Rate, 2019 to 2034

Table 24: Western Europe Market Size (US$ million) and Volume (Units) Analysis and Forecast By Load Capacity, 2019 to 2034

Table 25: Western Europe Market Size Volume (Units) Analysis and Forecast By End-use, 2019 to 2034

Table 26: Western Europe Market Size(US$ million) Analysis and Forecast By End-use, 2019 to 2034

Table 27: Eastern Europe Market Size (US$ million) and Volume (Units) Analysis and Forecast By Throughput Rate, 2019 to 2034

Table 28: Eastern Europe Market Size (US$ million) and Volume (Units) Analysis and Forecast By Load Capacity, 2019 to 2034

Table 29: Eastern Europe Market Size Volume (Units) Analysis and Forecast By End-use, 2019 to 2034

Table 30: Eastern Europe Market Size(US$ million) Analysis and Forecast By End-use, 2019 to 2034

Table 31: Middle East and Africa Market Size (US$ million) and Volume (Units) Analysis and Forecast By Throughput Rate, 2019 to 2034

Table 32: Middle East and Africa Market Size (US$ million) and Volume (Units) Analysis and Forecast By Load Capacity, 2019 to 2034

Table 33: Middle East and Africa Market Size Volume (Units) Analysis and Forecast By End-use, 2019 to 2034

Table 34: Middle East and Africa Market Size(US$ million) Analysis and Forecast By End-use, 2019 to 2034

List of Charts

Figure 01: Global Market Historical Volume (Units), 2019 to 2023

Figure 02: Global Market Current and Forecast (Volume ), 2024 to 2034

Figure 03: Global Historical Market Size (US$ million) (2019 to 2034)

Figure 04: Global Value (US$ million) Forecast, 2024 to 2034

Figure 05: Global Absolute $ Opportunity, 2019 to 2024 and 2034

Figure 06: Global Market Share and BPS Analysis By Throughput Rate, 2024 to 2034

Figure 07: Global Market Y-o-Y Growth Projections By Throughput Rate, 2024 to 2034

Figure 08: Global Market Attractiveness Analysis By Throughput Rate, 2024 to 2034

Figure 09: Global Market Absolute $ Opportunity by Below 50ppm Segment, 2019 to 2034

Figure 10: Global Market Absolute $ Opportunity by 50 to 150ppm Segment, 2019 to 2034

Figure 11: Global Market Share and BPS Analysis By Load Capacity, 2024 to 2034

Figure 12: Global Market Y-o-Y Growth Projections By Load Capacity, 2024 to 2034

Figure 13: Global Market Attractiveness Analysis By Load Capacity, 2024 to 2034

Figure 14: Global Market Absolute $ Opportunity by Below 12kg Segment, 2019 to 2034

Figure 15: Global Market Absolute $ Opportunity by 13 to 60kg Segment, 2019 to 2034

Figure 16: Global Market Share and BPS Analysis By End-use, 2024 to 2034

Figure 17: Global Market Y-o-Y Growth Projections By End-use, 2024 to 2034

Figure 18: Global Market Attractiveness Analysis By End-use, 2024 to 2034

Figure 19: Global Market Absolute $ Opportunity by Food and Beverages Segment, 2019 to 2034

Figure 20: Global Market Absolute $ Opportunity by Pharmaceutical Use Segment, 2019 to 2034

Figure 21: Global Market Absolute $ Opportunity by Personal Care Products Segment, 2019 to 2034

Figure 22: Global Market Absolute $ Opportunity by Logistics and Packaging Segment, 2019 to 2034

Figure 23: Global Market Share and BPS Analysis By Region, 2024 to 2034

Figure 24: Global Market Y-o-Y Growth Projections By Region, 2024 to 2034

Figure 25: Global Market Attractiveness Analysis By Region, 2024 to 2034

Figure 26: Global Market Absolute $ Opportunity by North America Segment, 2019 to 2034

Figure 27: Global Market Absolute $ Opportunity by Latin America Segment, 2019 to 2034

Figure 28: Global Market Absolute $ Opportunity by East Asia Segment, 2019 to 2034

Figure 29: Global Market Absolute $ Opportunity by South Asia Pacific Segment, 2019 to 2034

Figure 30: Global Market Absolute $ Opportunity by Western Europe Segment, 2019 to 2034

Figure 31: Global Market Absolute $ Opportunity by Eastern Europe Segment, 2019 to 2034

Figure 32: Global Market Absolute $ Opportunity by Middle East and Africa Segment, 2019 to 2034

Figure 33: North America Market Share and BPS Analysis By Country, 2024 to 2034

Figure 34: North America Market Y-o-Y Growth Projections By Country, 2024 to 2034

Figure 35: North America Market Attractiveness Analysis By Country, 2024 to 2034

Figure 36: North America Market Share and BPS Analysis By Throughput Rate, 2024 to 2034

Figure 37: North America Market Y-o-Y Growth Projections By Throughput Rate, 2024 to 2034

Figure 38: North America Market Attractiveness Analysis By Throughput Rate, 2024 to 2034

Figure 39: North America Market Share and BPS Analysis By Load Capacity, 2024 to 2034

Figure 40: North America Market Y-o-Y Growth Projections By Load Capacity, 2024 to 2034

Figure 41: North America Market Attractiveness Analysis By Load Capacity, 2024 to 2034

Figure 42: North America Market Share and BPS Analysis By End-use, 2024 to 2034

Figure 43: North America Market Y-o-Y Growth Projections By End-use, 2024 to 2034

Figure 44: North America Market Attractiveness Analysis By End-use, 2024 to 2034

Figure 45: Latin America Market Share and BPS Analysis By Country, 2024 to 2034

Figure 46: Latin America Market Y-o-Y Growth Projections By Country, 2024 to 2034

Figure 47: Latin America Market Attractiveness Analysis By Country, 2024 to 2034

Figure 48: Latin America Market Share and BPS Analysis By Throughput Rate, 2024 to 2034

Figure 49: Latin America Market Y-o-Y Growth Projections By Throughput Rate, 2024 to 2034

Figure 50: Latin America Market Attractiveness Analysis By Throughput Rate, 2024 to 2034

Figure 51: Latin America Market Share and BPS Analysis By Load Capacity, 2024 to 2034

Figure 52: Latin America Market Y-o-Y Growth Projections By Load Capacity, 2024 to 2034

Figure 53: Latin America Market Attractiveness Analysis By Load Capacity, 2024 to 2034

Figure 54: Latin America Market Share and BPS Analysis By End-use, 2024 to 2034

Figure 55: Latin America Market Y-o-Y Growth Projections By End-use, 2024 to 2034

Figure 56: Latin America Market Attractiveness Analysis By End-use, 2024 to 2034

Figure 57: East Asia Market Share and BPS Analysis By Country, 2024 to 2034

Figure 58: East Asia Market Y-o-Y Growth Projections By Country, 2024 to 2034

Figure 59: East Asia Market Attractiveness Analysis By Country, 2024 to 2034

Figure 60: East Asia Market Share and BPS Analysis By Throughput Rate, 2024 to 2034

Figure 61: East Asia Market Y-o-Y Growth Projections By Throughput Rate, 2024 to 2034

Figure 62: East Asia Market Attractiveness Analysis By Throughput Rate, 2024 to 2034

Figure 63: East Asia Market Share and BPS Analysis By Load Capacity, 2024 to 2034

Figure 64: East Asia Market Y-o-Y Growth Projections By Load Capacity, 2024 to 2034

Figure 65: East Asia Market Attractiveness Analysis By Load Capacity, 2024 to 2034

Figure 66: East Asia Market Share and BPS Analysis By End-use, 2024 to 2034

Figure 67: East Asia Market Y-o-Y Growth Projections By End-use, 2024 to 2034

Figure 68: East Asia Market Attractiveness Analysis By End-use, 2024 to 2034

Figure 69: South Asia Pacific Market Share and BPS Analysis By Country, 2024 to 2034

Figure 70: South Asia Pacific Market Y-o-Y Growth Projections By Country, 2024 to 2034

Figure 71: South Asia Pacific Market Attractiveness Analysis By Country, 2024 to 2034

Figure 72: South Asia Pacific Market Share and BPS Analysis By Throughput Rate, 2024 to 2034

Figure 73: South Asia Pacific Market Y-o-Y Growth Projections By Throughput Rate, 2024 to 2034

Figure 74: South Asia Pacific Market Attractiveness Analysis By Throughput Rate, 2024 to 2034

Figure 75: South Asia Pacific Market Share and BPS Analysis By Load Capacity, 2024 to 2034

Figure 76: South Asia Pacific Market Y-o-Y Growth Projections By Load Capacity, 2024 to 2034

Figure 77: South Asia Pacific Market Attractiveness Analysis By Load Capacity, 2024 to 2034

Figure 78: South Asia Pacific Market Share and BPS Analysis By End-use, 2024 to 2034

Figure 79: South Asia Pacific Market Y-o-Y Growth Projections By End-use, 2024 to 2034

Figure 80: South Asia Pacific Market Attractiveness Analysis By End-use, 2024 to 2034

Figure 81: Western Europe Market Share and BPS Analysis By Country, 2024 to 2034

Figure 82: Western Europe Market Y-o-Y Growth Projections By Country, 2024 to 2034

Figure 83: Western Europe Market Attractiveness Analysis By Country, 2024 to 2034

Figure 84: Western Europe Market Share and BPS Analysis By Throughput Rate, 2024 to 2034

Figure 85: Western Europe Market Y-o-Y Growth Projections By Throughput Rate, 2024 to 2034

Figure 86: Western Europe Market Attractiveness Analysis By Throughput Rate, 2024 to 2034

Figure 87: Western Europe Market Share and BPS Analysis By Load Capacity, 2024 to 2034

Figure 88: Western Europe Market Y-o-Y Growth Projections By Load Capacity, 2024 to 2034

Figure 89: Western Europe Market Attractiveness Analysis By Load Capacity, 2024 to 2034

Figure 90: Western Europe Market Share and BPS Analysis By End-use, 2024 to 2034

Figure 91: Western Europe Market Y-o-Y Growth Projections By End-use, 2024 to 2034

Figure 92: Western Europe Market Attractiveness Analysis By End-use, 2024 to 2034

Figure 93: Eastern Europe Market Share and BPS Analysis By Country, 2024 to 2034

Figure 94: Eastern Europe Market Y-o-Y Growth Projections By Country, 2024 to 2034

Figure 95: Eastern Europe Market Attractiveness Analysis By Country, 2024 to 2034

Figure 96: Eastern Europe Market Share and BPS Analysis By Throughput Rate, 2024 to 2034

Figure 97: Eastern Europe Market Y-o-Y Growth Projections By Throughput Rate, 2024 to 2034

Figure 98: Eastern Europe Market Attractiveness Analysis By Throughput Rate, 2024 to 2034

Figure 99: Eastern Europe Market Share and BPS Analysis By Load Capacity, 2024 to 2034

Figure 100: Eastern Europe Market Y-o-Y Growth Projections By Load Capacity, 2024 to 2034

Figure 101: Eastern Europe Market Attractiveness Analysis By Load Capacity, 2024 to 2034

Figure 102: Eastern Europe Market Share and BPS Analysis By End-use, 2024 to 2034

Figure 103: Eastern Europe Market Y-o-Y Growth Projections By End-use, 2024 to 2034

Figure 104: Eastern Europe Market Attractiveness Analysis By End-use, 2024 to 2034

Figure 105: Middle East and Africa Market Share and BPS Analysis By Country, 2024 to 2034

Figure 106: Middle East and Africa Market Y-o-Y Growth Projections By Country, 2024 to 2034

Figure 107: Middle East and Africa Market Attractiveness Analysis By Country, 2024 to 2034

Figure 108: Middle East and Africa Market Share and BPS Analysis By Throughput Rate, 2024 to 2034

Figure 109: Middle East and Africa Market Y-o-Y Growth Projections By Throughput Rate, 2024 to 2034

Figure 110: Middle East and Africa Market Attractiveness Analysis By Throughput Rate, 2024 to 2034

Figure 111: Middle East and Africa Market Share and BPS Analysis By Load Capacity, 2024 to 2034

Figure 112: Middle East and Africa Market Y-o-Y Growth Projections By Load Capacity, 2024 to 2034

Figure 113: Middle East and Africa Market Attractiveness Analysis By Load Capacity, 2024 to 2034

Figure 114: Middle East and Africa Market Share and BPS Analysis By End-use, 2024 to 2034

Figure 115: Middle East and Africa Market Y-o-Y Growth Projections By End-use, 2024 to 2034

Figure 116: Middle East and Africa Market Attractiveness Analysis By End-use, 2024 to 2034

Recommendations

Industrial Automation

Glass Reactor Market

Published : January 2024

Industrial Automation

Fall Protection Market

Published : January 2024

Industrial Automation

Industrial Weighing Equipment Market

Published : January 2024

Industrial Automation

Paper And Plastic Film Capacitors Market

Published : September 2023

Explore Industrial Automation Insights

View Reports

Check Weighing Equipment Market