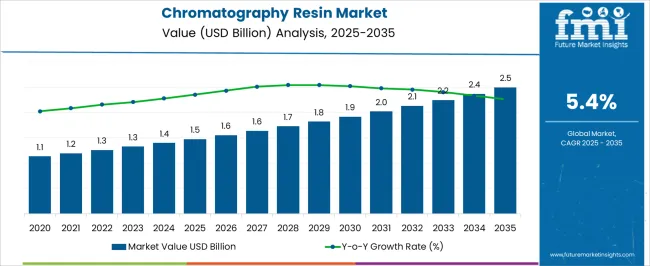
The Chromatography Resin Market is estimated to be valued at USD 1.5 billion in 2025 and is projected to reach USD 2.5 billion by 2035, registering a compound annual growth rate (CAGR) of 5.4% over the forecast period.
The Chromatography Resin market is experiencing robust growth, driven by the increasing demand for high-purity biomolecules and efficient separation processes across the biopharmaceutical and life sciences sectors. Rising adoption of protein purification, antibody production, and vaccine manufacturing is contributing to the expanding need for advanced resin technologies. Continuous innovations in resin chemistry, surface functionalization, and binding specificity are enhancing separation efficiency, process yield, and operational scalability.
The integration of affinity and ion-exchange chromatography methods has further strengthened application versatility. Growing investments in research and development, coupled with regulatory emphasis on product quality and consistency, are accelerating market adoption. Manufacturers are increasingly focusing on customizable resin solutions to meet diverse purification requirements, ensuring compatibility with automated and continuous processing systems.
As biopharmaceutical production scales up globally and downstream processing demands become more complex, the Chromatography Resin market is expected to sustain growth Increasing emphasis on cost-effective production, reduced cycle times, and high recovery rates is shaping the adoption of innovative resin solutions, positioning the market for long-term expansion.
| Metric | Value |
|---|---|
| Chromatography Resin Market Estimated Value in (2025 E) | USD 1.5 billion |
| Chromatography Resin Market Forecast Value in (2035 F) | USD 2.5 billion |
| Forecast CAGR (2025 to 2035) | 5.4% |
The market is segmented by Product Type, Technology Type, and End User Type and region. By Product Type, the market is divided into Synthetic and Native. In terms of Technology Type, the market is classified into Affinity Chromatography, Anion Exchange Chromatography, Cation Exchange Chromatography, Size Exclusion, and Hydrophobic Interaction. Based on End User Type, the market is segmented into Biopharmaceutical Companies, Clinical Research Organizations, and Academic Institutes. Regionally, the market is classified into North America, Latin America, Western Europe, Eastern Europe, Balkan & Baltic Countries, Russia & Belarus, Central Asia, East Asia, South Asia & Pacific, and the Middle East & Africa.
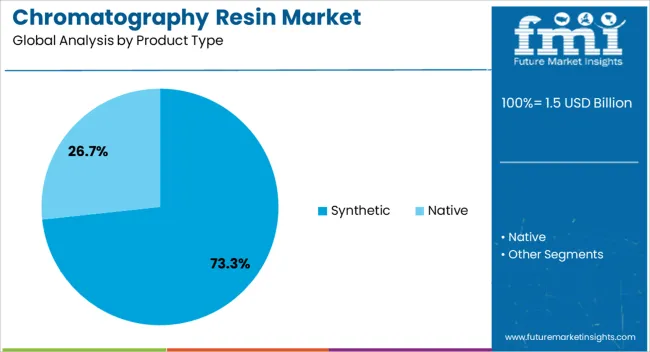
The synthetic product type segment is projected to hold 73.3% of the market revenue in 2025, establishing it as the leading product type. Its dominance is driven by superior chemical stability, consistent performance, and high reproducibility, which are critical for biopharmaceutical and research applications. Synthetic resins enable precise control over binding capacities, selectivity, and elution profiles, enhancing purification efficiency and product quality.
The ability to withstand harsh operating conditions, repeated cleaning cycles, and long-term storage contributes to reliability and operational cost savings. Continuous improvements in resin chemistry, including tailored surface functionalities and improved mechanical strength, have strengthened adoption across diverse chromatography platforms. Organizations are increasingly leveraging synthetic resins to optimize downstream processing and meet stringent regulatory standards.
The scalability and adaptability of synthetic resins for both large-scale manufacturing and research applications further reinforce market leadership As demand for high-purity biomolecules rises and process efficiency becomes a priority, the synthetic product type segment is expected to maintain its dominant position, supported by ongoing technological advancements and operational advantages.
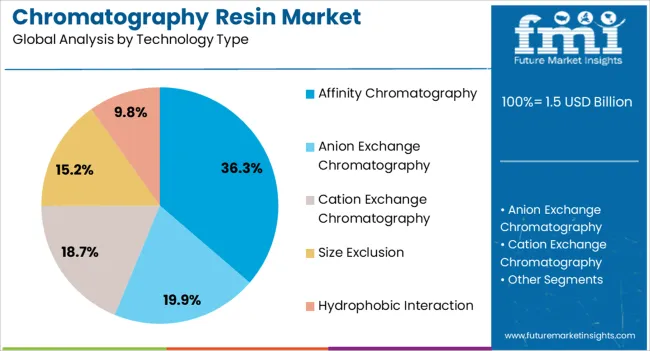
The affinity chromatography segment is anticipated to account for 36.3% of the market revenue in 2025, making it the leading technology type. Its growth is being driven by its high specificity and efficiency in isolating target biomolecules such as proteins, antibodies, and enzymes. Affinity chromatography enables selective binding and elution, which improves yield, purity, and process reproducibility.
The technology is widely adopted in biopharmaceutical production and research settings due to its compatibility with advanced resin chemistries and automated processing systems. Advancements in ligand development, immobilization techniques, and surface modification have enhanced performance and operational reliability. Integration with continuous processing and high-throughput purification workflows further accelerates adoption.
Regulatory focus on product quality, reproducibility, and process validation reinforces the importance of affinity chromatography in critical applications As demand for biologics, vaccines, and therapeutic proteins grows globally, affinity chromatography is expected to remain the primary technology driving the Chromatography Resin market, supported by innovations in resin design and process efficiency.
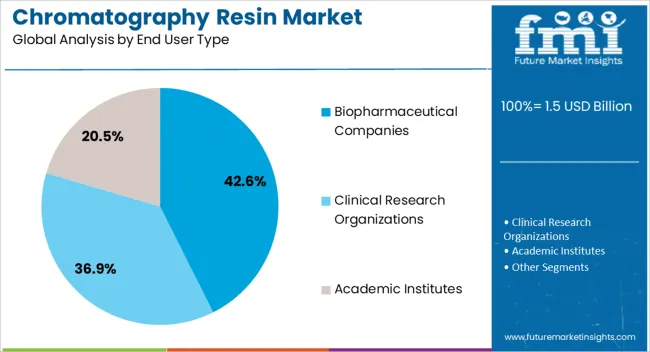
The biopharmaceutical companies segment is projected to hold 42.6% of the market revenue in 2025, establishing it as the leading end-user type. Growth in this segment is driven by the expanding global production of therapeutic proteins, monoclonal antibodies, and vaccines. High demand for consistent, high-quality purification processes has made chromatography resins essential in large-scale biopharmaceutical manufacturing.
Companies are increasingly adopting advanced resin technologies and automated systems to improve process efficiency, reduce downtime, and ensure regulatory compliance. Focus on reducing production costs while maintaining high yield and purity further supports adoption. Collaborative initiatives with resin manufacturers for custom solutions tailored to specific biologics have strengthened market engagement.
The ongoing shift toward continuous processing and high-throughput purification has reinforced the reliance of biopharmaceutical companies on high-performance resins As the global biologics market continues to grow and production demands become more complex, biopharmaceutical companies are expected to remain the primary end-users, driving the market through increased adoption of innovative chromatography resin technologies.
The scope for chromatography resin rose at a 7.7% CAGR between 2020 and 2025. The global market is achieving heights to grow at a moderate CAGR of 5.4% over the forecast period 2025 to 2035.
Pharmaceutical, biotechnology industries being the major players in chromatography, utilize chromatography resins for purification as well as separation processes in development and manufacture of drugs. The utilization accelerated the market growth during the historical period.
Chromatography techniques are essential in ensuring food and beverage safety and quality, which had stimulated the demand for chromatography resins in this sector. Chromatography resins are themselves a result of rapid advancement in the technology and this is one of the reasons that propelled the market growth.
The pharmaceutical and biotechnology industries will forecast remarkable growth in the near future, attributed to aging populations, increase in incidences of chronic diseases as well as advances in technology.
The development of novel therapies, including gene therapies, cell based therapies, and personalized medicine, will drive the demand for chromatography resins tailored for the purification and analysis of complex biomolecules. Integration of chromatography with other analytical techniques, such as mass spectrometry and spectroscopy, will continue to expand, fueling demand for compatible chromatography resins and systems.
The below table showcases revenues in terms of the top 5 leading countries, spearheaded by India and Thailand. The countries will lead the market through 2035.
| Countries | Forecast CAGRs from 2025 to 2035 |
|---|---|
| The United States | 2.1% |
| The United Kingdom | 3.6% |
| Germany | 3.9% |
| Thailand | 5.8% |
| India | 7.6% |
The chromatography resin market in the United States will expand at a CAGR of 2.1% through 2035. The country is a hub for technological advancements and innovation in chromatography techniques, resin manufacturing, and chromatography system development.
Ongoing research and development efforts focus on improving resin performance, enhancing chromatography system efficiency, as well as developing novel chromatography applications, augmenting the market growth.
The country is home to a robust biopharmaceutical industry, with numerous biotechnology companies, pharmaceutical manufacturers, and research institutions. The increasing investment in biopharmaceutical research and development, coupled with the increasing demand for biologics and biosimilars, is stimulating the demand for chromatography resins.
The chromatography resin market in the United Kingdom to expand at a CAGR of 3.6% through 2035. The pharmaceutical and biotechnology industries in the country are subject to stringent regulatory standards enforced by agencies.
Chromatography techniques and resins are essential for meeting regulatory requirements for drug quality, safety, and efficacy, thus propelling the market growth. The United Kingdom has a well-established pharmaceutical and biotechnology industry, with numerous research institutions, pharmaceutical companies, and biotech start-ups.
The increasing investment in drug discovery, development, and manufacturing activities is increasing the demand for chromatography resins used in purification, separation, and analysis of pharmaceutical compounds and biomolecules.
Chromatography resin trends in Germany are taking a turn for the better. A 3.9% CAGR is forecast for the country from 2025 to 2035. There is a growing demand for personalized medicine and targeted therapies in Germany, driven by advancements in genomics, proteomics, and precision medicine.
Chromatography resins enable the purification and separation of biomolecules for personalized medicine applications, contributing to market growth. The strategic location of Germany in Europe positions it as a key hub for pharmaceutical and biotechnology companies, research institutions, and academic centers.
The central location of the country facilitates easy access to European markets and fosters collaborations, trade partnerships, and investments, fueling the demand for chromatography resins.
The chromatography resin market in Thailand is poised to expand at a CAGR of 5.8% through 2035. Food and beverage industry in Thailand is experiencing growth due to changing consumer preferences, urbanization, and tourism.
Chromatography techniques and resins are used for quality control testing, flavor analysis, and contaminant detection in the food and beverage industry, propelling market growth. Academic and research institutions in Thailand are actively engaged in scientific research and development across various disciplines, including chemistry, biochemistry, and biotechnology.
Chromatography techniques and resins are widely used in research laboratories for analytical testing, protein purification, and sample preparation, contributing to market prospects.
The chromatography resin market in India will expand at a CAGR of 7.6% through 2035. India has a rich tradition of herbal medicine and Ayurveda, and there is a growing demand for nutraceuticals and herbal supplements globally.
Chromatography techniques are used for quality control and standardization of herbal products, accelerating the demand for chromatography resins in the nutraceutical and herbal medicine industry.
India has stringent environmental regulations governing air, water, and soil quality to protect public health and the environment. Chromatography techniques, such as gas chromatography and liquid chromatography, are essential for environmental testing and pollutant analysis, stimulating the demand for chromatography resins.
The below table highlights how synthetic segment is leading the market in terms of product type, and will account for a share of 73.3% in 2025.
Based on technology type, the affinity chromatography segment is gaining heights and will to account for a share of 36.3% in 2025.
| Category | Shares in 2025 |
|---|---|
| Synthetic | 73.3% |
| Affinity Chromatography | 36.3% |
Based on product type, the synthetic segment will dominate the chromatography resin market. Synthetic chromatography resins offer greater control over material properties, enabling manufacturers to tailor resins with specific pore sizes, surface chemistries, and particle sizes to meet diverse application requirements.
The customizability ensures consistent performance and reproducibility, driving their adoption in various chromatography processes. Synthetic chromatography resins find applications across a broad spectrum of industries, including pharmaceuticals, biotechnology, food and beverages, environmental testing, and research laboratories.
Their versatility allows for purification, separation, and analysis of various biomolecules, proteins, nucleic acids, and small molecules, driving their demand in diverse applications.
In terms of technology, the affinity chromatography segment will dominate the chromatography resin market. Affinity chromatography finds widespread applications in various fields, including pharmaceuticals, biotechnology, healthcare, and research.
It is used for protein purification, antibody isolation, enzyme purification, drug-target interactions, and biomolecular interactions studies, fueling demand for affinity chromatography resins across diverse industries.
Affinity chromatography offers high specificity in capturing target molecules based on reversible interactions between the target molecule and a ligand immobilized on the chromatography resin. The specificity enables efficient purification of biomolecules, such as proteins, antibodies, enzymes, and nucleic acids, from complex biological mixtures.
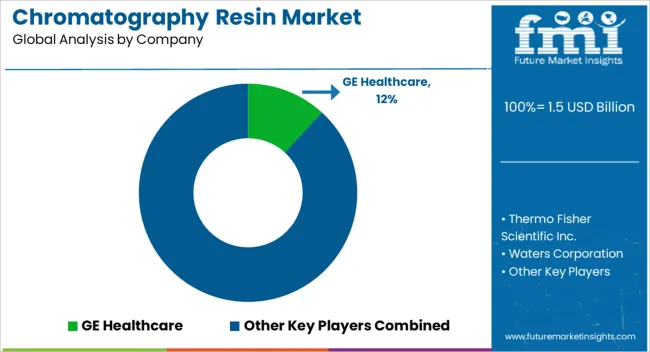
The chromatography resin market is characterized by intense competition among key players striving to maintain or enhance their market share through strategic initiatives, product innovation, and differentiation strategies.
Company Portfolio
| Attribute | Details |
|---|---|
| Estimated Market Size in 2025 | USD 1.5 billion |
| Projected Market Valuation in 2035 | USD 2.5 billion |
| Value-based CAGR 2025 to 2035 | 5.4% |
| Forecast Period | 2025 to 2035 |
| Historical Data Available for | 2020 to 2025 |
| Market Analysis | Value in USD Billion |
| Key Regions Covered | North America; Latin America; Western Europe; Eastern Europe; South Asia and Pacific; East Asia; The Middle East & Africa |
| Key Market Segments Covered | Product Type, Technology Type, End User Type, Region |
| Key Countries Profiled | The United States, Canada, Brazil, Mexico, Germany, France, France, Spain, Italy, Russia, Poland, Czech Republic, Romania, India, Bangladesh, Australia, New Zealand, China, Japan, South Korea, GCC countries, South Africa, Israel |
| Key Companies Profiled | Agilent Technologies; Bio-Rad Laboratories; GE Healthcare; Waters Corporation; Expedeon Ltd; Thermo Fisher Scientific Inc.; Pall Corporation; Merck KGaA; Perkin Elmer Inc.; Kaneka Corporation; Shimadzu Corporation; Knauer GmbH; Tosoh Bioscience; Avantor Performance Materials Inc.; Mitsubishi Chemical Corporation; W.R. Grace & Co.; JSR Micro Inc.; Life Technology Corporation |
The global chromatography resin market is estimated to be valued at USD 1.5 billion in 2025.
The market size for the chromatography resin market is projected to reach USD 2.5 billion by 2035.
The chromatography resin market is expected to grow at a 5.4% CAGR between 2025 and 2035.
The key product types in chromatography resin market are synthetic and native.
In terms of technology type, affinity chromatography segment to command 36.3% share in the chromatography resin market in 2025.


Full Research Suite comprises of:
Market outlook & trends analysis
Interviews & case studies
Strategic recommendations
Vendor profiles & capabilities analysis
5-year forecasts
8 regions and 60+ country-level data splits
Market segment data splits
12 months of continuous data updates
DELIVERED AS:
PDF EXCEL ONLINE
Chromatography Silica Resins Market
Hydrophobic Interaction Chromatography Resins Market
Chromatography Instrumentation Market Size and Share Forecast Outlook 2025 to 2035
Chromatography Software Market Insights – Trends & Forecast 2025 to 2035
Chromatography Accessories & Consumables Market Growth – Trends & Forecast 2025 to 2035
Chromatography Reagent Market Growth – Trends & Forecast 2024-2034
DNA Chromatography Chips Market Size and Share Forecast Outlook 2025 to 2035
Gas Chromatography Systems Market Size and Share Forecast Outlook 2025 to 2035
Gas Chromatography Columns Market
Gas Chromatography Detector Market
Immunochromatography Kits Market Size and Share Forecast Outlook 2025 to 2035
Liquid Chromatography Systems Market Size and Share Forecast Outlook 2025 to 2035
Portable Chromatography Systems Market Size and Share Forecast Outlook 2025 to 2035
Multimodal Chromatography Columns Market
Preparative Chromatography Market Size and Share Forecast Outlook 2025 to 2035
Supercritical Fluid Chromatography Market
Preparative and Process Chromatography Market Forecast and Outlook 2025 to 2035
Binary High Pressure Gradient Liquid Chromatography System Market Size and Share Forecast Outlook 2025 to 2035
Resin Capsule Market Forecast and Outlook 2025 to 2035
Resin Cement for Luting Market Size and Share Forecast Outlook 2025 to 2035

Thank you!
You will receive an email from our Business Development Manager. Please be sure to check your SPAM/JUNK folder too.
Chat With
MaRIA