Cluster Packaging Market Size and Share Forecast Outlook 2025 to 2035

The Cluster Packaging Market is estimated to be valued at USD 6.6 billion in 2025 and is projected to reach USD 10.8 billion by 2035, registering a compound annual growth rate (CAGR) of 5.0% over the forecast period.
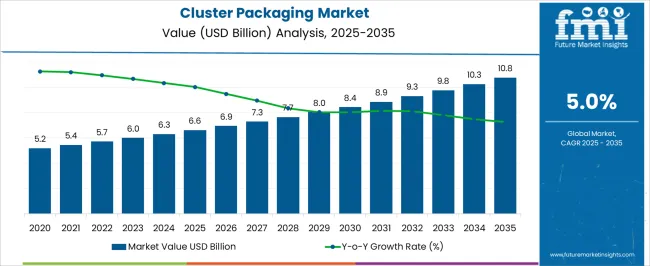
Quick Stats for Cluster Packaging Market

  • Cluster Packaging Market Value (2025): USD 6.6 billion
  • Cluster Packaging Market Forecast Value (2035): USD 10.8 billion
  • Cluster Packaging Market Forecast CAGR: 5.0%
  • Leading Segment in Cluster Packaging Market in 2025: Paper & Paperboard (36.2%)
  • Key Growth Regions in Cluster Packaging Market: North America, Asia-Pacific, Europe
  • Top Key Players in Cluster Packaging Market: Amkor Technology, Inc., ASE Group, Intel Corporation, Samsung Electronics Co., Ltd., TSMC (Taiwan Semiconductor Manufacturing Company), Texas Instruments Incorporated, STMicroelectronics N.V., Broadcom Inc., Qualcomm Incorporated, NXP Semiconductors N.V., Infineon Technologies AG, Renesas Electronics Corporation, Micron Technology, Inc., SK Hynix Inc.
Cluster Packaging Market Market Value Analysis

Cluster Packaging Market Key Takeaways

Metric Value
Cluster Packaging Market Estimated Value in (2025 E) USD 6.6 billion
Cluster Packaging Market Forecast Value in (2035 F) USD 10.8 billion
Forecast CAGR (2025 to 2035) 5.0%

Why is the Cluster Packaging Market Growing?

The Cluster Packaging market is witnessing steady growth due to its increasing adoption across food and beverage, consumer goods, and industrial sectors. Rising demand for sustainable and lightweight packaging solutions is driving manufacturers to prioritize eco-friendly materials and cost-efficient formats. Cluster packaging offers superior handling, storage, and transportation benefits, which makes it a preferred choice among producers and retailers.

Increasing consumption of packaged beverages, ready-to-eat meals, and consumer convenience products is accelerating the use of this format. Sustainability concerns are encouraging the use of recyclable and biodegradable materials, particularly paper-based options, while manufacturers are integrating digital printing and automation technologies to improve design and efficiency. The demand for multipack formats is also expanding as retail chains and e-commerce platforms push for bulk sales and consumer value packs.

Additionally, strict environmental regulations and corporate commitments toward reducing plastic waste are further propelling innovation in cluster packaging solutions As industries focus on cost optimization and brand differentiation, the market is positioned for long-term expansion supported by evolving consumer preferences and regulatory frameworks.

Segmental Analysis

The cluster packaging market is segmented by material type, paper & paperboard, product type, packaging style, number of tiers, end-use, and geographic regions. By material type, cluster packaging market is divided into Paper & Paperboard, Plastic, and Others. In terms of paper & paperboard, cluster packaging market is classified into Corrugated Paper, Kraft Paper, Poly Coated Paper, Folding Box Board, and Others. Based on product type, cluster packaging market is segmented into Bottles & Jars, Cans, Containers, Boxes, Cups, and Others. By packaging style, cluster packaging market is segmented into Neck-Through Style, Over The Top Style, Handle Based Style, Cluster Sleeve Style, Cluster Side Style, and Others. By number of tiers, cluster packaging market is segmented into Single Tier Cluster Packaging and Multiple Tier Cluster Packaging. By end-use, cluster packaging market is segmented into Food, Beverages, Pharmaceuticals & Healthcare, Personal Care & Cosmetics, Industrial Goods, and Others. Regionally, the cluster packaging industry is classified into North America, Latin America, Western Europe, Eastern Europe, Balkan & Baltic Countries, Russia & Belarus, Central Asia, East Asia, South Asia & Pacific, and the Middle East & Africa.
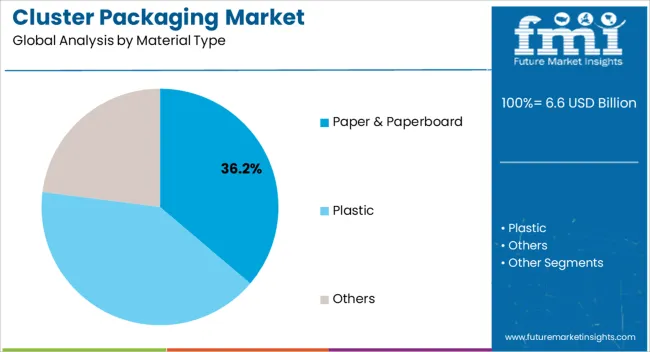
Insights into the Paper and Paperboard Material Type Segment

Cluster Packaging Market Analysis By Material Type

The paper and paperboard material type segment is projected to account for 36.2% of the Cluster Packaging market revenue in 2025, positioning it as the leading material category. Growth is being supported by the increasing global shift toward recyclable and biodegradable packaging options that align with sustainability goals. Paper and paperboard materials provide cost-effectiveness, lightweight handling, and versatility, making them highly suitable for multipack formats.

Their ease of printing also supports brand visibility through attractive designs and marketing messages. Consumer awareness regarding the environmental impact of plastic packaging is driving demand for renewable paper-based solutions. Food and beverage companies are increasingly adopting these materials to meet both consumer expectations and regulatory compliance requirements.

The ability of paperboard to maintain structural integrity while offering flexibility in design is further supporting adoption across a wide range of applications As sustainability becomes a key purchase driver, paper and paperboard are expected to continue leading the material type category in the Cluster Packaging market.
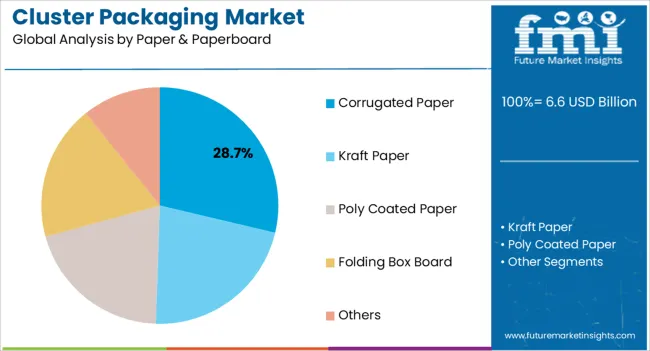
Insights into the Corrugated Paper Product Type Segment

Cluster Packaging Market Analysis By Paper & Paperboard

The corrugated paper product type segment is expected to capture 28.7% of the Cluster Packaging market share in 2025, emerging as the largest product type. This dominance is driven by the strength, durability, and lightweight properties of corrugated paper, which make it ideal for protecting goods during transportation and storage. Corrugated formats are widely used across food, beverage, and consumer goods industries, offering cost-effective multipack solutions.

The rising e-commerce sector is further fueling demand, as corrugated paper provides excellent stacking and load-bearing capabilities while remaining recyclable and eco-friendly. Manufacturers are leveraging advanced printing technologies to enhance the aesthetic appeal of corrugated packaging, adding value to brand marketing strategies.

The versatility of corrugated formats enables adaptation across bottles, jars, cans, and cartons, making it highly flexible for diverse packaging needs As sustainability initiatives gain momentum and companies seek durable yet environmentally responsible packaging solutions, corrugated paper is set to maintain its strong presence in the market, supported by broad adoption across industries.
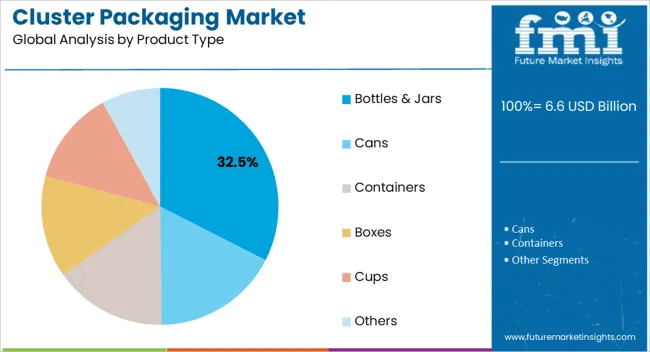
Insights into the Bottles and Jars Product Type Segment

Cluster Packaging Market Analysis By Product Type

The bottles and jars product type segment is projected to hold 32.5% of the Cluster Packaging market revenue in 2025, making it the leading application format. This leadership is being driven by the rising consumption of beverages, sauces, dairy products, and personal care items that are typically packaged in bottles and jars. Cluster packaging for bottles and jars provides superior convenience in transportation, retail display, and consumer handling, making it an essential solution for manufacturers.

The format also offers strong marketing advantages, as cluster packs allow for easy multipack promotions and value offerings. Sustainability considerations are further influencing design innovations, with recyclable paperboard and lightweight materials increasingly used in cluster packs for bottles and jars.

The growing expansion of e-commerce and retail distribution channels is also fueling demand, as multipacks simplify logistics and reduce costs As beverage and personal care consumption continues to rise globally, bottles and jars remain the most significant end-use product type within cluster packaging, ensuring their leadership position in the market.

Market Overview

Cluster Packaging Market Outlook (2025-2035)

Packaging plays a crucial role in maintaining the safety of products. The development of end user sectors such as FMGC, electronic, health supplements and personal care products is driving the demand for unique packaging that helps in keeping the product safe.

Moreover, the launch of chemically-induced products along with organic products is driving the demand for cluster packaging. The chances of the product getting damaged are high. This, in turn, has increased the demand for safe and reliable packaging of products.

The growth of cluster packaging market can be attributed to the safety it provides along with the convenience it offers consumers for carrying products. Cluster packaging products such as cans, jars, containers, cups and boxes ensure that the product does not spill or be harmed by external factors.

This had led to the wide adoption of cluster packaging for various products. Furthermore, cluster packaging manufacturers are maximizing sales opportunities owing to the sustainable nature of certain cluster packaging products.

Future Market Insights states that the convenience of carrying products in bulk is favoring the growth of cluster packaging. Most consumers are investing in products that are packaged in larger quantities. This, in turn, reduces the number of times they have to buy the same product and helps in storing goods for a longer duration.

The material used for cluster packaging such as kraft paper, poly coated paper or folding box is another reliant factor of cluster packaging accelerating the growth of the market.

The advantages associated with cluster packaging are positively influencing the growth of the market.

  • Cluster packaging significantly saves material costs
  • Better convenience – Products can be recycled and reused multiple times
  • Cluster packaging is environmentally friendly.

In the upcoming years, the role of packaging products will become essential as consumers are becoming more aware of the impact their choices have on the planet. Moreover, cluster packaging not only promises but also delivers on saving material and packaging products in bulk, making it a desirable and dependable option.

Cost-effective packaging along with flexible packaging is a sustainable trend in the packaging industry. This has led to manufacturers reinventing the current style of packaging and changing the same to cater to the need of end user industries.

From liquid products to ointments and creams, the nature of packaging varies for every end user industry. But, with the cluster packaging industry undergoing drastic changes, the dependency on the same is expected to increase in the future.
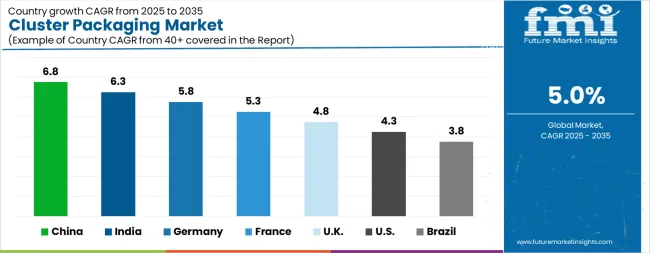
Analysis of Cluster Packaging Market By Key Countries

Cluster Packaging Market Cagr Analysis By Country
Country CAGR
China 6.8%
India 6.3%
Germany 5.8%
France 5.3%
UK 4.8%
USA 4.3%
Brazil 3.8%

Country-wise Analysis

The Cluster Packaging Market is expected to register a CAGR of 5.0% during the forecast period, exhibiting varied country level momentum. China leads with the highest CAGR of 6.8%, followed by India at 6.3%. Developed markets such as Germany, France, and the UK continue to expand steadily, while the USA is likely to grow at consistent rates. Brazil posts the lowest CAGR at 3.8%, yet still underscores a broadly positive trajectory for the global Cluster Packaging Market. In 2024, Germany held a dominant revenue in the Western Europe market and is expected to grow with a CAGR of 5.8%. The USA Cluster Packaging Market is estimated to be valued at USD 2.5 billion in 2025 and is anticipated to reach a valuation of USD 3.7 billion by 2035. Sales are projected to rise at a CAGR of 4.3% over the forecast period between 2025 and 2035. While Japan and South Korea markets are estimated to be valued at USD 348.7 million and USD 215.0 million respectively in 2025.
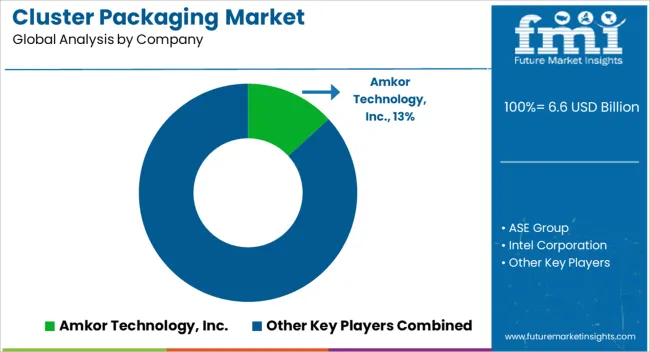
Key Players in the Cluster Packaging Market

Cluster Packaging Market Analysis By Company

  • Amkor Technology, Inc.
  • ASE Group
  • Intel Corporation
  • Samsung Electronics Co., Ltd.
  • TSMC (Taiwan Semiconductor Manufacturing Company)
  • Texas Instruments Incorporated
  • STMicroelectronics N.V.
  • Broadcom Inc.
  • Qualcomm Incorporated
  • NXP Semiconductors N.V.
  • Infineon Technologies AG
  • Renesas Electronics Corporation
  • Micron Technology, Inc.
  • SK Hynix Inc.

Scope of the Report

Item Value
Quantitative Units USD 6.6 Billion
Material Type Paper & Paperboard, Plastic, and Others
Paper & Paperboard Corrugated Paper, Kraft Paper, Poly Coated Paper, Folding Box Board, and Others
Product Type Bottles & Jars, Cans, Containers, Boxes, Cups, and Others
Packaging Style Neck-Through Style, Over The Top Style, Handle Based Style, Cluster Sleeve Style, Cluster Side Style, and Others
Number Of Tiers Single Tier Cluster Packaging and Multiple Tier Cluster Packaging
End-Use Food, Beverages, Pharmaceuticals & Healthcare, Personal Care & Cosmetics, Industrial Goods, and Others
Regions Covered North America, Europe, Asia-Pacific, Latin America, Middle East & Africa
Country Covered United States, Canada, Germany, France, United Kingdom, China, Japan, India, Brazil, South Africa
Key Companies Profiled Amkor Technology, Inc., ASE Group, Intel Corporation, Samsung Electronics Co., Ltd., TSMC (Taiwan Semiconductor Manufacturing Company), Texas Instruments Incorporated, STMicroelectronics N.V., Broadcom Inc., Qualcomm Incorporated, NXP Semiconductors N.V., Infineon Technologies AG, Renesas Electronics Corporation, Micron Technology, Inc., and SK Hynix Inc.

Cluster Packaging Market by Segments

Material Type:

  • Paper & Paperboard
  • Plastic
  • Others

Paper & Paperboard:

  • Corrugated Paper
  • Kraft Paper
  • Poly Coated Paper
  • Folding Box Board
  • Others

Product Type:

  • Bottles & Jars
  • Cans
  • Containers
  • Boxes
  • Cups
  • Others

Packaging Style:

  • Neck-Through Style
  • Over The Top Style
  • Handle Based Style
  • Cluster Sleeve Style
  • Cluster Side Style
  • Others

Number Of Tiers:

  • Single Tier Cluster Packaging
  • Multiple Tier Cluster Packaging

Region:

  • North America
    • USA
    • Canada
    • Mexico
  • Latin America
    • Brazil
    • Chile
    • Rest of Latin America
  • Western Europe
    • Germany
    • UK
    • Italy
    • Spain
    • France
    • Nordic
    • BENELUX
    • Rest of Western Europe
  • Eastern Europe
    • Russia
    • Poland
    • Hungary
    • Balkan & Baltic
    • Rest of Eastern Europe
  • East Asia
    • China
    • Japan
    • South Korea
  • South Asia and Pacific
    • India
    • ASEAN
    • Australia & New Zealand
    • Rest of South Asia and Pacific
  • Middle East & Africa
    • Kingdom of Saudi Arabia
    • Other GCC Countries
    • Turkiye
    • South Africa
    • Other African Union
    • Rest of Middle East & Africa

Table of Content

  1. Executive Summary
    • Global Market Outlook
    • Demand-side Trends
    • Supply-side Trends
    • Technology Roadmap Analysis
    • Analysis and Recommendations
  2. Market Overview
    • Market Coverage / Taxonomy
    • Market Definition / Scope / Limitations
  3. Market Background
    • Market Dynamics
      • Drivers
      • Restraints
      • Opportunity
      • Trends
    • Scenario Forecast
      • Demand in Optimistic Scenario
      • Demand in Likely Scenario
      • Demand in Conservative Scenario
    • Opportunity Map Analysis
    • Product Life Cycle Analysis
    • Supply Chain Analysis
    • Investment Feasibility Matrix
    • Value Chain Analysis
    • PESTLE and Porter’s Analysis
    • Regulatory Landscape
    • Regional Parent Market Outlook
    • Production and Consumption Statistics
    • Import and Export Statistics
  4. Global Market Analysis 2020 to 2024 and Forecast, 2025 to 2035
    • Historical Market Size Value (USD Million) Analysis, 2020 to 2024
    • Current and Future Market Size Value (USD Million) Projections, 2025 to 2035
      • Y-o-Y Growth Trend Analysis
      • Absolute $ Opportunity Analysis
  5. Global Market Pricing Analysis 2020 to 2024 and Forecast 2025 to 2035
  6. Global Market Analysis 2020 to 2024 and Forecast 2025 to 2035, By Material Type
    • Introduction / Key Findings
    • Historical Market Size Value (USD Million) Analysis By Material Type , 2020 to 2024
    • Current and Future Market Size Value (USD Million) Analysis and Forecast By Material Type , 2025 to 2035
      • Paper & Paperboard
      • Plastic
      • Others
    • Y-o-Y Growth Trend Analysis By Material Type , 2020 to 2024
    • Absolute $ Opportunity Analysis By Material Type , 2025 to 2035
  7. Global Market Analysis 2020 to 2024 and Forecast 2025 to 2035, By Paper & Paperboard
    • Introduction / Key Findings
    • Historical Market Size Value (USD Million) Analysis By Paper & Paperboard, 2020 to 2024
    • Current and Future Market Size Value (USD Million) Analysis and Forecast By Paper & Paperboard, 2025 to 2035
      • Corrugated Paper
      • Kraft Paper
      • Poly Coated Paper
      • Folding Box Board
      • Others
    • Y-o-Y Growth Trend Analysis By Paper & Paperboard, 2020 to 2024
    • Absolute $ Opportunity Analysis By Paper & Paperboard, 2025 to 2035
  8. Global Market Analysis 2020 to 2024 and Forecast 2025 to 2035, By Product Type
    • Introduction / Key Findings
    • Historical Market Size Value (USD Million) Analysis By Product Type, 2020 to 2024
    • Current and Future Market Size Value (USD Million) Analysis and Forecast By Product Type, 2025 to 2035
      • Bottles & Jars
      • Cans
      • Containers
      • Boxes
      • Cups
      • Others
    • Y-o-Y Growth Trend Analysis By Product Type, 2020 to 2024
    • Absolute $ Opportunity Analysis By Product Type, 2025 to 2035
  9. Global Market Analysis 2020 to 2024 and Forecast 2025 to 2035, By Packaging Style
    • Introduction / Key Findings
    • Historical Market Size Value (USD Million) Analysis By Packaging Style, 2020 to 2024
    • Current and Future Market Size Value (USD Million) Analysis and Forecast By Packaging Style, 2025 to 2035
      • Neck-Through Style
      • Over The Top Style
      • Handle Based Style
      • Cluster Sleeve Style
      • Cluster Side Style
      • Others
    • Y-o-Y Growth Trend Analysis By Packaging Style, 2020 to 2024
    • Absolute $ Opportunity Analysis By Packaging Style, 2025 to 2035
  10. Global Market Analysis 2020 to 2024 and Forecast 2025 to 2035, By Number Of Tiers
    • Introduction / Key Findings
    • Historical Market Size Value (USD Million) Analysis By Number Of Tiers, 2020 to 2024
    • Current and Future Market Size Value (USD Million) Analysis and Forecast By Number Of Tiers, 2025 to 2035
      • Single Tier Cluster Packaging
      • Multiple Tier Cluster Packaging
    • Y-o-Y Growth Trend Analysis By Number Of Tiers, 2020 to 2024
    • Absolute $ Opportunity Analysis By Number Of Tiers, 2025 to 2035
  11. Global Market Analysis 2020 to 2024 and Forecast 2025 to 2035, By End-Use
    • Introduction / Key Findings
    • Historical Market Size Value (USD Million) Analysis By End-Use, 2020 to 2024
    • Current and Future Market Size Value (USD Million) Analysis and Forecast By End-Use, 2025 to 2035
      • Food
      • Beverages
      • Pharmaceuticals & Healthcare
      • Personal Care & Cosmetics
      • Industrial Goods
      • Others
    • Y-o-Y Growth Trend Analysis By End-Use, 2020 to 2024
    • Absolute $ Opportunity Analysis By End-Use, 2025 to 2035
  12. Global Market Analysis 2020 to 2024 and Forecast 2025 to 2035, By Region
    • Introduction
    • Historical Market Size Value (USD Million) Analysis By Region, 2020 to 2024
    • Current Market Size Value (USD Million) Analysis and Forecast By Region, 2025 to 2035
      • North America
      • Latin America
      • Western Europe
      • Eastern Europe
      • East Asia
      • South Asia and Pacific
      • Middle East & Africa
    • Market Attractiveness Analysis By Region
  13. North America Market Analysis 2020 to 2024 and Forecast 2025 to 2035, By Country
    • Historical Market Size Value (USD Million) Trend Analysis By Market Taxonomy, 2020 to 2024
    • Market Size Value (USD Million) Forecast By Market Taxonomy, 2025 to 2035
      • By Country
        • USA
        • Canada
        • Mexico
      • By Material Type
      • By Paper & Paperboard
      • By Product Type
      • By Packaging Style
      • By Number Of Tiers
      • By End-Use
    • Market Attractiveness Analysis
      • By Country
      • By Material Type
      • By Paper & Paperboard
      • By Product Type
      • By Packaging Style
      • By Number Of Tiers
      • By End-Use
    • Key Takeaways
  14. Latin America Market Analysis 2020 to 2024 and Forecast 2025 to 2035, By Country
    • Historical Market Size Value (USD Million) Trend Analysis By Market Taxonomy, 2020 to 2024
    • Market Size Value (USD Million) Forecast By Market Taxonomy, 2025 to 2035
      • By Country
        • Brazil
        • Chile
        • Rest of Latin America
      • By Material Type
      • By Paper & Paperboard
      • By Product Type
      • By Packaging Style
      • By Number Of Tiers
      • By End-Use
    • Market Attractiveness Analysis
      • By Country
      • By Material Type
      • By Paper & Paperboard
      • By Product Type
      • By Packaging Style
      • By Number Of Tiers
      • By End-Use
    • Key Takeaways
  15. Western Europe Market Analysis 2020 to 2024 and Forecast 2025 to 2035, By Country
    • Historical Market Size Value (USD Million) Trend Analysis By Market Taxonomy, 2020 to 2024
    • Market Size Value (USD Million) Forecast By Market Taxonomy, 2025 to 2035
      • By Country
        • Germany
        • UK
        • Italy
        • Spain
        • France
        • Nordic
        • BENELUX
        • Rest of Western Europe
      • By Material Type
      • By Paper & Paperboard
      • By Product Type
      • By Packaging Style
      • By Number Of Tiers
      • By End-Use
    • Market Attractiveness Analysis
      • By Country
      • By Material Type
      • By Paper & Paperboard
      • By Product Type
      • By Packaging Style
      • By Number Of Tiers
      • By End-Use
    • Key Takeaways
  16. Eastern Europe Market Analysis 2020 to 2024 and Forecast 2025 to 2035, By Country
    • Historical Market Size Value (USD Million) Trend Analysis By Market Taxonomy, 2020 to 2024
    • Market Size Value (USD Million) Forecast By Market Taxonomy, 2025 to 2035
      • By Country
        • Russia
        • Poland
        • Hungary
        • Balkan & Baltic
        • Rest of Eastern Europe
      • By Material Type
      • By Paper & Paperboard
      • By Product Type
      • By Packaging Style
      • By Number Of Tiers
      • By End-Use
    • Market Attractiveness Analysis
      • By Country
      • By Material Type
      • By Paper & Paperboard
      • By Product Type
      • By Packaging Style
      • By Number Of Tiers
      • By End-Use
    • Key Takeaways
  17. East Asia Market Analysis 2020 to 2024 and Forecast 2025 to 2035, By Country
    • Historical Market Size Value (USD Million) Trend Analysis By Market Taxonomy, 2020 to 2024
    • Market Size Value (USD Million) Forecast By Market Taxonomy, 2025 to 2035
      • By Country
        • China
        • Japan
        • South Korea
      • By Material Type
      • By Paper & Paperboard
      • By Product Type
      • By Packaging Style
      • By Number Of Tiers
      • By End-Use
    • Market Attractiveness Analysis
      • By Country
      • By Material Type
      • By Paper & Paperboard
      • By Product Type
      • By Packaging Style
      • By Number Of Tiers
      • By End-Use
    • Key Takeaways
  18. South Asia and Pacific Market Analysis 2020 to 2024 and Forecast 2025 to 2035, By Country
    • Historical Market Size Value (USD Million) Trend Analysis By Market Taxonomy, 2020 to 2024
    • Market Size Value (USD Million) Forecast By Market Taxonomy, 2025 to 2035
      • By Country
        • India
        • ASEAN
        • Australia & New Zealand
        • Rest of South Asia and Pacific
      • By Material Type
      • By Paper & Paperboard
      • By Product Type
      • By Packaging Style
      • By Number Of Tiers
      • By End-Use
    • Market Attractiveness Analysis
      • By Country
      • By Material Type
      • By Paper & Paperboard
      • By Product Type
      • By Packaging Style
      • By Number Of Tiers
      • By End-Use
    • Key Takeaways
  19. Middle East & Africa Market Analysis 2020 to 2024 and Forecast 2025 to 2035, By Country
    • Historical Market Size Value (USD Million) Trend Analysis By Market Taxonomy, 2020 to 2024
    • Market Size Value (USD Million) Forecast By Market Taxonomy, 2025 to 2035
      • By Country
        • Kingdom of Saudi Arabia
        • Other GCC Countries
        • Turkiye
        • South Africa
        • Other African Union
        • Rest of Middle East & Africa
      • By Material Type
      • By Paper & Paperboard
      • By Product Type
      • By Packaging Style
      • By Number Of Tiers
      • By End-Use
    • Market Attractiveness Analysis
      • By Country
      • By Material Type
      • By Paper & Paperboard
      • By Product Type
      • By Packaging Style
      • By Number Of Tiers
      • By End-Use
    • Key Takeaways
  20. Key Countries Market Analysis
    • USA
      • Pricing Analysis
      • Market Share Analysis, 2024
        • By Material Type
        • By Paper & Paperboard
        • By Product Type
        • By Packaging Style
        • By Number Of Tiers
        • By End-Use
    • Canada
      • Pricing Analysis
      • Market Share Analysis, 2024
        • By Material Type
        • By Paper & Paperboard
        • By Product Type
        • By Packaging Style
        • By Number Of Tiers
        • By End-Use
    • Mexico
      • Pricing Analysis
      • Market Share Analysis, 2024
        • By Material Type
        • By Paper & Paperboard
        • By Product Type
        • By Packaging Style
        • By Number Of Tiers
        • By End-Use
    • Brazil
      • Pricing Analysis
      • Market Share Analysis, 2024
        • By Material Type
        • By Paper & Paperboard
        • By Product Type
        • By Packaging Style
        • By Number Of Tiers
        • By End-Use
    • Chile
      • Pricing Analysis
      • Market Share Analysis, 2024
        • By Material Type
        • By Paper & Paperboard
        • By Product Type
        • By Packaging Style
        • By Number Of Tiers
        • By End-Use
    • Germany
      • Pricing Analysis
      • Market Share Analysis, 2024
        • By Material Type
        • By Paper & Paperboard
        • By Product Type
        • By Packaging Style
        • By Number Of Tiers
        • By End-Use
    • UK
      • Pricing Analysis
      • Market Share Analysis, 2024
        • By Material Type
        • By Paper & Paperboard
        • By Product Type
        • By Packaging Style
        • By Number Of Tiers
        • By End-Use
    • Italy
      • Pricing Analysis
      • Market Share Analysis, 2024
        • By Material Type
        • By Paper & Paperboard
        • By Product Type
        • By Packaging Style
        • By Number Of Tiers
        • By End-Use
    • Spain
      • Pricing Analysis
      • Market Share Analysis, 2024
        • By Material Type
        • By Paper & Paperboard
        • By Product Type
        • By Packaging Style
        • By Number Of Tiers
        • By End-Use
    • France
      • Pricing Analysis
      • Market Share Analysis, 2024
        • By Material Type
        • By Paper & Paperboard
        • By Product Type
        • By Packaging Style
        • By Number Of Tiers
        • By End-Use
    • India
      • Pricing Analysis
      • Market Share Analysis, 2024
        • By Material Type
        • By Paper & Paperboard
        • By Product Type
        • By Packaging Style
        • By Number Of Tiers
        • By End-Use
    • ASEAN
      • Pricing Analysis
      • Market Share Analysis, 2024
        • By Material Type
        • By Paper & Paperboard
        • By Product Type
        • By Packaging Style
        • By Number Of Tiers
        • By End-Use
    • Australia & New Zealand
      • Pricing Analysis
      • Market Share Analysis, 2024
        • By Material Type
        • By Paper & Paperboard
        • By Product Type
        • By Packaging Style
        • By Number Of Tiers
        • By End-Use
    • China
      • Pricing Analysis
      • Market Share Analysis, 2024
        • By Material Type
        • By Paper & Paperboard
        • By Product Type
        • By Packaging Style
        • By Number Of Tiers
        • By End-Use
    • Japan
      • Pricing Analysis
      • Market Share Analysis, 2024
        • By Material Type
        • By Paper & Paperboard
        • By Product Type
        • By Packaging Style
        • By Number Of Tiers
        • By End-Use
    • South Korea
      • Pricing Analysis
      • Market Share Analysis, 2024
        • By Material Type
        • By Paper & Paperboard
        • By Product Type
        • By Packaging Style
        • By Number Of Tiers
        • By End-Use
    • Russia
      • Pricing Analysis
      • Market Share Analysis, 2024
        • By Material Type
        • By Paper & Paperboard
        • By Product Type
        • By Packaging Style
        • By Number Of Tiers
        • By End-Use
    • Poland
      • Pricing Analysis
      • Market Share Analysis, 2024
        • By Material Type
        • By Paper & Paperboard
        • By Product Type
        • By Packaging Style
        • By Number Of Tiers
        • By End-Use
    • Hungary
      • Pricing Analysis
      • Market Share Analysis, 2024
        • By Material Type
        • By Paper & Paperboard
        • By Product Type
        • By Packaging Style
        • By Number Of Tiers
        • By End-Use
    • Kingdom of Saudi Arabia
      • Pricing Analysis
      • Market Share Analysis, 2024
        • By Material Type
        • By Paper & Paperboard
        • By Product Type
        • By Packaging Style
        • By Number Of Tiers
        • By End-Use
    • Turkiye
      • Pricing Analysis
      • Market Share Analysis, 2024
        • By Material Type
        • By Paper & Paperboard
        • By Product Type
        • By Packaging Style
        • By Number Of Tiers
        • By End-Use
    • South Africa
      • Pricing Analysis
      • Market Share Analysis, 2024
        • By Material Type
        • By Paper & Paperboard
        • By Product Type
        • By Packaging Style
        • By Number Of Tiers
        • By End-Use
  21. Market Structure Analysis
    • Competition Dashboard
    • Competition Benchmarking
    • Market Share Analysis of Top Players
      • By Regional
      • By Material Type
      • By Paper & Paperboard
      • By Product Type
      • By Packaging Style
      • By Number Of Tiers
      • By End-Use
  22. Competition Analysis
    • Competition Deep Dive
      • Amkor Technology, Inc.
        • Overview
        • Product Portfolio
        • Profitability by Market Segments (Product/Age /Sales Channel/Region)
        • Sales Footprint
        • Strategy Overview
          • Marketing Strategy
          • Product Strategy
          • Channel Strategy
      • ASE Group
      • Intel Corporation
      • Samsung Electronics Co., Ltd.
      • TSMC (Taiwan Semiconductor Manufacturing Company)
      • Texas Instruments Incorporated
      • STMicroelectronics N.V.
      • Broadcom Inc.
      • Qualcomm Incorporated
      • NXP Semiconductors N.V.
      • Infineon Technologies AG
      • Renesas Electronics Corporation
      • Micron Technology, Inc.
      • SK Hynix Inc.
  23. Assumptions & Acronyms Used
  24. Research Methodology

List of Tables

  • Table 1: Global Market Value (USD Million) Forecast by Region, 2020-2035
  • Table 2: Global Market Value (USD Million) Forecast by Material Type , 2020-2035
  • Table 3: Global Market Value (USD Million) Forecast by Paper & Paperboard, 2020-2035
  • Table 4: Global Market Value (USD Million) Forecast by Product Type, 2020-2035
  • Table 5: Global Market Value (USD Million) Forecast by Packaging Style, 2020-2035
  • Table 6: Global Market Value (USD Million) Forecast by Number Of Tiers, 2020-2035
  • Table 7: Global Market Value (USD Million) Forecast by End-Use, 2020-2035
  • Table 8: North America Market Value (USD Million) Forecast by Country, 2020-2035
  • Table 9: North America Market Value (USD Million) Forecast by Material Type , 2020-2035
  • Table 10: North America Market Value (USD Million) Forecast by Paper & Paperboard, 2020-2035
  • Table 11: North America Market Value (USD Million) Forecast by Product Type, 2020-2035
  • Table 12: North America Market Value (USD Million) Forecast by Packaging Style, 2020-2035
  • Table 13: North America Market Value (USD Million) Forecast by Number Of Tiers, 2020-2035
  • Table 14: North America Market Value (USD Million) Forecast by End-Use, 2020-2035
  • Table 15: Latin America Market Value (USD Million) Forecast by Country, 2020-2035
  • Table 16: Latin America Market Value (USD Million) Forecast by Material Type , 2020-2035
  • Table 17: Latin America Market Value (USD Million) Forecast by Paper & Paperboard, 2020-2035
  • Table 18: Latin America Market Value (USD Million) Forecast by Product Type, 2020-2035
  • Table 19: Latin America Market Value (USD Million) Forecast by Packaging Style, 2020-2035
  • Table 20: Latin America Market Value (USD Million) Forecast by Number Of Tiers, 2020-2035
  • Table 21: Latin America Market Value (USD Million) Forecast by End-Use, 2020-2035
  • Table 22: Western Europe Market Value (USD Million) Forecast by Country, 2020-2035
  • Table 23: Western Europe Market Value (USD Million) Forecast by Material Type , 2020-2035
  • Table 24: Western Europe Market Value (USD Million) Forecast by Paper & Paperboard, 2020-2035
  • Table 25: Western Europe Market Value (USD Million) Forecast by Product Type, 2020-2035
  • Table 26: Western Europe Market Value (USD Million) Forecast by Packaging Style, 2020-2035
  • Table 27: Western Europe Market Value (USD Million) Forecast by Number Of Tiers, 2020-2035
  • Table 28: Western Europe Market Value (USD Million) Forecast by End-Use, 2020-2035
  • Table 29: Eastern Europe Market Value (USD Million) Forecast by Country, 2020-2035
  • Table 30: Eastern Europe Market Value (USD Million) Forecast by Material Type , 2020-2035
  • Table 31: Eastern Europe Market Value (USD Million) Forecast by Paper & Paperboard, 2020-2035
  • Table 32: Eastern Europe Market Value (USD Million) Forecast by Product Type, 2020-2035
  • Table 33: Eastern Europe Market Value (USD Million) Forecast by Packaging Style, 2020-2035
  • Table 34: Eastern Europe Market Value (USD Million) Forecast by Number Of Tiers, 2020-2035
  • Table 35: Eastern Europe Market Value (USD Million) Forecast by End-Use, 2020-2035
  • Table 36: East Asia Market Value (USD Million) Forecast by Country, 2020-2035
  • Table 37: East Asia Market Value (USD Million) Forecast by Material Type , 2020-2035
  • Table 38: East Asia Market Value (USD Million) Forecast by Paper & Paperboard, 2020-2035
  • Table 39: East Asia Market Value (USD Million) Forecast by Product Type, 2020-2035
  • Table 40: East Asia Market Value (USD Million) Forecast by Packaging Style, 2020-2035
  • Table 41: East Asia Market Value (USD Million) Forecast by Number Of Tiers, 2020-2035
  • Table 42: East Asia Market Value (USD Million) Forecast by End-Use, 2020-2035
  • Table 43: South Asia and Pacific Market Value (USD Million) Forecast by Country, 2020-2035
  • Table 44: South Asia and Pacific Market Value (USD Million) Forecast by Material Type , 2020-2035
  • Table 45: South Asia and Pacific Market Value (USD Million) Forecast by Paper & Paperboard, 2020-2035
  • Table 46: South Asia and Pacific Market Value (USD Million) Forecast by Product Type, 2020-2035
  • Table 47: South Asia and Pacific Market Value (USD Million) Forecast by Packaging Style, 2020-2035
  • Table 48: South Asia and Pacific Market Value (USD Million) Forecast by Number Of Tiers, 2020-2035
  • Table 49: South Asia and Pacific Market Value (USD Million) Forecast by End-Use, 2020-2035
  • Table 50: Middle East & Africa Market Value (USD Million) Forecast by Country, 2020-2035
  • Table 51: Middle East & Africa Market Value (USD Million) Forecast by Material Type , 2020-2035
  • Table 52: Middle East & Africa Market Value (USD Million) Forecast by Paper & Paperboard, 2020-2035
  • Table 53: Middle East & Africa Market Value (USD Million) Forecast by Product Type, 2020-2035
  • Table 54: Middle East & Africa Market Value (USD Million) Forecast by Packaging Style, 2020-2035
  • Table 55: Middle East & Africa Market Value (USD Million) Forecast by Number Of Tiers, 2020-2035
  • Table 56: Middle East & Africa Market Value (USD Million) Forecast by End-Use, 2020-2035

List of Figures

  • Figure 1: Global Market Pricing Analysis
  • Figure 2: Global Market Value (USD Million) Forecast 2020-2035
  • Figure 3: Global Market Value Share and BPS Analysis by Material Type , 2025 and 2035
  • Figure 4: Global Market Y-o-Y Growth Comparison by Material Type , 2025-2035
  • Figure 5: Global Market Attractiveness Analysis by Material Type
  • Figure 6: Global Market Value Share and BPS Analysis by Paper & Paperboard, 2025 and 2035
  • Figure 7: Global Market Y-o-Y Growth Comparison by Paper & Paperboard, 2025-2035
  • Figure 8: Global Market Attractiveness Analysis by Paper & Paperboard
  • Figure 9: Global Market Value Share and BPS Analysis by Product Type, 2025 and 2035
  • Figure 10: Global Market Y-o-Y Growth Comparison by Product Type, 2025-2035
  • Figure 11: Global Market Attractiveness Analysis by Product Type
  • Figure 12: Global Market Value Share and BPS Analysis by Packaging Style, 2025 and 2035
  • Figure 13: Global Market Y-o-Y Growth Comparison by Packaging Style, 2025-2035
  • Figure 14: Global Market Attractiveness Analysis by Packaging Style
  • Figure 15: Global Market Value Share and BPS Analysis by Number Of Tiers, 2025 and 2035
  • Figure 16: Global Market Y-o-Y Growth Comparison by Number Of Tiers, 2025-2035
  • Figure 17: Global Market Attractiveness Analysis by Number Of Tiers
  • Figure 18: Global Market Value Share and BPS Analysis by End-Use, 2025 and 2035
  • Figure 19: Global Market Y-o-Y Growth Comparison by End-Use, 2025-2035
  • Figure 20: Global Market Attractiveness Analysis by End-Use
  • Figure 21: Global Market Value (USD Million) Share and BPS Analysis by Region, 2025 and 2035
  • Figure 22: Global Market Y-o-Y Growth Comparison by Region, 2025-2035
  • Figure 23: Global Market Attractiveness Analysis by Region
  • Figure 24: North America Market Incremental Dollar Opportunity, 2025-2035
  • Figure 25: Latin America Market Incremental Dollar Opportunity, 2025-2035
  • Figure 26: Western Europe Market Incremental Dollar Opportunity, 2025-2035
  • Figure 27: Eastern Europe Market Incremental Dollar Opportunity, 2025-2035
  • Figure 28: East Asia Market Incremental Dollar Opportunity, 2025-2035
  • Figure 29: South Asia and Pacific Market Incremental Dollar Opportunity, 2025-2035
  • Figure 30: Middle East & Africa Market Incremental Dollar Opportunity, 2025-2035
  • Figure 31: North America Market Value Share and BPS Analysis by Country, 2025 and 2035
  • Figure 32: North America Market Value Share and BPS Analysis by Material Type , 2025 and 2035
  • Figure 33: North America Market Y-o-Y Growth Comparison by Material Type , 2025-2035
  • Figure 34: North America Market Attractiveness Analysis by Material Type
  • Figure 35: North America Market Value Share and BPS Analysis by Paper & Paperboard, 2025 and 2035
  • Figure 36: North America Market Y-o-Y Growth Comparison by Paper & Paperboard, 2025-2035
  • Figure 37: North America Market Attractiveness Analysis by Paper & Paperboard
  • Figure 38: North America Market Value Share and BPS Analysis by Product Type, 2025 and 2035
  • Figure 39: North America Market Y-o-Y Growth Comparison by Product Type, 2025-2035
  • Figure 40: North America Market Attractiveness Analysis by Product Type
  • Figure 41: North America Market Value Share and BPS Analysis by Packaging Style, 2025 and 2035
  • Figure 42: North America Market Y-o-Y Growth Comparison by Packaging Style, 2025-2035
  • Figure 43: North America Market Attractiveness Analysis by Packaging Style
  • Figure 44: North America Market Value Share and BPS Analysis by Number Of Tiers, 2025 and 2035
  • Figure 45: North America Market Y-o-Y Growth Comparison by Number Of Tiers, 2025-2035
  • Figure 46: North America Market Attractiveness Analysis by Number Of Tiers
  • Figure 47: North America Market Value Share and BPS Analysis by End-Use, 2025 and 2035
  • Figure 48: North America Market Y-o-Y Growth Comparison by End-Use, 2025-2035
  • Figure 49: North America Market Attractiveness Analysis by End-Use
  • Figure 50: Latin America Market Value Share and BPS Analysis by Country, 2025 and 2035
  • Figure 51: Latin America Market Value Share and BPS Analysis by Material Type , 2025 and 2035
  • Figure 52: Latin America Market Y-o-Y Growth Comparison by Material Type , 2025-2035
  • Figure 53: Latin America Market Attractiveness Analysis by Material Type
  • Figure 54: Latin America Market Value Share and BPS Analysis by Paper & Paperboard, 2025 and 2035
  • Figure 55: Latin America Market Y-o-Y Growth Comparison by Paper & Paperboard, 2025-2035
  • Figure 56: Latin America Market Attractiveness Analysis by Paper & Paperboard
  • Figure 57: Latin America Market Value Share and BPS Analysis by Product Type, 2025 and 2035
  • Figure 58: Latin America Market Y-o-Y Growth Comparison by Product Type, 2025-2035
  • Figure 59: Latin America Market Attractiveness Analysis by Product Type
  • Figure 60: Latin America Market Value Share and BPS Analysis by Packaging Style, 2025 and 2035
  • Figure 61: Latin America Market Y-o-Y Growth Comparison by Packaging Style, 2025-2035
  • Figure 62: Latin America Market Attractiveness Analysis by Packaging Style
  • Figure 63: Latin America Market Value Share and BPS Analysis by Number Of Tiers, 2025 and 2035
  • Figure 64: Latin America Market Y-o-Y Growth Comparison by Number Of Tiers, 2025-2035
  • Figure 65: Latin America Market Attractiveness Analysis by Number Of Tiers
  • Figure 66: Latin America Market Value Share and BPS Analysis by End-Use, 2025 and 2035
  • Figure 67: Latin America Market Y-o-Y Growth Comparison by End-Use, 2025-2035
  • Figure 68: Latin America Market Attractiveness Analysis by End-Use
  • Figure 69: Western Europe Market Value Share and BPS Analysis by Country, 2025 and 2035
  • Figure 70: Western Europe Market Value Share and BPS Analysis by Material Type , 2025 and 2035
  • Figure 71: Western Europe Market Y-o-Y Growth Comparison by Material Type , 2025-2035
  • Figure 72: Western Europe Market Attractiveness Analysis by Material Type
  • Figure 73: Western Europe Market Value Share and BPS Analysis by Paper & Paperboard, 2025 and 2035
  • Figure 74: Western Europe Market Y-o-Y Growth Comparison by Paper & Paperboard, 2025-2035
  • Figure 75: Western Europe Market Attractiveness Analysis by Paper & Paperboard
  • Figure 76: Western Europe Market Value Share and BPS Analysis by Product Type, 2025 and 2035
  • Figure 77: Western Europe Market Y-o-Y Growth Comparison by Product Type, 2025-2035
  • Figure 78: Western Europe Market Attractiveness Analysis by Product Type
  • Figure 79: Western Europe Market Value Share and BPS Analysis by Packaging Style, 2025 and 2035
  • Figure 80: Western Europe Market Y-o-Y Growth Comparison by Packaging Style, 2025-2035
  • Figure 81: Western Europe Market Attractiveness Analysis by Packaging Style
  • Figure 82: Western Europe Market Value Share and BPS Analysis by Number Of Tiers, 2025 and 2035
  • Figure 83: Western Europe Market Y-o-Y Growth Comparison by Number Of Tiers, 2025-2035
  • Figure 84: Western Europe Market Attractiveness Analysis by Number Of Tiers
  • Figure 85: Western Europe Market Value Share and BPS Analysis by End-Use, 2025 and 2035
  • Figure 86: Western Europe Market Y-o-Y Growth Comparison by End-Use, 2025-2035
  • Figure 87: Western Europe Market Attractiveness Analysis by End-Use
  • Figure 88: Eastern Europe Market Value Share and BPS Analysis by Country, 2025 and 2035
  • Figure 89: Eastern Europe Market Value Share and BPS Analysis by Material Type , 2025 and 2035
  • Figure 90: Eastern Europe Market Y-o-Y Growth Comparison by Material Type , 2025-2035
  • Figure 91: Eastern Europe Market Attractiveness Analysis by Material Type
  • Figure 92: Eastern Europe Market Value Share and BPS Analysis by Paper & Paperboard, 2025 and 2035
  • Figure 93: Eastern Europe Market Y-o-Y Growth Comparison by Paper & Paperboard, 2025-2035
  • Figure 94: Eastern Europe Market Attractiveness Analysis by Paper & Paperboard
  • Figure 95: Eastern Europe Market Value Share and BPS Analysis by Product Type, 2025 and 2035
  • Figure 96: Eastern Europe Market Y-o-Y Growth Comparison by Product Type, 2025-2035
  • Figure 97: Eastern Europe Market Attractiveness Analysis by Product Type
  • Figure 98: Eastern Europe Market Value Share and BPS Analysis by Packaging Style, 2025 and 2035
  • Figure 99: Eastern Europe Market Y-o-Y Growth Comparison by Packaging Style, 2025-2035
  • Figure 100: Eastern Europe Market Attractiveness Analysis by Packaging Style
  • Figure 101: Eastern Europe Market Value Share and BPS Analysis by Number Of Tiers, 2025 and 2035
  • Figure 102: Eastern Europe Market Y-o-Y Growth Comparison by Number Of Tiers, 2025-2035
  • Figure 103: Eastern Europe Market Attractiveness Analysis by Number Of Tiers
  • Figure 104: Eastern Europe Market Value Share and BPS Analysis by End-Use, 2025 and 2035
  • Figure 105: Eastern Europe Market Y-o-Y Growth Comparison by End-Use, 2025-2035
  • Figure 106: Eastern Europe Market Attractiveness Analysis by End-Use
  • Figure 107: East Asia Market Value Share and BPS Analysis by Country, 2025 and 2035
  • Figure 108: East Asia Market Value Share and BPS Analysis by Material Type , 2025 and 2035
  • Figure 109: East Asia Market Y-o-Y Growth Comparison by Material Type , 2025-2035
  • Figure 110: East Asia Market Attractiveness Analysis by Material Type
  • Figure 111: East Asia Market Value Share and BPS Analysis by Paper & Paperboard, 2025 and 2035
  • Figure 112: East Asia Market Y-o-Y Growth Comparison by Paper & Paperboard, 2025-2035
  • Figure 113: East Asia Market Attractiveness Analysis by Paper & Paperboard
  • Figure 114: East Asia Market Value Share and BPS Analysis by Product Type, 2025 and 2035
  • Figure 115: East Asia Market Y-o-Y Growth Comparison by Product Type, 2025-2035
  • Figure 116: East Asia Market Attractiveness Analysis by Product Type
  • Figure 117: East Asia Market Value Share and BPS Analysis by Packaging Style, 2025 and 2035
  • Figure 118: East Asia Market Y-o-Y Growth Comparison by Packaging Style, 2025-2035
  • Figure 119: East Asia Market Attractiveness Analysis by Packaging Style
  • Figure 120: East Asia Market Value Share and BPS Analysis by Number Of Tiers, 2025 and 2035
  • Figure 121: East Asia Market Y-o-Y Growth Comparison by Number Of Tiers, 2025-2035
  • Figure 122: East Asia Market Attractiveness Analysis by Number Of Tiers
  • Figure 123: East Asia Market Value Share and BPS Analysis by End-Use, 2025 and 2035
  • Figure 124: East Asia Market Y-o-Y Growth Comparison by End-Use, 2025-2035
  • Figure 125: East Asia Market Attractiveness Analysis by End-Use
  • Figure 126: South Asia and Pacific Market Value Share and BPS Analysis by Country, 2025 and 2035
  • Figure 127: South Asia and Pacific Market Value Share and BPS Analysis by Material Type , 2025 and 2035
  • Figure 128: South Asia and Pacific Market Y-o-Y Growth Comparison by Material Type , 2025-2035
  • Figure 129: South Asia and Pacific Market Attractiveness Analysis by Material Type
  • Figure 130: South Asia and Pacific Market Value Share and BPS Analysis by Paper & Paperboard, 2025 and 2035
  • Figure 131: South Asia and Pacific Market Y-o-Y Growth Comparison by Paper & Paperboard, 2025-2035
  • Figure 132: South Asia and Pacific Market Attractiveness Analysis by Paper & Paperboard
  • Figure 133: South Asia and Pacific Market Value Share and BPS Analysis by Product Type, 2025 and 2035
  • Figure 134: South Asia and Pacific Market Y-o-Y Growth Comparison by Product Type, 2025-2035
  • Figure 135: South Asia and Pacific Market Attractiveness Analysis by Product Type
  • Figure 136: South Asia and Pacific Market Value Share and BPS Analysis by Packaging Style, 2025 and 2035
  • Figure 137: South Asia and Pacific Market Y-o-Y Growth Comparison by Packaging Style, 2025-2035
  • Figure 138: South Asia and Pacific Market Attractiveness Analysis by Packaging Style
  • Figure 139: South Asia and Pacific Market Value Share and BPS Analysis by Number Of Tiers, 2025 and 2035
  • Figure 140: South Asia and Pacific Market Y-o-Y Growth Comparison by Number Of Tiers, 2025-2035
  • Figure 141: South Asia and Pacific Market Attractiveness Analysis by Number Of Tiers
  • Figure 142: South Asia and Pacific Market Value Share and BPS Analysis by End-Use, 2025 and 2035
  • Figure 143: South Asia and Pacific Market Y-o-Y Growth Comparison by End-Use, 2025-2035
  • Figure 144: South Asia and Pacific Market Attractiveness Analysis by End-Use
  • Figure 145: Middle East & Africa Market Value Share and BPS Analysis by Country, 2025 and 2035
  • Figure 146: Middle East & Africa Market Value Share and BPS Analysis by Material Type , 2025 and 2035
  • Figure 147: Middle East & Africa Market Y-o-Y Growth Comparison by Material Type , 2025-2035
  • Figure 148: Middle East & Africa Market Attractiveness Analysis by Material Type
  • Figure 149: Middle East & Africa Market Value Share and BPS Analysis by Paper & Paperboard, 2025 and 2035
  • Figure 150: Middle East & Africa Market Y-o-Y Growth Comparison by Paper & Paperboard, 2025-2035
  • Figure 151: Middle East & Africa Market Attractiveness Analysis by Paper & Paperboard
  • Figure 152: Middle East & Africa Market Value Share and BPS Analysis by Product Type, 2025 and 2035
  • Figure 153: Middle East & Africa Market Y-o-Y Growth Comparison by Product Type, 2025-2035
  • Figure 154: Middle East & Africa Market Attractiveness Analysis by Product Type
  • Figure 155: Middle East & Africa Market Value Share and BPS Analysis by Packaging Style, 2025 and 2035
  • Figure 156: Middle East & Africa Market Y-o-Y Growth Comparison by Packaging Style, 2025-2035
  • Figure 157: Middle East & Africa Market Attractiveness Analysis by Packaging Style
  • Figure 158: Middle East & Africa Market Value Share and BPS Analysis by Number Of Tiers, 2025 and 2035
  • Figure 159: Middle East & Africa Market Y-o-Y Growth Comparison by Number Of Tiers, 2025-2035
  • Figure 160: Middle East & Africa Market Attractiveness Analysis by Number Of Tiers
  • Figure 161: Middle East & Africa Market Value Share and BPS Analysis by End-Use, 2025 and 2035
  • Figure 162: Middle East & Africa Market Y-o-Y Growth Comparison by End-Use, 2025-2035
  • Figure 163: Middle East & Africa Market Attractiveness Analysis by End-Use
  • Figure 164: Global Market - Tier Structure Analysis
  • Figure 165: Global Market - Company Share Analysis

Frequently Asked Questions

How big is the cluster packaging market in 2025?

The global cluster packaging market is estimated to be valued at USD 6.6 billion in 2025.

What will be the size of cluster packaging market in 2035?

The market size for the cluster packaging market is projected to reach USD 10.8 billion by 2035.

How much will be the cluster packaging market growth between 2025 and 2035?

The cluster packaging market is expected to grow at a 5.0% CAGR between 2025 and 2035.

What are the key product types in the cluster packaging market?

The key product types in cluster packaging market are paper & paperboard, plastic and others.

Which paper & paperboard segment to contribute significant share in the cluster packaging market in 2025?

In terms of paper & paperboard, corrugated paper segment to command 28.7% share in the cluster packaging market in 2025.

Explore Similar Insights

Future Market Insights

Cluster Packaging Market

Chat With MaRIA

Chat With

MaRIA

Hi There, I am MaRIA, Your Market Research Intelligence Assistant. How may I help you?