Condensing Unit Market Size and Share Forecast Outlook 2025 to 2035

The global condensing unit market is estimated to be valued at USD 45.2 billion in 2025 and is forecast to grow to USD 78.0 billion by 2035, advancing at a CAGR of 5.6% during the forecast period. Growth is largely driven by rising demand for efficient climate control systems in residential, commercial, and industrial sectors, supported by urbanization, infrastructure development, and stringent energy efficiency regulations.
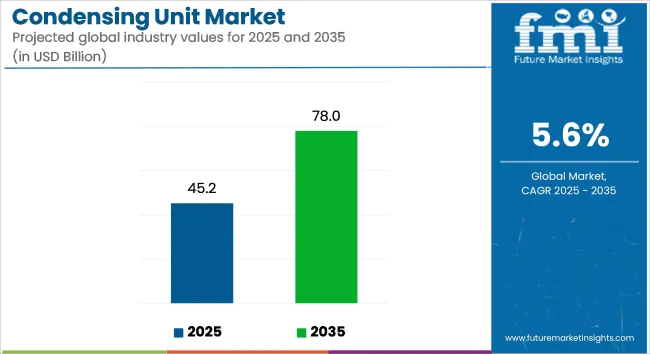
Quick Stats for Condensing Unit Market

  • Industry Value (2025): USD 45.2 Billion
  • Forecast Value (2035): USD 78.0 Billion
  • Forecast CAGR: 5.6%
  • Leading Segment by Application in 2025: Scroll compressors
  • Top Key Players: Emerson Electric Co., Danfoss, Daikin Applied, Tecumseh Products Company, Hussmann Corporation, Voltas Limited, Patton Ltd, Bitzer Kühlmaschinenbau Gmbh
Metrics Values
Industry Size (2025E) USD 45.2 billion
Industry Value (2035F) USD 78.0 billion
CAGR (2025 to 2035) 5.6%

The condensing unit market is being propelled by swift urbanization and expansion in commercial real estate, resulting in higher demand for effective and energy-efficient HVACR systems. Stricter building codes and government incentives for green buildings have also accelerated the transition to high-efficiency condensing units that meet standards such as ASHRAE 90.1 and EU Eco-design. In industrial sectors such as food & beverage, pharmaceuticals, and chemicals condensing units are critical for temperature-sensitive processes, cold storage, and cleanroom environments.

Simultaneously, advancements in refrigerants and compressor technologies are enhancing system efficiency, reducing greenhouse gas emissions, and increasing reliability. Additionally, the global push towards HVACR electrification and smart monitoring systems is driving demand for intelligent, IoT-enabled condensing units that offer real-time performance optimization and predictive maintenance capabilities. The Asia-Pacific region is expected to remain the largest and fastest-growing market, bolstered by robust infrastructure initiatives, factory modernization, and rapid growth in commercial buildings.
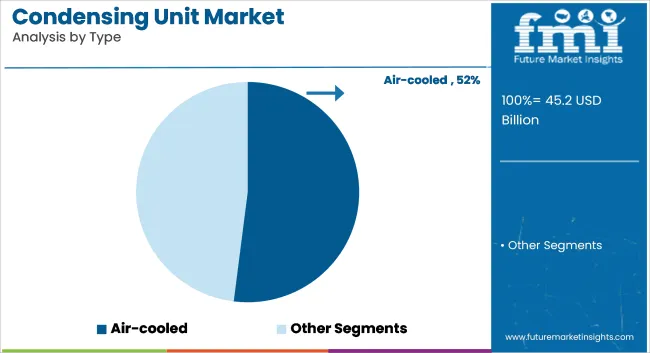
Analyzing Condensing Unit Market by Top Investing Segments

Air-Cooled Condensing Units Dominate with Ease of Installation, Lower Cost, and Broad Applicability

Air-cooled condensing units are projected to account for 52% of the overall market in 2025, growing at a CAGR of 5.5% through 2035. These units are widely used due to their simplicity, lower upfront costs, and compatibility with rooftop and modular HVAC systems. Their design enables easy retrofitting and maintenance, making them popular across commercial spaces, residential buildings, and light industrial facilities.

Newer designs incorporate electronic expansion valves, variable-speed fans, and microchannel coils boosting energy efficiency and noise reduction. Regulators and industry standards like Energy Star and Eurovent further drive adoption through rebates and certification incentives. As building owners and developers aim to reduce operational expenses and environmental footprint, air-cooled units continue to be the go-to solution across most end-use segments.
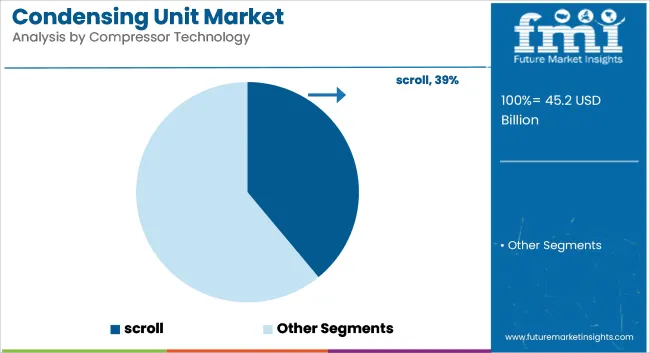
Scroll Compressors Lead with Superior Efficiency and Compact Design in HVACR and Refrigeration Systems

Scroll compressors are projected to dominate the condensing unit market, holding approximately 39% of the global share in 2025 and growing at a CAGR of 5.8% through 2035. Their widespread usage is primarily attributed to superior energy efficiency, quiet operation, and minimal maintenance requirements. These compressors are especially favored in HVACR systems used across supermarkets, cold storage facilities, commercial buildings, and residential environments.

Their compact size and compatibility with low-GWP refrigerants make them highly suitable for modern, environmentally compliant cooling solutions. As global building codes tighten and sustainability initiatives intensify, scroll compressors are becoming the preferred choice for replacing legacy systems.

In addition, their scalability across both small and large-scale applications further enhances their appeal in infrastructure and retail expansion projects. Ongoing technological advancements in variable speed and inverter-compatible scroll compressors are also improving system responsiveness and efficiency, making this segment a critical contributor to long-term condensing unit market growth.

Trend Analysis and Purchasing Criteria across Different End Use Segment

The industry caters to various stakeholders such as manufacturers, HVAC contractors, distributors, and end users, each having varied criteria as priorities. The manufacturer considers energy efficiency, longevity, and regulatory compliance to make sure their product complies with industry requirements and sustainability demands.

HVAC installers and service technicians, who perform the installation and maintenance, appreciate ease of installation, ease of maintenance, and cooling operation reliability in order to facilitate simple operation and customer satisfaction. Distributors are concerned with initial cost and availability and seek to acquire low-cost, hot-selling units that can be readily shipped from industry to industry.

End users, residential and commercial, value energy efficiency, performance, and cost because these directly affect the operating cost and comfort. As the demand for smart cooling solutions and energy-efficient solutions is on the rise, technology innovation is rapid. Urbanization, growth of commercial infrastructure, and environment legislations in the GCC region keep the industry going, forcing all the stakeholders to keep pace with evolving customer demands and sustainability needs.
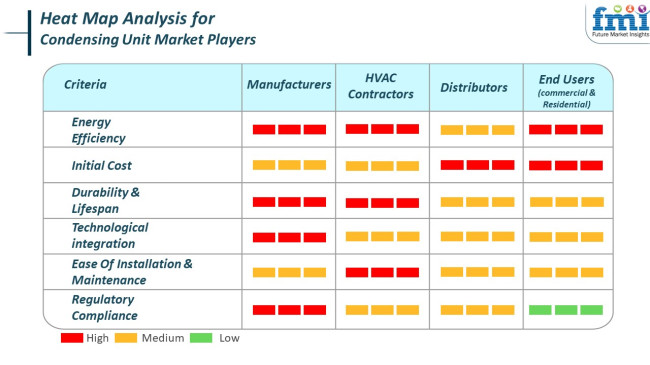
Heat Map Analysis For Condensing Unit Market Players

Risk Assessment

The industry is witnessing tremendous growth based on the growing demand for effective cooling solutions in multiple industries, such as food and beverage, pharmaceutical, and commercial buildings.

Even with this favorable trend, the industry is exposed to a number of risks that may affect its growth. Among the key issues is the regulatory environment of refrigerants. There is growing environmental regulation that forces producers to move towards environmentally friendly refrigerants. This change calls for a huge investment in research and development to design compliant products, and in case of non-compliance, industry share erosion or legal actions may ensue.

Supply chain interruption is also a major risk. Manufacturing is dependent on an advanced web of suppliers for components like compressors, heat exchangers, and controls. Geopolitical tensions, tariffs, or pandemics can derail this supply chain, hindering production and increasing costs. Companies must develop robust supply chain strategies to mitigate these threats.

Economic conditions can also affect industry conditions. The demand is greatly influenced by building and industrial activity, which is extremely cyclical. In times of recession, low investment in new buildings can lead to reduced demand for HVAC equipment such as condensing units. The manufacturers must diversify their product base and venture into new industries to act as a buffer against such downturns.

Technological innovation and changing customer tastes also bring challenges. Increasing focus on smart technologies and energy efficiency in HVAC solutions is something that doesn't go unnoticed. Companies that are not innovating and incorporating these elements into their offerings risk losing competitive advantage and failing to meet customer needs. Adapting to technology expenditure and staying informed on industry trends are essential to maintaining industry share.
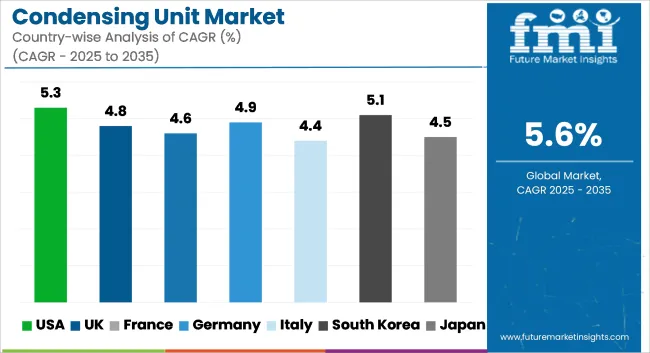
Country Wise Analysis 2025 to 2035

Countries CAGR (2025 to 2035)
USA 5.3%
UK 4.8%
France 4.6%
Germany 4.9%
Italy 4.4%
South Korea 5.1%
Japan 4.5%
China 6.2%
Australia 4.7%
New Zealand 4.3%

USA

The USA industry is anticipated to record a 5.3% CAGR between 2025 to 2035. The growth is led mainly by aggressive investments in commercial HVAC systems, food processing units, and retail refrigeration systems. Demand is also supported by growing stringent environmental regulations promoting energy-efficient and low-emission units. Deep penetration of grocery stores and quick-service restaurants in the industry also fuels the demand for high-end refrigeration solutions.

Major industry participants in the USA are Emerson Electric Co., Heatcraft Refrigeration Products LLC, and Lennox International Inc., which remain focused on innovation in modular and scroll condensing units. The movement toward natural refrigerants such as hydrocarbons and CO₂ is influencing product enhancement and buying behaviors. The development of digital monitoring and intelligent control technologies is also shaping competition.

UK

The UK industry is forecast to expand at a CAGR of 4.8% over the forecast period. Increased installation of HVAC and refrigeration equipment in urban development projects and healthcare properties is propelling the demand for high-performance options. Additionally, adherence to regulations under F-Gas regulations is compelling the replacement of high-GWP refrigerants with low-GWP refrigerants in commercial refrigeration applications.

With the adoption of compact, air-cooled condensing units, organizations such as Johnson Controls, Daikin Applied UK Ltd., and GEA Group are leaders in system efficiencies and environmental adaptability. The adoption trend of compact, air-cooled condensing units continues to extend to smaller- and medium-sized retail and hospitality sectors. Decarbonization and sustainability will continue to drive more innovation and adoption of technology across the industry.

France

The French industry is projected to grow at a CAGR of 4.6% between 2025 and 2035. The growth is driven by growth in the food retail industry, expansion in cold storage logistics, and retrofitting of commercial refrigeration equipment. Compliance with European directives on energy efficiency and climate objectives continues to drive the product mix.

Industry players such as Schneider Electric, Danfoss, and Panasonic are engaged in unit design optimization for reduced energy consumption and environmental footprints. Air-cooled products continue to have a strong industry presence due to commercial applications in urban industries. Integration of digital building blocks for performance monitoring and pre-emptive maintenance is fueling adoption across varied end-use segments.

Germany

Germany is anticipated to achieve growth at a CAGR of 4.9% during the forecast period, led by a well-established industrial base and rising environmental consciousness. Industrial and commercial refrigeration industries are shifting towards high-efficiency heat recovery systems and natural refrigerants. Efficient supermarket and logistics hub construction also aids in the growth of the industry.

Industry participants such as Bitzer, Güntner GmbH, and Emerson are putting money into R&D to develop low-noise, high-efficiency condensing units with robust environmental features. Growing demand for decentralized cold chain networks and retail infrastructure energy optimization is boosting sales of electronic, intelligent condensing units. Government policies supporting the adoption of green technology will also fuel industry growth.

Italy

Italy's industry is likely to grow at a CAGR of 4.4% through 2035, driven by increasing demand in the hospitality, food service, and pharmaceutical sectors. The replacement of aging infrastructure with energy-efficient alternatives and adherence to EU-wide refrigerant phase-down regulations are key drivers.

Industry pioneers such as LU-VE Group, Dorin, and Embraco are responding by offering tiny, environmentally friendly boxes. The units that can be placed remotely are on the rise within inner-city business applications where space available as much as sound level is a main concern. Technical advances permitting wider thermal control and refrigerant management of the kind outlined will be responsible for longer-term trends in take.

South Korea

South Korea is anticipated to grow at a CAGR of 5.1% during the forecast period, based on expansion in deployment in electronics manufacturing, biotech facilities, and high-end retail refrigeration. Local, new companies are concentrating on miniaturization and green performance, which is in line with nationwide energy-saving initiatives.

These key players - LG Electronics, Samsung HVAC, and Carrier Korea - dominate the technology developments of inverter-based condensing systems. IoT-based platform integration and focus on refrigerant leakage control and detection are increasing industry attractiveness. Government incentives for energy-efficient technology are also increasing investments towards developing new products.

Japan

The Japanese industry is expected to record a CAGR of 4.5% between 2025 and 2035. Industry leadership is dominated by technological advancement, space-saving system demand, and energy-driven commitment. Drivers are shifting refrigeration needs of the food processing, pharmaceutical, and convenience store sectors.

Industry leaders such as Daikin Industries, Panasonic Corporation, and Mitsubishi Electric continue to launch variable speed and CO₂-based solutions. Super-silent, compact units are being spurred by consumer demand in high-density urban areas, influencing product design. Advanced sensor technology and automation features are improving operating efficiency and cost savings in installations.

China

China is expected to lead global growth in the industry at a CAGR of 6.2% over the forecast period. Rapid industrialization, expansion in cold chain logistics, and high government focus on food safety and urban infrastructure development are major growth drivers. The commercial refrigeration industry is benefiting from the surge in the development of supermarkets and hypermarkets.

Domestic players such as Haier, Midea, and Highly Refrigeration are going up against global players in terms of economic and scalable condensing solutions. Green technology focus and a move towards R290 and CO₂ refrigerants are pushing new products into the marketplace. Cloud monitoring and compatibility for smart grids is increasingly applied at a mass scale in commercial uses.

Australia

Australia's industry will grow at a CAGR of 4.7% until 2035. Industry growth is stimulated by increasing demand in agriculture-based cold storage, food retail chains, and infrastructure development. Policy regulations on energy use and emissions are impacting system design and refrigerant selection.

Key industry players such as Kirby HVAC&R, Heatcraft Australia, and Actrol are marketing sustainable, modular units appropriate for varied climatic conditions. There is a strong demand for outdoor air-cooled systems with durable and corrosion-resistant materials. Solar-compatible and hybrid energy models will grow in accordance with national decarbonization policy.

New Zealand

New Zealand is projected to grow at a CAGR of 4.3% over the forecast period, driven primarily by investment in low-GWP alternatives for sustainable agriculture, food export logistics, and commercial energy-efficient buildings. The refrigeration sector is responding to government policies mandating the transition to low-GWP alternatives.

Industry leaders such as Patton Refrigeration, Realcold, and Emerson are prioritizing reliable system performance for seashore and rural use. Climate-proof, remote-monitoring-capable units are the prime driver of buying intentions. The increasing focus on operating sustainability and life-cycle efficiency is set to drive product innovation and uptake.

Competitive Outlook

The condensing unit market is highly competitive, with leading industry players Carrier, Daikin, Johnson Controls, Emerson, Mitsubishi Electric, Panasonic, and Ingersoll Rand investing heavily in R&D, sustainable refrigerants, and smart HVACR solutions.

Trends include partnerships with HVAC OEMs, contractor training programs, and deployments of digital platforms for remote monitoring and predictive service. Manufacturers are launching high-efficiency, low-GWP condensing units compliant with international standards.

Expansion strategies in emerging markets across Asia-Pacific, Latin America, and the Middle East are underway to capitalize on urban development and retail infrastructure growth. The competitive edge is determined by product performance, refrigerant compliance, digital connectivity, and an efficient service ecosystem supporting installers and end users.

  • June 2, 2025. Carrier introduced its Infinity® Variable-Speed Cold Climate Heat Pump, which includes advanced condensing unit technology. It delivers 21.2 SEER2, 13.5 EER2, and operates reliably down to -23°F, maintaining full heating capacity at 0°F. With sound levels as low as 55 decibels, it’s one of the quietest and most efficient systems available, setting new benchmarks in cold climate performance.
  • March 25, 2025. Trane expanded its Modular Self-Contained Units lineup, which includes condensing components, with new models ranging from 20 to 110 tons. These units now feature low-GWP R-454B refrigerant, standard leak detection, and Digital Symbio® 500 controls. Designed for easy installation in tight spaces, they offer up to 20.8 IEER efficiency, making them ideal for retrofits in schools, offices, and commercial buildings.

Key Players

  • Emerson Electric Co.
  • Danfoss
  • Daikin Applied
  • Tecumseh Products Company
  • Hussmann Corporation
  • Voltas Limited
  • Patton Ltd
  • Bitzer Kühlmaschinenbau Gmbh
  • Rivacold (United Kingdom Ltd)
  • Jinan Retek Industries Inc.

Key Segmentation

By Type:

By type, the industry is segmented into air-cooled, water cooled, and fan cooled.

By Refrigerant Type:

By refrigerant type, the industry is segmented into R404A, R134a, R407A/R407C/R407F, R507A or R22, and green refrigerants.

By Compressor Technology:

By compressor technology, the industry is segmented into reciprocating, hermetic, semi-hermetic, open, rotary, scroll, rotary vane, screw, and centrifugal.

By Application:

By application, the industry is segmented into high-temperature, medium temperature, and low temperature.

By End Use:

By end use, the industry is segmented into residential, commercial, and industrial.

By Region:

By region, the industry is segmented into North America, Latin America, Western Europe, Eastern Europe, South Asia and Pacific, East Asia, and the Middle East & Africa.

Table of Content

  1. Executive Summary
  2. Market Overview
  3. Market Background
  4. Global Analysis 2020 to 2024 and Forecast, 2025 to 2035
  5. Global Analysis 2020 to 2024 and Forecast 2025 to 2035, By Type
    • Air-Cooled
    • Water Cooled
    • Fan Cooled
  6. Global Analysis 2020 to 2024 and Forecast 2025 to 2035, By Refrigerant Type
    • R404A
    • R134a
    • R407A/R407C/R407F
    • R507A or R22
    • Green Refrigerants
  7. Global Analysis 2020 to 2024 and Forecast 2025 to 2035, By Compressor Technology
    • Reciprocating
    • Hermetic
    • Semi-Hermetic
    • Open
    • Rotary
    • Scroll
    • Rotary Vane
    • Screw
    • Centrifugal
  8. Global Analysis 2020 to 2024 and Forecast 2025 to 2035, By Application
    • High-Temperature
    • Medium Temperature
    • Low Temperature
  9. Global Analysis 2020 to 2024 and Forecast 2025 to 2035, By End Use
    • Residential
    • Commercial
    • Industrial
  10. Global Analysis 2020 to 2024 and Forecast 2025 to 2035, By Region
    • North America
    • Latin America
    • Western Europe
    • Eastern Europe
    • South Asia and Pacific
    • East Asia
    • Middle East and Africa
  11. North America Analysis 2020 to 2024 and Forecast 2025 to 2035, By Country
  12. Latin America Analysis 2020 to 2024 and Forecast 2025 to 2035, By Country
  13. Western Europe Analysis 2020 to 2024 and Forecast 2025 to 2035, By Country
  14. Eastern Europe Analysis 2020 to 2024 and Forecast 2025 to 2035, By Country
  15. South Asia and Pacific Analysis 2020 to 2024 and Forecast 2025 to 2035, By Country
  16. East Asia Analysis 2020 to 2024 and Forecast 2025 to 2035, By Country
  17. Middle East and Africa Analysis 2020 to 2024 and Forecast 2025 to 2035, By Country
  18. Key Countries Analysis
  19. Market Structure Analysis
  20. Competition Analysis
    • Emerson Electric Co.
    • Danfoss
    • Daikin Applied
    • Tecumseh Products Company
    • Hussmann Corporation
    • Voltas Limited
    • Patton Ltd
    • BITZER KÜHLMASCHINENBAU GMBH
    • Rivacold Value (USD Million) & Volume (Units)ed Kingdom Ltd
    • JINAN RETEK INDUSTRIES INC.
    • GEA Group
    • Blue Star Limited
    • Heatcraft Worldwide Refrigeration
    • Embraco LLC
  21. Assumptions & Acronyms Used
  22. Research Methodology

List of Tables

  • Table 1: Global Value (USD Million) Forecast by Region, 2020 to 2035
  • Table 2: Global Volume (Units) Forecast by Region, 2020 to 2035
  • Table 3: Global Value (USD Million) Forecast by Type, 2020 to 2035
  • Table 4: Global Volume (Units) Forecast by Type, 2020 to 2035
  • Table 5: Global Value (USD Million) Forecast by Refrigerant Type, 2020 to 2035
  • Table 6: Global Volume (Units) Forecast by Refrigerant Type, 2020 to 2035
  • Table 7: Global Value (USD Million) Forecast by Compressor Technology, 2020 to 2035
  • Table 8: Global Volume (Units) Forecast by Compressor Technology, 2020 to 2035
  • Table 9: Global Value (USD Million) Forecast by Application , 2020 to 2035
  • Table 10: Global Volume (Units) Forecast by Application , 2020 to 2035
  • Table 11: Global Value (USD Million) Forecast by End Use, 2020 to 2035
  • Table 12: Global Volume (Units) Forecast by End Use, 2020 to 2035
  • Table 13: North America Value (USD Million) Forecast by Country, 2020 to 2035
  • Table 14: North America Volume (Units) Forecast by Country, 2020 to 2035
  • Table 15: North America Value (USD Million) Forecast by Type, 2020 to 2035
  • Table 16: North America Volume (Units) Forecast by Type, 2020 to 2035
  • Table 17: North America Value (USD Million) Forecast by Refrigerant Type, 2020 to 2035
  • Table 18: North America Volume (Units) Forecast by Refrigerant Type, 2020 to 2035
  • Table 19: North America Value (USD Million) Forecast by Compressor Technology, 2020 to 2035
  • Table 20: North America Volume (Units) Forecast by Compressor Technology, 2020 to 2035
  • Table 21: North America Value (USD Million) Forecast by Application , 2020 to 2035
  • Table 22: North America Volume (Units) Forecast by Application , 2020 to 2035
  • Table 23: North America Value (USD Million) Forecast by End Use, 2020 to 2035
  • Table 24: North America Volume (Units) Forecast by End Use, 2020 to 2035
  • Table 25: Latin America Value (USD Million) Forecast by Country, 2020 to 2035
  • Table 26: Latin America Volume (Units) Forecast by Country, 2020 to 2035
  • Table 27: Latin America Value (USD Million) Forecast by Type, 2020 to 2035
  • Table 28: Latin America Volume (Units) Forecast by Type, 2020 to 2035
  • Table 29: Latin America Value (USD Million) Forecast by Refrigerant Type, 2020 to 2035
  • Table 30: Latin America Volume (Units) Forecast by Refrigerant Type, 2020 to 2035
  • Table 31: Latin America Value (USD Million) Forecast by Compressor Technology, 2020 to 2035
  • Table 32: Latin America Volume (Units) Forecast by Compressor Technology, 2020 to 2035
  • Table 33: Latin America Value (USD Million) Forecast by Application , 2020 to 2035
  • Table 34: Latin America Volume (Units) Forecast by Application , 2020 to 2035
  • Table 35: Latin America Value (USD Million) Forecast by End Use, 2020 to 2035
  • Table 36: Latin America Volume (Units) Forecast by End Use, 2020 to 2035
  • Table 37: Western Europe Value (USD Million) Forecast by Country, 2020 to 2035
  • Table 38: Western Europe Volume (Units) Forecast by Country, 2020 to 2035
  • Table 39: Western Europe Value (USD Million) Forecast by Type, 2020 to 2035
  • Table 40: Western Europe Volume (Units) Forecast by Type, 2020 to 2035
  • Table 41: Western Europe Value (USD Million) Forecast by Refrigerant Type, 2020 to 2035
  • Table 42: Western Europe Volume (Units) Forecast by Refrigerant Type, 2020 to 2035
  • Table 43: Western Europe Value (USD Million) Forecast by Compressor Technology, 2020 to 2035
  • Table 44: Western Europe Volume (Units) Forecast by Compressor Technology, 2020 to 2035
  • Table 45: Western Europe Value (USD Million) Forecast by Application , 2020 to 2035
  • Table 46: Western Europe Volume (Units) Forecast by Application , 2020 to 2035
  • Table 47: Western Europe Value (USD Million) Forecast by End Use, 2020 to 2035
  • Table 48: Western Europe Volume (Units) Forecast by End Use, 2020 to 2035
  • Table 49: Eastern Europe Value (USD Million) Forecast by Country, 2020 to 2035
  • Table 50: Eastern Europe Volume (Units) Forecast by Country, 2020 to 2035
  • Table 51: Eastern Europe Value (USD Million) Forecast by Type, 2020 to 2035
  • Table 52: Eastern Europe Volume (Units) Forecast by Type, 2020 to 2035
  • Table 53: Eastern Europe Value (USD Million) Forecast by Refrigerant Type, 2020 to 2035
  • Table 54: Eastern Europe Volume (Units) Forecast by Refrigerant Type, 2020 to 2035
  • Table 55: Eastern Europe Value (USD Million) Forecast by Compressor Technology, 2020 to 2035
  • Table 56: Eastern Europe Volume (Units) Forecast by Compressor Technology, 2020 to 2035
  • Table 57: Eastern Europe Value (USD Million) Forecast by Application , 2020 to 2035
  • Table 58: Eastern Europe Volume (Units) Forecast by Application , 2020 to 2035
  • Table 59: Eastern Europe Value (USD Million) Forecast by End Use, 2020 to 2035
  • Table 60: Eastern Europe Volume (Units) Forecast by End Use, 2020 to 2035
  • Table 61: South Asia and Pacific Value (USD Million) Forecast by Country, 2020 to 2035
  • Table 62: South Asia and Pacific Volume (Units) Forecast by Country, 2020 to 2035
  • Table 63: South Asia and Pacific Value (USD Million) Forecast by Type, 2020 to 2035
  • Table 64: South Asia and Pacific Volume (Units) Forecast by Type, 2020 to 2035
  • Table 65: South Asia and Pacific Value (USD Million) Forecast by Refrigerant Type, 2020 to 2035
  • Table 66: South Asia and Pacific Volume (Units) Forecast by Refrigerant Type, 2020 to 2035
  • Table 67: South Asia and Pacific Value (USD Million) Forecast by Compressor Technology, 2020 to 2035
  • Table 68: South Asia and Pacific Volume (Units) Forecast by Compressor Technology, 2020 to 2035
  • Table 69: South Asia and Pacific Value (USD Million) Forecast by Application , 2020 to 2035
  • Table 70: South Asia and Pacific Volume (Units) Forecast by Application , 2020 to 2035
  • Table 71: South Asia and Pacific Value (USD Million) Forecast by End Use, 2020 to 2035
  • Table 72: South Asia and Pacific Volume (Units) Forecast by End Use, 2020 to 2035
  • Table 73: East Asia Value (USD Million) Forecast by Country, 2020 to 2035
  • Table 74: East Asia Volume (Units) Forecast by Country, 2020 to 2035
  • Table 75: East Asia Value (USD Million) Forecast by Type, 2020 to 2035
  • Table 76: East Asia Volume (Units) Forecast by Type, 2020 to 2035
  • Table 77: East Asia Value (USD Million) Forecast by Refrigerant Type, 2020 to 2035
  • Table 78: East Asia Volume (Units) Forecast by Refrigerant Type, 2020 to 2035
  • Table 79: East Asia Value (USD Million) Forecast by Compressor Technology, 2020 to 2035
  • Table 80: East Asia Volume (Units) Forecast by Compressor Technology, 2020 to 2035
  • Table 81: East Asia Value (USD Million) Forecast by Application , 2020 to 2035
  • Table 82: East Asia Volume (Units) Forecast by Application , 2020 to 2035
  • Table 83: East Asia Value (USD Million) Forecast by End Use, 2020 to 2035
  • Table 84: East Asia Volume (Units) Forecast by End Use, 2020 to 2035
  • Table 85: Middle East and Africa Value (USD Million) Forecast by Country, 2020 to 2035
  • Table 86: Middle East and Africa Volume (Units) Forecast by Country, 2020 to 2035
  • Table 87: Middle East and Africa Value (USD Million) Forecast by Type, 2020 to 2035
  • Table 88: Middle East and Africa Volume (Units) Forecast by Type, 2020 to 2035
  • Table 89: Middle East and Africa Value (USD Million) Forecast by Refrigerant Type, 2020 to 2035
  • Table 90: Middle East and Africa Volume (Units) Forecast by Refrigerant Type, 2020 to 2035
  • Table 91: Middle East and Africa Value (USD Million) Forecast by Compressor Technology, 2020 to 2035
  • Table 92: Middle East and Africa Volume (Units) Forecast by Compressor Technology, 2020 to 2035
  • Table 93: Middle East and Africa Value (USD Million) Forecast by Application , 2020 to 2035
  • Table 94: Middle East and Africa Volume (Units) Forecast by Application , 2020 to 2035
  • Table 95: Middle East and Africa Value (USD Million) Forecast by End Use, 2020 to 2035
  • Table 96: Middle East and Africa Volume (Units) Forecast by End Use, 2020 to 2035

List of Figures

  • Figure 1: Global Value (USD Million) by Type, 2025 to 2035
  • Figure 2: Global Value (USD Million) by Refrigerant Type, 2025 to 2035
  • Figure 3: Global Value (USD Million) by Compressor Technology, 2025 to 2035
  • Figure 4: Global Value (USD Million) by Application , 2025 to 2035
  • Figure 5: Global Value (USD Million) by End Use, 2025 to 2035
  • Figure 6: Global Value (USD Million) by Region, 2025 to 2035
  • Figure 7: Global Value (USD Million) Analysis by Region, 2020 to 2035
  • Figure 8: Global Volume (Units) Analysis by Region, 2020 to 2035
  • Figure 9: Global Value Share (%) and BPS Analysis by Region, 2025 to 2035
  • Figure 10: Global Y-o-Y Growth (%) Projections by Region, 2025 to 2035
  • Figure 11: Global Value (USD Million) Analysis by Type, 2020 to 2035
  • Figure 12: Global Volume (Units) Analysis by Type, 2020 to 2035
  • Figure 13: Global Value Share (%) and BPS Analysis by Type, 2025 to 2035
  • Figure 14: Global Y-o-Y Growth (%) Projections by Type, 2025 to 2035
  • Figure 15: Global Value (USD Million) Analysis by Refrigerant Type, 2020 to 2035
  • Figure 16: Global Volume (Units) Analysis by Refrigerant Type, 2020 to 2035
  • Figure 17: Global Value Share (%) and BPS Analysis by Refrigerant Type, 2025 to 2035
  • Figure 18: Global Y-o-Y Growth (%) Projections by Refrigerant Type, 2025 to 2035
  • Figure 19: Global Value (USD Million) Analysis by Compressor Technology, 2020 to 2035
  • Figure 20: Global Volume (Units) Analysis by Compressor Technology, 2020 to 2035
  • Figure 21: Global Value Share (%) and BPS Analysis by Compressor Technology, 2025 to 2035
  • Figure 22: Global Y-o-Y Growth (%) Projections by Compressor Technology, 2025 to 2035
  • Figure 23: Global Value (USD Million) Analysis by Application , 2020 to 2035
  • Figure 24: Global Volume (Units) Analysis by Application , 2020 to 2035
  • Figure 25: Global Value Share (%) and BPS Analysis by Application , 2025 to 2035
  • Figure 26: Global Y-o-Y Growth (%) Projections by Application , 2025 to 2035
  • Figure 27: Global Value (USD Million) Analysis by End Use, 2020 to 2035
  • Figure 28: Global Volume (Units) Analysis by End Use, 2020 to 2035
  • Figure 29: Global Value Share (%) and BPS Analysis by End Use, 2025 to 2035
  • Figure 30: Global Y-o-Y Growth (%) Projections by End Use, 2025 to 2035
  • Figure 31: Global Attractiveness by Type, 2025 to 2035
  • Figure 32: Global Attractiveness by Refrigerant Type, 2025 to 2035
  • Figure 33: Global Attractiveness by Compressor Technology, 2025 to 2035
  • Figure 34: Global Attractiveness by Application , 2025 to 2035
  • Figure 35: Global Attractiveness by End Use, 2025 to 2035
  • Figure 36: Global Attractiveness by Region, 2025 to 2035
  • Figure 37: North America Value (USD Million) by Type, 2025 to 2035
  • Figure 38: North America Value (USD Million) by Refrigerant Type, 2025 to 2035
  • Figure 39: North America Value (USD Million) by Compressor Technology, 2025 to 2035
  • Figure 40: North America Value (USD Million) by Application , 2025 to 2035
  • Figure 41: North America Value (USD Million) by End Use, 2025 to 2035
  • Figure 42: North America Value (USD Million) by Country, 2025 to 2035
  • Figure 43: North America Value (USD Million) Analysis by Country, 2020 to 2035
  • Figure 44: North America Volume (Units) Analysis by Country, 2020 to 2035
  • Figure 45: North America Value Share (%) and BPS Analysis by Country, 2025 to 2035
  • Figure 46: North America Y-o-Y Growth (%) Projections by Country, 2025 to 2035
  • Figure 47: North America Value (USD Million) Analysis by Type, 2020 to 2035
  • Figure 48: North America Volume (Units) Analysis by Type, 2020 to 2035
  • Figure 49: North America Value Share (%) and BPS Analysis by Type, 2025 to 2035
  • Figure 50: North America Y-o-Y Growth (%) Projections by Type, 2025 to 2035
  • Figure 51: North America Value (USD Million) Analysis by Refrigerant Type, 2020 to 2035
  • Figure 52: North America Volume (Units) Analysis by Refrigerant Type, 2020 to 2035
  • Figure 53: North America Value Share (%) and BPS Analysis by Refrigerant Type, 2025 to 2035
  • Figure 54: North America Y-o-Y Growth (%) Projections by Refrigerant Type, 2025 to 2035
  • Figure 55: North America Value (USD Million) Analysis by Compressor Technology, 2020 to 2035
  • Figure 56: North America Volume (Units) Analysis by Compressor Technology, 2020 to 2035
  • Figure 57: North America Value Share (%) and BPS Analysis by Compressor Technology, 2025 to 2035
  • Figure 58: North America Y-o-Y Growth (%) Projections by Compressor Technology, 2025 to 2035
  • Figure 59: North America Value (USD Million) Analysis by Application , 2020 to 2035
  • Figure 60: North America Volume (Units) Analysis by Application , 2020 to 2035
  • Figure 61: North America Value Share (%) and BPS Analysis by Application , 2025 to 2035
  • Figure 62: North America Y-o-Y Growth (%) Projections by Application , 2025 to 2035
  • Figure 63: North America Value (USD Million) Analysis by End Use, 2020 to 2035
  • Figure 64: North America Volume (Units) Analysis by End Use, 2020 to 2035
  • Figure 65: North America Value Share (%) and BPS Analysis by End Use, 2025 to 2035
  • Figure 66: North America Y-o-Y Growth (%) Projections by End Use, 2025 to 2035
  • Figure 67: North America Attractiveness by Type, 2025 to 2035
  • Figure 68: North America Attractiveness by Refrigerant Type, 2025 to 2035
  • Figure 69: North America Attractiveness by Compressor Technology, 2025 to 2035
  • Figure 70: North America Attractiveness by Application , 2025 to 2035
  • Figure 71: North America Attractiveness by End Use, 2025 to 2035
  • Figure 72: North America Attractiveness by Country, 2025 to 2035
  • Figure 73: Latin America Value (USD Million) by Type, 2025 to 2035
  • Figure 74: Latin America Value (USD Million) by Refrigerant Type, 2025 to 2035
  • Figure 75: Latin America Value (USD Million) by Compressor Technology, 2025 to 2035
  • Figure 76: Latin America Value (USD Million) by Application , 2025 to 2035
  • Figure 77: Latin America Value (USD Million) by End Use, 2025 to 2035
  • Figure 78: Latin America Value (USD Million) by Country, 2025 to 2035
  • Figure 79: Latin America Value (USD Million) Analysis by Country, 2020 to 2035
  • Figure 80: Latin America Volume (Units) Analysis by Country, 2020 to 2035
  • Figure 81: Latin America Value Share (%) and BPS Analysis by Country, 2025 to 2035
  • Figure 82: Latin America Y-o-Y Growth (%) Projections by Country, 2025 to 2035
  • Figure 83: Latin America Value (USD Million) Analysis by Type, 2020 to 2035
  • Figure 84: Latin America Volume (Units) Analysis by Type, 2020 to 2035
  • Figure 85: Latin America Value Share (%) and BPS Analysis by Type, 2025 to 2035
  • Figure 86: Latin America Y-o-Y Growth (%) Projections by Type, 2025 to 2035
  • Figure 87: Latin America Value (USD Million) Analysis by Refrigerant Type, 2020 to 2035
  • Figure 88: Latin America Volume (Units) Analysis by Refrigerant Type, 2020 to 2035
  • Figure 89: Latin America Value Share (%) and BPS Analysis by Refrigerant Type, 2025 to 2035
  • Figure 90: Latin America Y-o-Y Growth (%) Projections by Refrigerant Type, 2025 to 2035
  • Figure 91: Latin America Value (USD Million) Analysis by Compressor Technology, 2020 to 2035
  • Figure 92: Latin America Volume (Units) Analysis by Compressor Technology, 2020 to 2035
  • Figure 93: Latin America Value Share (%) and BPS Analysis by Compressor Technology, 2025 to 2035
  • Figure 94: Latin America Y-o-Y Growth (%) Projections by Compressor Technology, 2025 to 2035
  • Figure 95: Latin America Value (USD Million) Analysis by Application , 2020 to 2035
  • Figure 96: Latin America Volume (Units) Analysis by Application , 2020 to 2035
  • Figure 97: Latin America Value Share (%) and BPS Analysis by Application , 2025 to 2035
  • Figure 98: Latin America Y-o-Y Growth (%) Projections by Application , 2025 to 2035
  • Figure 99: Latin America Value (USD Million) Analysis by End Use, 2020 to 2035
  • Figure 100: Latin America Volume (Units) Analysis by End Use, 2020 to 2035
  • Figure 101: Latin America Value Share (%) and BPS Analysis by End Use, 2025 to 2035
  • Figure 102: Latin America Y-o-Y Growth (%) Projections by End Use, 2025 to 2035
  • Figure 103: Latin America Attractiveness by Type, 2025 to 2035
  • Figure 104: Latin America Attractiveness by Refrigerant Type, 2025 to 2035
  • Figure 105: Latin America Attractiveness by Compressor Technology, 2025 to 2035
  • Figure 106: Latin America Attractiveness by Application , 2025 to 2035
  • Figure 107: Latin America Attractiveness by End Use, 2025 to 2035
  • Figure 108: Latin America Attractiveness by Country, 2025 to 2035
  • Figure 109: Western Europe Value (USD Million) by Type, 2025 to 2035
  • Figure 110: Western Europe Value (USD Million) by Refrigerant Type, 2025 to 2035
  • Figure 111: Western Europe Value (USD Million) by Compressor Technology, 2025 to 2035
  • Figure 112: Western Europe Value (USD Million) by Application , 2025 to 2035
  • Figure 113: Western Europe Value (USD Million) by End Use, 2025 to 2035
  • Figure 114: Western Europe Value (USD Million) by Country, 2025 to 2035
  • Figure 115: Western Europe Value (USD Million) Analysis by Country, 2020 to 2035
  • Figure 116: Western Europe Volume (Units) Analysis by Country, 2020 to 2035
  • Figure 117: Western Europe Value Share (%) and BPS Analysis by Country, 2025 to 2035
  • Figure 118: Western Europe Y-o-Y Growth (%) Projections by Country, 2025 to 2035
  • Figure 119: Western Europe Value (USD Million) Analysis by Type, 2020 to 2035
  • Figure 120: Western Europe Volume (Units) Analysis by Type, 2020 to 2035
  • Figure 121: Western Europe Value Share (%) and BPS Analysis by Type, 2025 to 2035
  • Figure 122: Western Europe Y-o-Y Growth (%) Projections by Type, 2025 to 2035
  • Figure 123: Western Europe Value (USD Million) Analysis by Refrigerant Type, 2020 to 2035
  • Figure 124: Western Europe Volume (Units) Analysis by Refrigerant Type, 2020 to 2035
  • Figure 125: Western Europe Value Share (%) and BPS Analysis by Refrigerant Type, 2025 to 2035
  • Figure 126: Western Europe Y-o-Y Growth (%) Projections by Refrigerant Type, 2025 to 2035
  • Figure 127: Western Europe Value (USD Million) Analysis by Compressor Technology, 2020 to 2035
  • Figure 128: Western Europe Volume (Units) Analysis by Compressor Technology, 2020 to 2035
  • Figure 129: Western Europe Value Share (%) and BPS Analysis by Compressor Technology, 2025 to 2035
  • Figure 130: Western Europe Y-o-Y Growth (%) Projections by Compressor Technology, 2025 to 2035
  • Figure 131: Western Europe Value (USD Million) Analysis by Application , 2020 to 2035
  • Figure 132: Western Europe Volume (Units) Analysis by Application , 2020 to 2035
  • Figure 133: Western Europe Value Share (%) and BPS Analysis by Application , 2025 to 2035
  • Figure 134: Western Europe Y-o-Y Growth (%) Projections by Application , 2025 to 2035
  • Figure 135: Western Europe Value (USD Million) Analysis by End Use, 2020 to 2035
  • Figure 136: Western Europe Volume (Units) Analysis by End Use, 2020 to 2035
  • Figure 137: Western Europe Value Share (%) and BPS Analysis by End Use, 2025 to 2035
  • Figure 138: Western Europe Y-o-Y Growth (%) Projections by End Use, 2025 to 2035
  • Figure 139: Western Europe Attractiveness by Type, 2025 to 2035
  • Figure 140: Western Europe Attractiveness by Refrigerant Type, 2025 to 2035
  • Figure 141: Western Europe Attractiveness by Compressor Technology, 2025 to 2035
  • Figure 142: Western Europe Attractiveness by Application , 2025 to 2035
  • Figure 143: Western Europe Attractiveness by End Use, 2025 to 2035
  • Figure 144: Western Europe Attractiveness by Country, 2025 to 2035
  • Figure 145: Eastern Europe Value (USD Million) by Type, 2025 to 2035
  • Figure 146: Eastern Europe Value (USD Million) by Refrigerant Type, 2025 to 2035
  • Figure 147: Eastern Europe Value (USD Million) by Compressor Technology, 2025 to 2035
  • Figure 148: Eastern Europe Value (USD Million) by Application , 2025 to 2035
  • Figure 149: Eastern Europe Value (USD Million) by End Use, 2025 to 2035
  • Figure 150: Eastern Europe Value (USD Million) by Country, 2025 to 2035
  • Figure 151: Eastern Europe Value (USD Million) Analysis by Country, 2020 to 2035
  • Figure 152: Eastern Europe Volume (Units) Analysis by Country, 2020 to 2035
  • Figure 153: Eastern Europe Value Share (%) and BPS Analysis by Country, 2025 to 2035
  • Figure 154: Eastern Europe Y-o-Y Growth (%) Projections by Country, 2025 to 2035
  • Figure 155: Eastern Europe Value (USD Million) Analysis by Type, 2020 to 2035
  • Figure 156: Eastern Europe Volume (Units) Analysis by Type, 2020 to 2035
  • Figure 157: Eastern Europe Value Share (%) and BPS Analysis by Type, 2025 to 2035
  • Figure 158: Eastern Europe Y-o-Y Growth (%) Projections by Type, 2025 to 2035
  • Figure 159: Eastern Europe Value (USD Million) Analysis by Refrigerant Type, 2020 to 2035
  • Figure 160: Eastern Europe Volume (Units) Analysis by Refrigerant Type, 2020 to 2035
  • Figure 161: Eastern Europe Value Share (%) and BPS Analysis by Refrigerant Type, 2025 to 2035
  • Figure 162: Eastern Europe Y-o-Y Growth (%) Projections by Refrigerant Type, 2025 to 2035
  • Figure 163: Eastern Europe Value (USD Million) Analysis by Compressor Technology, 2020 to 2035
  • Figure 164: Eastern Europe Volume (Units) Analysis by Compressor Technology, 2020 to 2035
  • Figure 165: Eastern Europe Value Share (%) and BPS Analysis by Compressor Technology, 2025 to 2035
  • Figure 166: Eastern Europe Y-o-Y Growth (%) Projections by Compressor Technology, 2025 to 2035
  • Figure 167: Eastern Europe Value (USD Million) Analysis by Application , 2020 to 2035
  • Figure 168: Eastern Europe Volume (Units) Analysis by Application , 2020 to 2035
  • Figure 169: Eastern Europe Value Share (%) and BPS Analysis by Application , 2025 to 2035
  • Figure 170: Eastern Europe Y-o-Y Growth (%) Projections by Application , 2025 to 2035
  • Figure 171: Eastern Europe Value (USD Million) Analysis by End Use, 2020 to 2035
  • Figure 172: Eastern Europe Volume (Units) Analysis by End Use, 2020 to 2035
  • Figure 173: Eastern Europe Value Share (%) and BPS Analysis by End Use, 2025 to 2035
  • Figure 174: Eastern Europe Y-o-Y Growth (%) Projections by End Use, 2025 to 2035
  • Figure 175: Eastern Europe Attractiveness by Type, 2025 to 2035
  • Figure 176: Eastern Europe Attractiveness by Refrigerant Type, 2025 to 2035
  • Figure 177: Eastern Europe Attractiveness by Compressor Technology, 2025 to 2035
  • Figure 178: Eastern Europe Attractiveness by Application , 2025 to 2035
  • Figure 179: Eastern Europe Attractiveness by End Use, 2025 to 2035
  • Figure 180: Eastern Europe Attractiveness by Country, 2025 to 2035
  • Figure 181: South Asia and Pacific Value (USD Million) by Type, 2025 to 2035
  • Figure 182: South Asia and Pacific Value (USD Million) by Refrigerant Type, 2025 to 2035
  • Figure 183: South Asia and Pacific Value (USD Million) by Compressor Technology, 2025 to 2035
  • Figure 184: South Asia and Pacific Value (USD Million) by Application , 2025 to 2035
  • Figure 185: South Asia and Pacific Value (USD Million) by End Use, 2025 to 2035
  • Figure 186: South Asia and Pacific Value (USD Million) by Country, 2025 to 2035
  • Figure 187: South Asia and Pacific Value (USD Million) Analysis by Country, 2020 to 2035
  • Figure 188: South Asia and Pacific Volume (Units) Analysis by Country, 2020 to 2035
  • Figure 189: South Asia and Pacific Value Share (%) and BPS Analysis by Country, 2025 to 2035
  • Figure 190: South Asia and Pacific Y-o-Y Growth (%) Projections by Country, 2025 to 2035
  • Figure 191: South Asia and Pacific Value (USD Million) Analysis by Type, 2020 to 2035
  • Figure 192: South Asia and Pacific Volume (Units) Analysis by Type, 2020 to 2035
  • Figure 193: South Asia and Pacific Value Share (%) and BPS Analysis by Type, 2025 to 2035
  • Figure 194: South Asia and Pacific Y-o-Y Growth (%) Projections by Type, 2025 to 2035
  • Figure 195: South Asia and Pacific Value (USD Million) Analysis by Refrigerant Type, 2020 to 2035
  • Figure 196: South Asia and Pacific Volume (Units) Analysis by Refrigerant Type, 2020 to 2035
  • Figure 197: South Asia and Pacific Value Share (%) and BPS Analysis by Refrigerant Type, 2025 to 2035
  • Figure 198: South Asia and Pacific Y-o-Y Growth (%) Projections by Refrigerant Type, 2025 to 2035
  • Figure 199: South Asia and Pacific Value (USD Million) Analysis by Compressor Technology, 2020 to 2035
  • Figure 200: South Asia and Pacific Volume (Units) Analysis by Compressor Technology, 2020 to 2035
  • Figure 201: South Asia and Pacific Value Share (%) and BPS Analysis by Compressor Technology, 2025 to 2035
  • Figure 202: South Asia and Pacific Y-o-Y Growth (%) Projections by Compressor Technology, 2025 to 2035
  • Figure 203: South Asia and Pacific Value (USD Million) Analysis by Application , 2020 to 2035
  • Figure 204: South Asia and Pacific Volume (Units) Analysis by Application , 2020 to 2035
  • Figure 205: South Asia and Pacific Value Share (%) and BPS Analysis by Application , 2025 to 2035
  • Figure 206: South Asia and Pacific Y-o-Y Growth (%) Projections by Application , 2025 to 2035
  • Figure 207: South Asia and Pacific Value (USD Million) Analysis by End Use, 2020 to 2035
  • Figure 208: South Asia and Pacific Volume (Units) Analysis by End Use, 2020 to 2035
  • Figure 209: South Asia and Pacific Value Share (%) and BPS Analysis by End Use, 2025 to 2035
  • Figure 210: South Asia and Pacific Y-o-Y Growth (%) Projections by End Use, 2025 to 2035
  • Figure 211: South Asia and Pacific Attractiveness by Type, 2025 to 2035
  • Figure 212: South Asia and Pacific Attractiveness by Refrigerant Type, 2025 to 2035
  • Figure 213: South Asia and Pacific Attractiveness by Compressor Technology, 2025 to 2035
  • Figure 214: South Asia and Pacific Attractiveness by Application , 2025 to 2035
  • Figure 215: South Asia and Pacific Attractiveness by End Use, 2025 to 2035
  • Figure 216: South Asia and Pacific Attractiveness by Country, 2025 to 2035
  • Figure 217: East Asia Value (USD Million) by Type, 2025 to 2035
  • Figure 218: East Asia Value (USD Million) by Refrigerant Type, 2025 to 2035
  • Figure 219: East Asia Value (USD Million) by Compressor Technology, 2025 to 2035
  • Figure 220: East Asia Value (USD Million) by Application , 2025 to 2035
  • Figure 221: East Asia Value (USD Million) by End Use, 2025 to 2035
  • Figure 222: East Asia Value (USD Million) by Country, 2025 to 2035
  • Figure 223: East Asia Value (USD Million) Analysis by Country, 2020 to 2035
  • Figure 224: East Asia Volume (Units) Analysis by Country, 2020 to 2035
  • Figure 225: East Asia Value Share (%) and BPS Analysis by Country, 2025 to 2035
  • Figure 226: East Asia Y-o-Y Growth (%) Projections by Country, 2025 to 2035
  • Figure 227: East Asia Value (USD Million) Analysis by Type, 2020 to 2035
  • Figure 228: East Asia Volume (Units) Analysis by Type, 2020 to 2035
  • Figure 229: East Asia Value Share (%) and BPS Analysis by Type, 2025 to 2035
  • Figure 230: East Asia Y-o-Y Growth (%) Projections by Type, 2025 to 2035
  • Figure 231: East Asia Value (USD Million) Analysis by Refrigerant Type, 2020 to 2035
  • Figure 232: East Asia Volume (Units) Analysis by Refrigerant Type, 2020 to 2035
  • Figure 233: East Asia Value Share (%) and BPS Analysis by Refrigerant Type, 2025 to 2035
  • Figure 234: East Asia Y-o-Y Growth (%) Projections by Refrigerant Type, 2025 to 2035
  • Figure 235: East Asia Value (USD Million) Analysis by Compressor Technology, 2020 to 2035
  • Figure 236: East Asia Volume (Units) Analysis by Compressor Technology, 2020 to 2035
  • Figure 237: East Asia Value Share (%) and BPS Analysis by Compressor Technology, 2025 to 2035
  • Figure 238: East Asia Y-o-Y Growth (%) Projections by Compressor Technology, 2025 to 2035
  • Figure 239: East Asia Value (USD Million) Analysis by Application , 2020 to 2035
  • Figure 240: East Asia Volume (Units) Analysis by Application , 2020 to 2035
  • Figure 241: East Asia Value Share (%) and BPS Analysis by Application , 2025 to 2035
  • Figure 242: East Asia Y-o-Y Growth (%) Projections by Application , 2025 to 2035
  • Figure 243: East Asia Value (USD Million) Analysis by End Use, 2020 to 2035
  • Figure 244: East Asia Volume (Units) Analysis by End Use, 2020 to 2035
  • Figure 245: East Asia Value Share (%) and BPS Analysis by End Use, 2025 to 2035
  • Figure 246: East Asia Y-o-Y Growth (%) Projections by End Use, 2025 to 2035
  • Figure 247: East Asia Attractiveness by Type, 2025 to 2035
  • Figure 248: East Asia Attractiveness by Refrigerant Type, 2025 to 2035
  • Figure 249: East Asia Attractiveness by Compressor Technology, 2025 to 2035
  • Figure 250: East Asia Attractiveness by Application , 2025 to 2035
  • Figure 251: East Asia Attractiveness by End Use, 2025 to 2035
  • Figure 252: East Asia Attractiveness by Country, 2025 to 2035
  • Figure 253: Middle East and Africa Value (USD Million) by Type, 2025 to 2035
  • Figure 254: Middle East and Africa Value (USD Million) by Refrigerant Type, 2025 to 2035
  • Figure 255: Middle East and Africa Value (USD Million) by Compressor Technology, 2025 to 2035
  • Figure 256: Middle East and Africa Value (USD Million) by Application , 2025 to 2035
  • Figure 257: Middle East and Africa Value (USD Million) by End Use, 2025 to 2035
  • Figure 258: Middle East and Africa Value (USD Million) by Country, 2025 to 2035
  • Figure 259: Middle East and Africa Value (USD Million) Analysis by Country, 2020 to 2035
  • Figure 260: Middle East and Africa Volume (Units) Analysis by Country, 2020 to 2035
  • Figure 261: Middle East and Africa Value Share (%) and BPS Analysis by Country, 2025 to 2035
  • Figure 262: Middle East and Africa Y-o-Y Growth (%) Projections by Country, 2025 to 2035
  • Figure 263: Middle East and Africa Value (USD Million) Analysis by Type, 2020 to 2035
  • Figure 264: Middle East and Africa Volume (Units) Analysis by Type, 2020 to 2035
  • Figure 265: Middle East and Africa Value Share (%) and BPS Analysis by Type, 2025 to 2035
  • Figure 266: Middle East and Africa Y-o-Y Growth (%) Projections by Type, 2025 to 2035
  • Figure 267: Middle East and Africa Value (USD Million) Analysis by Refrigerant Type, 2020 to 2035
  • Figure 268: Middle East and Africa Volume (Units) Analysis by Refrigerant Type, 2020 to 2035
  • Figure 269: Middle East and Africa Value Share (%) and BPS Analysis by Refrigerant Type, 2025 to 2035
  • Figure 270: Middle East and Africa Y-o-Y Growth (%) Projections by Refrigerant Type, 2025 to 2035
  • Figure 271: Middle East and Africa Value (USD Million) Analysis by Compressor Technology, 2020 to 2035
  • Figure 272: Middle East and Africa Volume (Units) Analysis by Compressor Technology, 2020 to 2035
  • Figure 273: Middle East and Africa Value Share (%) and BPS Analysis by Compressor Technology, 2025 to 2035
  • Figure 274: Middle East and Africa Y-o-Y Growth (%) Projections by Compressor Technology, 2025 to 2035
  • Figure 275: Middle East and Africa Value (USD Million) Analysis by Application , 2020 to 2035
  • Figure 276: Middle East and Africa Volume (Units) Analysis by Application , 2020 to 2035
  • Figure 277: Middle East and Africa Value Share (%) and BPS Analysis by Application , 2025 to 2035
  • Figure 278: Middle East and Africa Y-o-Y Growth (%) Projections by Application , 2025 to 2035
  • Figure 279: Middle East and Africa Value (USD Million) Analysis by End Use, 2020 to 2035
  • Figure 280: Middle East and Africa Volume (Units) Analysis by End Use, 2020 to 2035
  • Figure 281: Middle East and Africa Value Share (%) and BPS Analysis by End Use, 2025 to 2035
  • Figure 282: Middle East and Africa Y-o-Y Growth (%) Projections by End Use, 2025 to 2035
  • Figure 283: Middle East and Africa Attractiveness by Type, 2025 to 2035
  • Figure 284: Middle East and Africa Attractiveness by Refrigerant Type, 2025 to 2035
  • Figure 285: Middle East and Africa Attractiveness by Compressor Technology, 2025 to 2035
  • Figure 286: Middle East and Africa Attractiveness by Application , 2025 to 2035
  • Figure 287: Middle East and Africa Attractiveness by End Use, 2025 to 2035
  • Figure 288: Middle East and Africa Attractiveness by Country, 2025 to 2035

Frequently Asked Questions

How big is the condensing unit market?

The industry is estimated to be USD 45.2 billion in 2025.

What is the outlook for the condensing unit market?

By 2035, the industry is expected to grow to approximately USD 78.0 billion.

Which country shows the highest growth potential?

China is projected to witness a 6.2% CAGR, supported by rapid industrialization, urbanization, and the growth of cold chain logistics.

What product type dominates this market?

Air-cooled condensing units are the leading segment, favored for their lower installation costs and ease of maintenance.

Who are the major players in the condensing unit market?

Key players include Emerson Electric Co., Danfoss, Daikin Applied, Tecumseh Products Company, BITZER KÜHLMASCHINENBAU GMBH, Hussmann Corporation, Voltas Limited, Patton Ltd, GEA Group, Heatcraft Worldwide Refrigeration, Rivacold UK Ltd, and JINAN RETEK INDUSTRIES INC.

Explore Similar Insights

Future Market Insights

Condensing Unit Market