Cooling Essences Market Size and Share Forecast Outlook 2025 to 2035

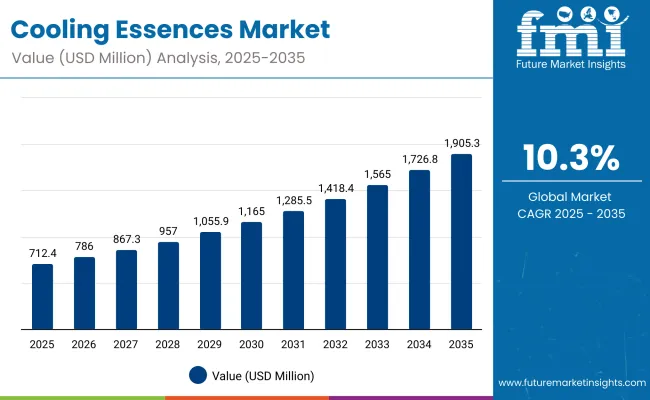
The Global Cooling Essences Market is expected to record a valuation of USD 712.4 million in 2025 and USD 1,905.3 million in 2035, with an increase of USD 1,192.9 million, which equals a growth of 193% over the decade. The overall expansion represents a CAGR of 10.3% and a near 3X increase in market size.
Quick Stats for Global Cooling Essences Market

  • Global Cooling Essences Market Value (2025): USD 712.4 million
  • Global Cooling Essences Market Forecast Value (2035): USD 1,905.3 million
  • Global Cooling Essences Market Forecast CAGR: 10.3%
  • Leading Segment in 2025: Menthol family (40%)
  • Key Growth Regions: Asia-Pacific, North America, Europe
  • Top Key Players: Symrise AG, Givaudan SA, Firmenich International SA, IFF, Takasago International Corporation, Sensient Technologies Corporation, Kerry Group plc, MANE, Zhejiang NHU Co., Ltd., Wanxiang International Limited

Cooling Essences Market

Metric Value
Global Cooling Essences Market Estimated Value in (2025E) USD 712.4 million
Global Cooling Essences Market Forecast Value in (2035F) USD 1,905.3 million
Forecast CAGR (2025 to 2035) 10.3%

During the first five-year period from 2025 to 2030, the market increases from USD 712.4 million to USD 1,165.0 million, adding USD 452.6 million, which accounts for 38% of the total decade growth. This phase records steady adoption in oral care, personal care, and confectionery, driven by the need for enhanced freshness and sensory performance. Oral care dominates this period as it caters to over 30% of industrial applications requiring long-lasting cooling intensity.

The second half from 2030 to 2035 contributes USD 740.3 million, equal to 62% of total growth, as the market jumps from USD 1,165.0 million to USD 1,905.3 million. This acceleration is powered by beverage innovation, premium skincare launches, and pharma OTC formulations adopting WS-series amides. Cooling amides (WS-3, WS-23) capture a larger share above 35% by the end of the decade. Encapsulation technologies and biotech-derived menthols add recurring demand, increasing the premium specialty systems share beyond 25% in total value.

From 2020 to 2024, the Global Cooling Essences Market grew from USD 500 million to USD 648 million, driven by menthol-dominated formulations. During this period, the competitive landscape was dominated by global F&F houses controlling nearly 60% of revenue, with leaders such as Symrise, Givaudan, and Firmenich focusing on menthol crystals and liquids for oral care and confectionery. Competitive differentiation relied on purity, sensory duration, and compliance, while advanced encapsulation systems were niche offerings. Premium biotech cooling agents had minimal traction, contributing less than 10% of the total market value.

Demand for cooling essences will expand to USD 712.4 million in 2025, and the revenue mix will shift as WS-series and biotech-derived menthols grow to over 35% share. Traditional menthol leaders face rising competition from specialty cooling innovators offering odorless, long-lasting systems and encapsulated formats. Major suppliers are pivoting to hybrid portfolios, integrating natural sourcing with sustainable biotech solutions to retain relevance. Emerging entrants specializing in microencapsulation, vegan compliance, and regulatory-advantaged formulations are gaining share. The competitive advantage is moving away from bulk menthol supply alone to innovation in delivery systems, sustainability, and recurring B2B partnerships.

Why the Global Cooling Essences Market is Growing?

Advances in cooling chemistry have improved odorless, long-lasting sensory effects, allowing for more versatile use across oral care, food & beverages, cosmetics, and OTC pharma. Menthol remains popular due to its familiarity and strong consumer recognition, while WS-series amides are gaining traction for their low odor and enhanced duration. Demand from oral hygiene, confectionery, and beverages is driving widespread adoption.

Expansion of microencapsulation technologies and fermentation-derived menthols has fueled growth, aligning with clean-label, sustainable, and premium product trends. Segment growth is expected to be led by menthol family ingredients, oral care applications, and synthetic sources due to scalability and cost efficiency, while biotech-derived formats represent the fastest-growing sub-segment.

Segmental Analysis

The market is segmented by chemistry, origin, form & delivery system, sensory performance, application, certification & compliance, packaging, end-user type, sales channel, price tier, and region. Chemistry includes menthol family, menthyl esters, WS-series cooling amides, and other blends, highlighting the core actives driving adoption. Origin classification covers natural mint-derived, nature-identical, synthetic, and biotech-derived essences to cater to diverse sourcing needs. Based on form & delivery system, the segmentation includes solid crystals, liquid solutions, emulsions, and encapsulated beadlets or powders.

In terms of sensory performance, categories encompass fast onset, delayed onset, long-lasting cooling, intensity levels, and aroma profiles. Applications include oral care, personal care & cosmetics, food & beverage, pharmaceuticals & OTC, household & fabric, and pet care, reflecting multi-industry utilization. Certification & compliance covers IFRA, FEMA GRAS, REACH, China GB, India FSSAI, Halal, Kosher, Non-GMO, and Vegan requirements. Packaging is classified into 1-5 kg packs, 5-25 kg packs, and 25-200 kg drums/IBCs.

End-user types include flavor & fragrance houses, ingredient premix blenders, contract manufacturers (OEM/ODM), and brand owners. Sales channels include direct supply, authorized distributors, and online B2B platforms. Price tiers are divided into value, standard, and premium/specialty long-lasting systems. Regionally, the scope spans North America, Latin America, Europe, East Asia, South Asia & Pacific, and the Middle East & Africa.
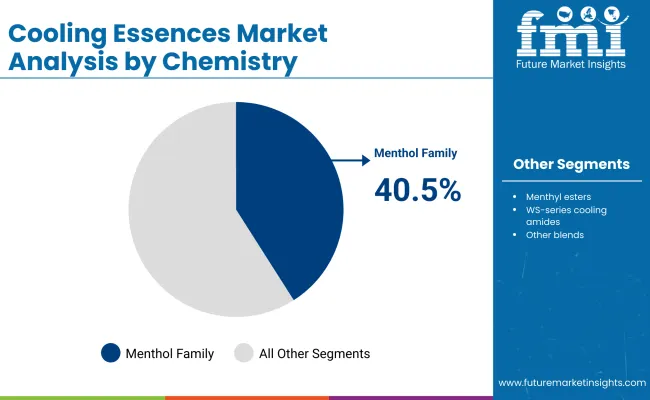
Insights into the Chemistry Segment with Menthol Family Leading in Market Share

Cooling Essences Market Bychemitry

Chemistry Segment Market Value Share, 2025
Menthol Family 40.5%
Others 59.5%

The menthol family segment is projected to contribute 40.5% of the Global Cooling Essences Market revenue in 2025, maintaining its lead as the dominant chemistry category. This is driven by the widespread use of menthol in oral care, confectionery, and pharmaceutical formulations where strong familiarity and consumer acceptance support its dominance. Menthol’s ability to deliver immediate freshness and its natural association with cooling make it indispensable in toothpaste, chewing gum, and topical analgesics. The segment’s growth is also supported by scalable supply from both synthetic and natural mint sources, ensuring stable pricing and consistent availability. While WS-series amides and advanced blends are growing quickly, menthol remains the backbone ingredient for most mainstream applications.
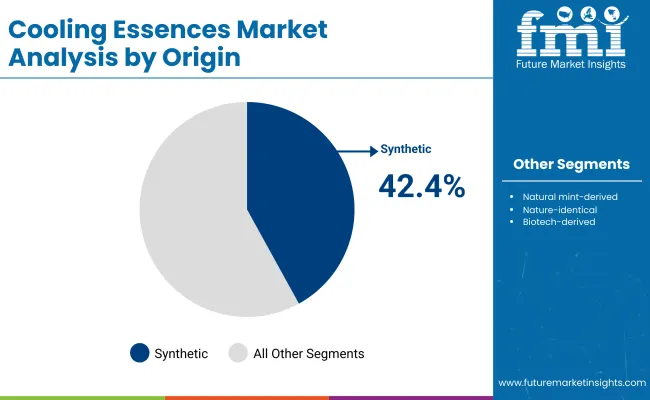
Insights into the Origin Segment with Synthetic Leading in Market Share

Cooling Essences Market By Origin

Origin Segment Market Value Share, 2025
Synthetic 42.4%
Others 57.6%

The synthetic origin segment is expected to account for 42.4% of the Global Cooling Essences Market in 2025, making it the leading origin type. Its dominance is attributed to cost efficiency, high purity levels, and scalable production, which are critical for large-volume buyers in oral care and beverage industries. Synthetic menthol and WS-series agents are widely preferred by manufacturers seeking consistent performance and global regulatory compliance. The segment also benefits from the ability to offer odorless and tailored cooling profiles that natural sources cannot always guarantee. Although biotech-derived and natural mint-based formats are gaining traction, especially in premium and clean-label categories, synthetics continue to lead due to their balance of affordability, reliability, and supply security.
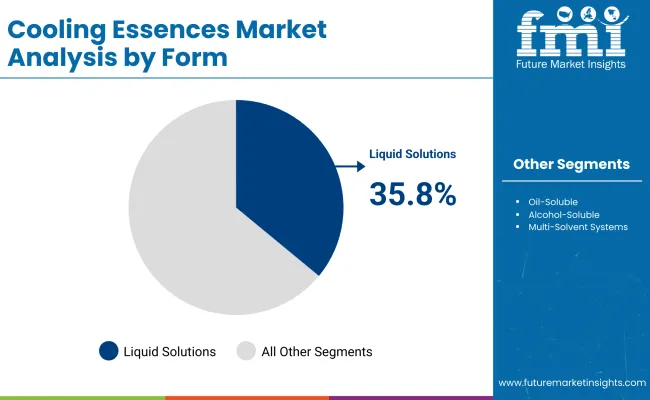
Insights into the Form & Delivery System Segment with Liquid Solutions Dominating the Demand

Cooling Essences Market By Form

Form & Delivery System Segment Market Value Share, 2025
Liquid Solutions 35.8%
Others 64.2%

The liquid solutions segment is forecasted to hold 35.8% of the Global Cooling Essences Market share in 2025, emerging as the most widely used form. Liquids dominate because they are easy to dose, highly versatile, and compatible with multiple applications ranging from toothpaste and mouthwash to beverages and skincare formulations. Their adaptability in blending, superior solubility in both oil- and water-based systems, and established usage in oral care make them the preferred choice for formulators. Additionally, liquid formats allow for precise concentration adjustments, which is essential for tailoring cooling intensity in different product categories. While encapsulated beadlets and powder forms are expanding rapidly due to demand for controlled release and stability, liquid solutions remain the most dominant delivery system due to their simplicity, cost-effectiveness, and broad formulation flexibility.

What are the Drivers, Restraints, and Key Trends of the Global Cooling Essences Market?

Drivers

Rising Demand in Oral Care and Beverages

The strongest driver for the cooling essences market is the accelerating demand from oral care and beverage industries, which together account for more than half of global consumption. In oral care, cooling actives like menthol and WS-series amides are indispensable for toothpaste, mouthwash, and gum formulations, where consumer perception of freshness directly impacts brand loyalty. Similarly, the beverage sector is witnessing innovation in functional waters, energy drinks, and dairy-based products, where cooling sensations enhance refreshment and create unique consumption experiences. The trend is further amplified in Asia-Pacific, where rapid urbanization and increasing disposable incomes are boosting demand for oral hygiene and premium beverages, thereby expanding opportunities for cooling essence suppliers.

Growth of Premium and Sustainable Ingredients

Another key growth driver is the shift toward sustainable, clean-label, and premium product positioning. Consumers, especially in Europe and North America, increasingly prefer biotech-derived menthols and encapsulated cooling systems that offer odorless, long-lasting effects with a natural or environmentally friendly claim. Biotech fermentation routes not only address environmental concerns tied to synthetic processes but also mitigate raw material volatility associated with mint crop yields. Premium positioning allows suppliers to capture higher margins by offering customized cooling profiles, microencapsulation technologies, and regulatory-compliant formulations. This shift from commodity menthol to specialty cooling solutions ensures higher adoption across personal care, skincare, and high-end food & beverage categories.

Restraints

Volatility in Raw Material Prices and Synthetic Dependency

A major restraint is the price fluctuation in raw materials used for both synthetic and natural cooling essences. For natural menthol, variations in mint crop yields, weather conditions, and regional supply chain disruptions can cause unpredictable cost spikes. Synthetic menthol and amides, though more stable, are dependent on petrochemical inputs, which expose the industry to crude oil price volatility and geopolitical risks. These fluctuations challenge both ingredient manufacturers and brand owners in managing consistent pricing strategies, often limiting adoption in cost-sensitive FMCG categories and emerging markets.

Stringent Regulatory Frameworks Across Regions

The global cooling essences market faces regulatory complexities that can restrict market growth. Usage levels and compliance vary significantly across geographies: FEMA GRAS in the USA, REACH regulations in Europe, and China GB standards all impose different maximum permissible levels. Non-compliance can result in product recalls, fines, or restricted entry into lucrative markets. Additionally, categories such as tobacco alternatives, vaping liquids, and functional beverages face heightened scrutiny, with certain cooling actives under evaluation for safety concerns. These regulatory hurdles increase formulation complexity, raise compliance costs, and slow the speed of innovation.

Key Trends

Rise of WS-Series Amides in Place of Traditional Menthol

A major trend reshaping the market is the rapid adoption of WS-series cooling amides (WS-3, WS-23, WS-5, WS-12) as alternatives to menthol. These actives offer odorless cooling, longer-lasting effects, and better stability under heat and pH fluctuations, which makes them attractive in cosmetics, beverages, and pharma applications. The shift toward WS-series is particularly evident in premium skincare, where menthol’s strong minty odor can be undesirable, and in beverages, where amides deliver cooling without altering flavor profiles. This trend is expected to accelerate as formulators seek differentiated sensory experiences beyond conventional menthol.

Expansion of Encapsulation and Controlled-Release Technologies

Another critical trend is the integration of advanced encapsulation and delivery systems for cooling essences. Microencapsulation, beadlets, and liposomal carriers are enabling time-release cooling, improved stability, and reduced volatility, which enhance product performance in oral care and cosmetics. Controlled-release systems are particularly popular in chewing gum, lozenges, and topical skincare, where a sustained cooling effect increases consumer satisfaction. Encapsulation also aligns with clean-label and cost-efficiency strategies, as it allows manufacturers to use smaller amounts of active while maintaining strong sensory impact, thereby improving margins. This trend is expected to dominate R&D pipelines and product launches over the next decade.
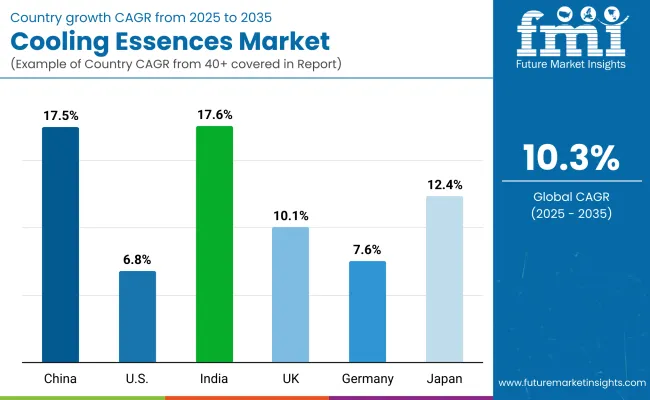
Analysis of Global Cooling Essences Market By Key Countries

Country Wise Cooling Essences Market

Countries CAGR (2025 to 2035)
China 17.5%
USA 6.8%
India 17.6%
UK 10.1%
Germany 7.6%
Japan 12.4%

Between 2025 and 2035, India (17.6%) and China (17.5%) are expected to record the fastest CAGR in the Global Cooling Essences Market. Rapid population growth, rising disposable incomes, and increasing consumption of oral care and functional beverages are driving demand in these two countries. Both markets are also witnessing a surge in premium personal care and pharmaceutical applications, where WS-series cooling amides and biotech-derived menthol are gaining traction. Asia’s strong manufacturing base and favorable regulatory pathways further support large-scale adoption, positioning the region as the global growth engine.

In contrast, mature markets such as the USA(6.8%), Germany (7.6%), and the UK (10.1%) show steady but slower expansion. Growth here is largely tied to premiumization, sustainability trends, and product innovation in cosmetics, confectionery, and OTC pharmaceuticals. Japan (12.4%) sits between the two clusters, driven by strong consumer demand for high-performance skincare and oral care products that incorporate encapsulated cooling systems. Overall, the disparity highlights how emerging Asian economies are expanding rapidly, while Western markets contribute steady, innovation-led growth.
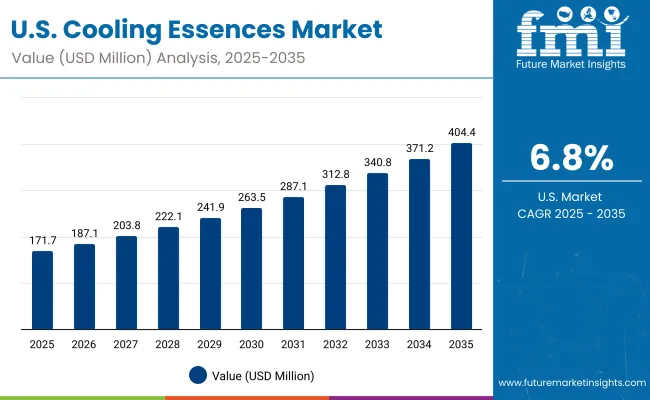
Sales Outlook for Cooling Essences in the United States

Usa Cooling Essences Market

Year USA Cooling Essences Market (USD Million)
2025 171.8
2026 187.1
2027 203.9
2028 222.1
2029 241.9
2030 263.6
2031 287.2
2032 312.8
2033 340.8
2034 371.3
2035 404.5

The Cooling Essences Market in the United States is projected to grow at a CAGR of 6.8%, supported by consistent demand across oral care, confectionery, and beverages. Toothpaste and mouthwash continue to dominate usage, while chewing gum and candies add stable consumption volumes. Functional beverages, particularly flavored waters and sports drinks, are expanding the role of cooling essences in F&B categories.

Premium skincare and OTC pharma applications are also introducing odorless WS-series cooling amides to differentiate formulations. Growth is further reinforced by a preference for synthetic menthol and consistent WS-series supply, which ensures regulatory compliance and stability.

  • Oral care remains the dominant category, led by toothpaste and rinses.
  • Functional beverages and sports drinks are emerging as new growth drivers.
  • Premium skincare is integrating odorless WS-series cooling actives for differentiation.

Growth and Expansion Outlook for Cooling Essences in the United Kingdom

The Cooling Essences Market in the United Kingdom is expected to grow at a CAGR of 10.1%, supported by applications in oral care, confectionery, and high-end cosmetics. Chewing gum and mints drive steady demand, while confectionery companies are experimenting with encapsulated cooling agents for differentiated taste experiences. Premium skincare brands are adopting menthol derivatives and WS-series amides for long-lasting, odorless cooling sensations. Regulatory emphasis on safety and clean-label demand is also pushing companies toward biotech-derived and sustainable menthol alternatives.

  • Confectionery brands are adopting encapsulated cooling formats for product innovation.
  • Oral care continues to anchor demand, particularly in toothpaste.
  • Sustainable and biotech menthols are gaining traction in cosmetics and skincare.

Growth and Expansion Outlook for Cooling Essences in India

India is witnessing rapid growth in the Cooling Essences Market, which is forecast to expand at a CAGR of 17.6% through 2035. Demand is led by oral care, with strong growth in toothpaste, mouthwash, and affordable gum products across both urban and rural areas. Rising disposable incomes and greater hygiene awareness are driving premium oral care launches, while confectionery and beverages add incremental demand. Synthetic menthol dominates mass-market categories due to affordability, while biotech and sustainable cooling essences are being introduced in premium FMCG products.

  • Mass-market oral care brands are driving adoption through affordable toothpaste.
  • Synthetic menthol leads volume growth due to cost competitiveness.
  • Premium FMCG brands are integrating biotech-derived cooling essences.

Sales Outlook for Cooling Essences in China

The Cooling Essences Market in China is expected to grow at a CAGR of 17.5%, the highest among major economies. This momentum is powered by high oral care penetration, functional beverage innovation, and expanding personal care adoption. Domestic brands are introducing odorless WS-series agents into cosmetics and skincare, aligning with local consumer preferences. Confectionery remains another strong growth pillar, with gums and mints increasingly incorporating long-lasting cooling agents. China also benefits from local synthetic menthol production and competitive pricing, which makes cooling essences more accessible across FMCG categories.
  • Oral care and functional beverages are leading adoption in China.
  • Cosmetics and skincare are increasingly using WS-series amides.
  • Local production of synthetic menthol supports cost efficiency and wider adoption.

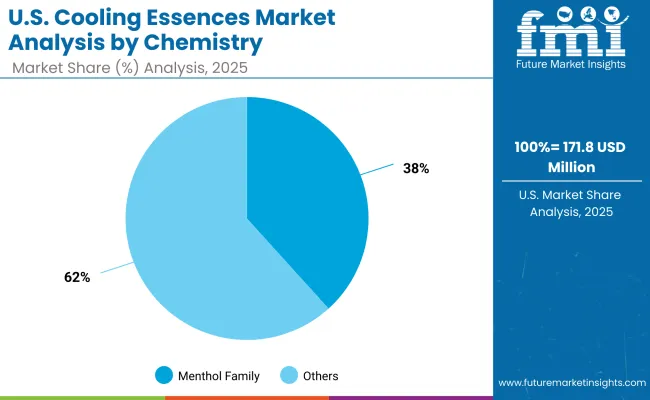
Opportunity Analysis of USA Cooling Essences Market

Usa Cooling Essences Market By Chemistry

Chemistry Segment Market Value Share, 2025
Menthol Family 38.3%
Others 61.7%

The Cooling Essences Market in the United States is valued at USD 171.8 million in 2025, with menthol family leading at 38.3%. The dominance of menthol is linked to its strong role in oral care and confectionery, where consumer familiarity with the classic cooling profile drives large-scale adoption. Toothpaste, chewing gum, and mouthwash continue to rely heavily on menthol’s immediate freshness and recognizable sensory signature. While WS-series cooling agents are expanding, menthol’s broad availability and regulatory acceptance make it the core chemistry for mainstream applications.

This advantage positions menthol as a reliable backbone for consistent performance across oral hygiene and confectionery. Other chemistries, including WS-series amides and menthyl esters, are rising in demand, particularly in premium skincare and functional beverages, but they remain complementary. As innovation accelerates, menthol’s ability to blend with advanced delivery systems will keep it integral to the USA cooling essences market.
  • Market size for the USA in 2025 is USD 171.8 million
  • Global market share is approximately 24.1%
  • Menthol family leads at 38.3% due to dominant use in oral care and confectionery

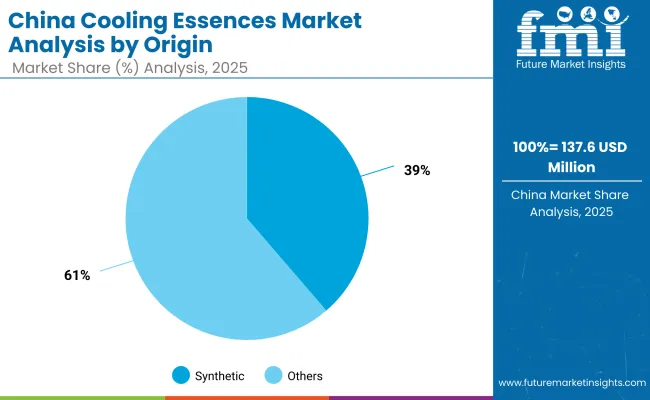
Opportunity Analysis of China Cooling Essences Market

China Cooling Essences Market By Origin

Origin Segment Market Value Share, 2025
Synthetic 38.7%
Others 61.3%

The Cooling Essences Market in China is valued at USD 137.6 million in 2025, with synthetic sources leading at 38.7%. The dominance of synthetics reflects cost efficiency, large-scale availability, and consistency, which are crucial for high-volume FMCG categories such as toothpaste, chewing gum, and beverages. Local manufacturers have strengthened capacity in synthetic menthol and WS-series actives, making them accessible across both premium and mass-market products.

This advantage positions synthetic cooling essences as the primary growth driver for affordable oral care and functional beverage launches in China. Other origins, including natural mint and biotech-derived menthol, are expanding as clean-label demand rises, but synthetics continue to set the pace due to price competitiveness and stable supply. As China advances in functional foods, cosmetics, and OTC pharmaceuticals, synthetic cooling essences will remain critical for scaling adoption.
  • Market size for China in 2025 is USD 137.6 million
  • Global market share is approximately 19.3%
  • Synthetic origin leads at 38.7% due to cost competitiveness and scalable supply

Competitive Landscape of Global Cooling Essences Market

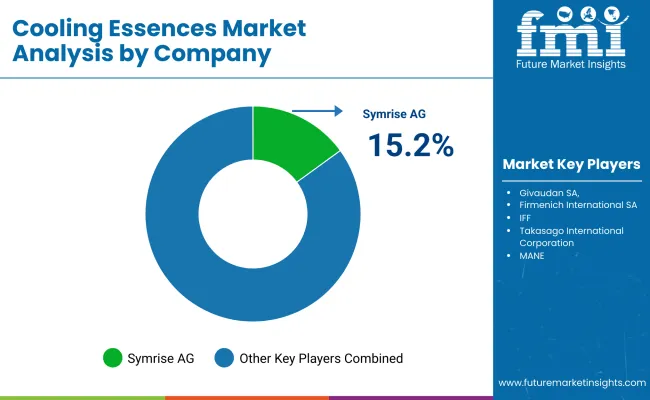
Cooling Essences Market By Company

Company Global Value Share 2025
Symrise AG 15.2%
Others 84.8%

The Global Cooling Essences Market is moderately fragmented, with multinational flavor & fragrance houses, regional ingredient suppliers, and specialty innovators competing across oral care, beverages, personal care, and pharmaceuticals. Global leaders such as Symrise AG, Givaudan SA, Firmenich International SA, and IFF command significant share through their extensive portfolios of menthol, WS-series amides, and advanced delivery systems. Their strategies increasingly emphasize sustainable sourcing, biotech-derived menthol, and encapsulation technologies to align with clean-label trends and premium product positioning.

Established mid-sized players, including Takasago International Corporation, Sensient Technologies, Kerry Group, and MANE, are actively expanding their presence in fast-growing Asia-Pacific markets by offering tailored cooling blends and cost-effective synthetic formats. These companies are also leveraging regional distribution networks and partnerships with FMCG manufacturers to strengthen market penetration. Specialty providers, such as Zhejiang NHU Co., Ltd. and Wanxiang International Limited, focus on high-volume synthetic menthol production and competitive pricing, making them critical suppliers for mass-market oral care and confectionery.

Their strength lies in scalability and affordability, which positions them as key contributors to emerging market growth. Competitive differentiation is shifting away from commodity menthol supply toward value-added innovation, including odorless WS-series actives, controlled-release encapsulation, and regulatory-compliant clean-label solutions. Players investing in biotech fermentation, AI-driven formulation design, and sustainability certifications are expected to consolidate stronger positions in the decade ahead.

Key Developments for Global Cooling Essences Market

  • On March 12, 2024, Symrise AG celebrated 50 years of synthetic menthol production, highlighting its transition to more sustainable and energy-efficient manufacturing processes. The company introduced upgraded Symcool® solutions designed for odorless and long-lasting cooling in oral care and cosmetics.
  • On September 5, 2024, Givaudan and Privi Speciality Chemicals launched a joint venture facility in Mahad, India, expanding regional production of fragrance and cooling ingredients to meet growing demand across Asia-Pacific.

Scope of the Report

Item Value
Quantitative Units USD 712.4 million
Chemistry Menthol family, Menthyl esters, WS-series cooling amides, and Other blends
Origin Natural mint-derived, Nature-identical, Synthetic, and Biotech-derived
Technology Solid crystals, Liquid solutions, Emulsions, and Encapsulated beadlets /powders
Form & Delivery System Oil-Soluble, Water-Soluble, Alcohol-Soluble, Multi-Solvent Systems
Solubility & Carrier Automotive, Aerospace & defense, Consumer electronics, Healthcare, Oil & gas, Energy and power, and Others
Regions Covered North America, Europe, Asia-Pacific, Latin America, Middle East & Africa
Country Covered United States, Canada, Germany, France, United Kingdom, China, Japan, India, Brazil, South Africa
Key Companies Profiled Symrise AG, Givaudan SA, Firmenich International SA, IFF, Takasago International Corporation, Sensient Technologies Corporation, Kerry Group plc, MANE, Zhejiang NHU Co., Ltd., Wanxiang International Limited
Additional Attributes Dollar sales by chemistry and application, adoption trends in oral care and functional beverages, rising demand for odorless WS-series cooling agents, sector-specific growth in pharmaceuticals and personal care, regulatory compliance segmentation (FEMA/IFRA/REACH/GB/FSSAI), integration with encapsulation and controlled-release technologies, regional trends influenced by clean-label and premiumization, and innovations in biotech-derived menthol and sustainable cooling systems

Key Segments

By Chemistry:

  • Menthol Family
  • Menthyl Esters
  • Cooling Amides (WS-series)
  • Other Cooling Actives & Blends

By Origin:

  • Natural Mint Derived
  • Nature-Identical
  • Synthetic
  • Fermentation / Biotech Derived

By Form & Delivery System:

  • Solid Crystals
  • Liquid Solutions
  • Emulsions & Dispersions
  • Microencapsulated Beadlets & Powders

By Solubility & Carrier:

  • Oil-Soluble
  • Water-Soluble
  • Alcohol-Soluble
  • Multi-Solvent Systems

By Region:

  • North America
  • Latin America
  • Europe
  • East Asia
  • South Asia & Pacific
  • Middle East and Africa

Table of Content

  1. Executive Summary
    • Global Market Outlook
    • Demand-side Trends
    • Supply-side Trends
    • Technology Roadmap Analysis
    • Analysis and Recommendations
  2. Market Overview
    • Market Coverage / Taxonomy
    • Market Definition / Scope / Limitations
  3. Market Background
    • Market Dynamics
      • Drivers
      • Restraints
      • Opportunity
      • Trends
    • Scenario Forecast
      • Demand in Optimistic Scenario
      • Demand in Likely Scenario
      • Demand in Conservative Scenario
    • Opportunity Map Analysis
    • Product Life Cycle Analysis
    • Supply Chain Analysis
      • Supply Side Participants and their Roles
        • Producers
        • Mid-Level Participants (Traders/ Agents/ Brokers)
        • Wholesalers and Distributors
      • Value Added and Value Created at Node in the Supply Chain
      • List of Raw Material Suppliers
      • List of Existing and Potential Buyer’s
    • Investment Feasibility Matrix
    • Value Chain Analysis
      • Profit Margin Analysis
      • Wholesalers and Distributors
      • Retailers
    • PESTLE and Porter’s Analysis
    • Regulatory Landscape
      • By Key Regions
      • By Key Countries
    • Regional Parent Market Outlook
    • Production and Consumption Statistics
    • Import and Export Statistics
  4. Global Market Analysis 2020 to 2024 and Forecast, 2025 to 2035
    • Historical Market Size Value (USD Million) & Volume (Units) Analysis, 2020 to 2024
    • Current and Future Market Size Value (USD Million) & Volume (Units) Projections, 2025 to 2035
      • Y-o-Y Growth Trend Analysis
      • Absolute $ Opportunity Analysis
  5. Global Market Analysis 2020 to 2024 and Forecast 2025 to 2035, By Chemistry
    • Introduction / Key Findings
    • Historical Market Size Value (USD Million) & Volume (Units) Analysis By Chemistry, 2020 to 2024
    • Current and Future Market Size Value (USD Million) & Volume (Units) Analysis and Forecast By Chemistry, 2025 to 2035
      • Menthol Family
      • Menthyl Esters
      • Cooling Amides (WS-series)
      • Other Cooling Actives & Blends
    • Y-o-Y Growth Trend Analysis By Chemistry, 2020 to 2024
    • Absolute $ Opportunity Analysis By Chemistry, 2025 to 2035
  6. Global Market Analysis 2020 to 2024 and Forecast 2025 to 2035, By Origin
    • Introduction / Key Findings
    • Historical Market Size Value (USD Million) & Volume (Units) Analysis By Origin, 2020 to 2024
    • Current and Future Market Size Value (USD Million) & Volume (Units) Analysis and Forecast By Origin, 2025 to 2035
      • Natural Mint Derived
      • Nature-Identical
      • Synthetic
      • Fermentation / Biotech Derived
    • Y-o-Y Growth Trend Analysis By Origin, 2020 to 2024
    • Absolute $ Opportunity Analysis By Origin, 2025 to 2035
  7. Global Market Analysis 2020 to 2024 and Forecast 2025 to 2035, By Form & Delivery System
    • Introduction / Key Findings
    • Historical Market Size Value (USD Million) & Volume (Units) Analysis By Form & Delivery System, 2020 to 2024
    • Current and Future Market Size Value (USD Million) & Volume (Units) Analysis and Forecast By Form & Delivery System, 2025 to 2035
      • Solid Crystals
      • Liquid Solutions
      • Emulsions & Dispersions
      • Microencapsulated Beadlets & Powders
    • Y-o-Y Growth Trend Analysis By Form & Delivery System, 2020 to 2024
    • Absolute $ Opportunity Analysis By Form & Delivery System, 2025 to 2035
  8. Global Market Analysis 2020 to 2024 and Forecast 2025 to 2035, By Solubility & Carrier
    • Introduction / Key Findings
    • Historical Market Size Value (USD Million) & Volume (Units) Analysis By Solubility & Carrier, 2020 to 2024
    • Current and Future Market Size Value (USD Million) & Volume (Units) Analysis and Forecast By Solubility & Carrier, 2025 to 2035
      • Oil-Soluble
      • Water-Soluble
      • Alcohol-Soluble
      • Multi-Solvent Systems
    • Y-o-Y Growth Trend Analysis By Solubility & Carrier, 2020 to 2024
    • Absolute $ Opportunity Analysis By Solubility & Carrier, 2025 to 2035
  9. Global Market Analysis 2020 to 2024 and Forecast 2025 to 2035, By Region
    • Introduction
    • Historical Market Size Value (USD Million) & Volume (Units) Analysis By Region, 2020 to 2024
    • Current Market Size Value (USD Million) & Volume (Units) Analysis and Forecast By Region, 2025 to 2035
      • North America
      • Latin America
      • Europe
      • East Asia
      • South Asia & Pacific
      • Middle East and Africa
    • Market Attractiveness Analysis By Region
  10. North America Market Analysis 2020 to 2024 and Forecast 2025 to 2035, By Country
    • Historical Market Size Value (USD Million) & Volume (Units) Trend Analysis By Market Taxonomy, 2020 to 2024
    • Market Size Value (USD Million) & Volume (Units) Forecast By Market Taxonomy, 2025 to 2035
      • By Country
        • USA
        • Canada
      • By Chemistry
      • By Origin
      • By Form & Delivery System
      • By Solubility & Carrier
    • Market Attractiveness Analysis
      • By Country
      • By Chemistry
      • By Origin
      • By Form & Delivery System
      • By Solubility & Carrier
    • Key Takeaways
  11. Latin America Market Analysis 2020 to 2024 and Forecast 2025 to 2035, By Country
    • Historical Market Size Value (USD Million) & Volume (Units) Trend Analysis By Market Taxonomy, 2020 to 2024
    • Market Size Value (USD Million) & Volume (Units) Forecast By Market Taxonomy, 2025 to 2035
      • By Country
        • Brazil
        • Mexico
        • Colombia
        • Rest of Latin America
      • By Chemistry
      • By Origin
      • By Form & Delivery System
      • By Solubility & Carrier
    • Market Attractiveness Analysis
      • By Country
      • By Chemistry
      • By Origin
      • By Form & Delivery System
      • By Solubility & Carrier
    • Key Takeaways
  12. Europe Market Analysis 2020 to 2024 and Forecast 2025 to 2035, By Country
    • Historical Market Size Value (USD Million) & Volume (Units) Trend Analysis By Market Taxonomy, 2020 to 2024
    • Market Size Value (USD Million) & Volume (Units) Forecast By Market Taxonomy, 2025 to 2035
      • By Country
        • Germany
        • UK
        • France
        • Italy
        • Spain
        • Belgium
        • Netherlands
        • Nordic
        • Switzerland
        • Russia
        • Poland
        • Rest of Europe
      • By Chemistry
      • By Origin
      • By Form & Delivery System
      • By Solubility & Carrier
    • Market Attractiveness Analysis
      • By Country
      • By Chemistry
      • By Origin
      • By Form & Delivery System
      • By Solubility & Carrier
    • Key Takeaways
  13. East Asia Market Analysis 2020 to 2024 and Forecast 2025 to 2035, By Country
    • Historical Market Size Value (USD Million) & Volume (Units) Trend Analysis By Market Taxonomy, 2020 to 2024
    • Market Size Value (USD Million) & Volume (Units) Forecast By Market Taxonomy, 2025 to 2035
      • By Country
        • China
        • Japan
        • South Korea
      • By Chemistry
      • By Origin
      • By Form & Delivery System
      • By Solubility & Carrier
    • Market Attractiveness Analysis
      • By Country
      • By Chemistry
      • By Origin
      • By Form & Delivery System
      • By Solubility & Carrier
    • Key Takeaways
  14. South Asia & Pacific Market Analysis 2020 to 2024 and Forecast 2025 to 2035, By Country
    • Historical Market Size Value (USD Million) & Volume (Units) Trend Analysis By Market Taxonomy, 2020 to 2024
    • Market Size Value (USD Million) & Volume (Units) Forecast By Market Taxonomy, 2025 to 2035
      • By Country
        • India
        • Thailand
        • Malaysia
        • Indonesia
        • Singapore
        • Vietnam
        • Australia
        • New Zealand
        • Rest of South Asia
      • By Chemistry
      • By Origin
      • By Form & Delivery System
      • By Solubility & Carrier
    • Market Attractiveness Analysis
      • By Country
      • By Chemistry
      • By Origin
      • By Form & Delivery System
      • By Solubility & Carrier
    • Key Takeaways
  15. Middle East and Africa Market Analysis 2020 to 2024 and Forecast 2025 to 2035, By Country
    • Historical Market Size Value (USD Million) & Volume (Units) Trend Analysis By Market Taxonomy, 2020 to 2024
    • Market Size Value (USD Million) & Volume (Units) Forecast By Market Taxonomy, 2025 to 2035
      • By Country
        • Turkey
        • UAE
        • Saudi Arabia
        • Israel
        • Other GCC Countries
        • North Africa
        • South Africa
      • By Chemistry
      • By Origin
      • By Form & Delivery System
      • By Solubility & Carrier
    • Market Attractiveness Analysis
      • By Country
      • By Chemistry
      • By Origin
      • By Form & Delivery System
      • By Solubility & Carrier
    • Key Takeaways
  16. Key Countries Market Analysis
    • USA
      • Pricing Analysis
      • Market Share Analysis, 2024
        • By Chemistry
        • By Origin
        • By Form & Delivery System
        • By Solubility & Carrier
    • Canada
      • Pricing Analysis
      • Market Share Analysis, 2024
        • By Chemistry
        • By Origin
        • By Form & Delivery System
        • By Solubility & Carrier
    • Brazil
      • Pricing Analysis
      • Market Share Analysis, 2024
        • By Chemistry
        • By Origin
        • By Form & Delivery System
        • By Solubility & Carrier
    • Mexico
      • Pricing Analysis
      • Market Share Analysis, 2024
        • By Chemistry
        • By Origin
        • By Form & Delivery System
        • By Solubility & Carrier
    • Colombia
      • Pricing Analysis
      • Market Share Analysis, 2024
        • By Chemistry
        • By Origin
        • By Form & Delivery System
        • By Solubility & Carrier
    • Germany
      • Pricing Analysis
      • Market Share Analysis, 2024
        • By Chemistry
        • By Origin
        • By Form & Delivery System
        • By Solubility & Carrier
    • UK
      • Pricing Analysis
      • Market Share Analysis, 2024
        • By Chemistry
        • By Origin
        • By Form & Delivery System
        • By Solubility & Carrier
    • France
      • Pricing Analysis
      • Market Share Analysis, 2024
        • By Chemistry
        • By Origin
        • By Form & Delivery System
        • By Solubility & Carrier
    • Italy
      • Pricing Analysis
      • Market Share Analysis, 2024
        • By Chemistry
        • By Origin
        • By Form & Delivery System
        • By Solubility & Carrier
    • Spain
      • Pricing Analysis
      • Market Share Analysis, 2024
        • By Chemistry
        • By Origin
        • By Form & Delivery System
        • By Solubility & Carrier
    • Belgium
      • Pricing Analysis
      • Market Share Analysis, 2024
        • By Chemistry
        • By Origin
        • By Form & Delivery System
        • By Solubility & Carrier
    • Netherlands
      • Pricing Analysis
      • Market Share Analysis, 2024
        • By Chemistry
        • By Origin
        • By Form & Delivery System
        • By Solubility & Carrier
    • Nordic
      • Pricing Analysis
      • Market Share Analysis, 2024
        • By Chemistry
        • By Origin
        • By Form & Delivery System
        • By Solubility & Carrier
    • Switzerland
      • Pricing Analysis
      • Market Share Analysis, 2024
        • By Chemistry
        • By Origin
        • By Form & Delivery System
        • By Solubility & Carrier
    • Russia
      • Pricing Analysis
      • Market Share Analysis, 2024
        • By Chemistry
        • By Origin
        • By Form & Delivery System
        • By Solubility & Carrier
    • Poland
      • Pricing Analysis
      • Market Share Analysis, 2024
        • By Chemistry
        • By Origin
        • By Form & Delivery System
        • By Solubility & Carrier
    • China
      • Pricing Analysis
      • Market Share Analysis, 2024
        • By Chemistry
        • By Origin
        • By Form & Delivery System
        • By Solubility & Carrier
    • Japan
      • Pricing Analysis
      • Market Share Analysis, 2024
        • By Chemistry
        • By Origin
        • By Form & Delivery System
        • By Solubility & Carrier
    • South Korea
      • Pricing Analysis
      • Market Share Analysis, 2024
        • By Chemistry
        • By Origin
        • By Form & Delivery System
        • By Solubility & Carrier
    • India
      • Pricing Analysis
      • Market Share Analysis, 2024
        • By Chemistry
        • By Origin
        • By Form & Delivery System
        • By Solubility & Carrier
    • Thailand
      • Pricing Analysis
      • Market Share Analysis, 2024
        • By Chemistry
        • By Origin
        • By Form & Delivery System
        • By Solubility & Carrier
    • Indonesia
      • Pricing Analysis
      • Market Share Analysis, 2024
        • By Chemistry
        • By Origin
        • By Form & Delivery System
        • By Solubility & Carrier
    • Australia
      • Pricing Analysis
      • Market Share Analysis, 2024
        • By Chemistry
        • By Origin
        • By Form & Delivery System
        • By Solubility & Carrier
    • New Zealand
      • Pricing Analysis
      • Market Share Analysis, 2024
        • By Chemistry
        • By Origin
        • By Form & Delivery System
        • By Solubility & Carrier
    • Turkey
      • Pricing Analysis
      • Market Share Analysis, 2024
        • By Chemistry
        • By Origin
        • By Form & Delivery System
        • By Solubility & Carrier
    • UAE
      • Pricing Analysis
      • Market Share Analysis, 2024
        • By Chemistry
        • By Origin
        • By Form & Delivery System
        • By Solubility & Carrier
    • Saudi Arabia
      • Pricing Analysis
      • Market Share Analysis, 2024
        • By Chemistry
        • By Origin
        • By Form & Delivery System
        • By Solubility & Carrier
    • Israel
      • Pricing Analysis
      • Market Share Analysis, 2024
        • By Chemistry
        • By Origin
        • By Form & Delivery System
        • By Solubility & Carrier
    • North Africa
      • Pricing Analysis
      • Market Share Analysis, 2024
        • By Chemistry
        • By Origin
        • By Form & Delivery System
        • By Solubility & Carrier
    • South Africa
      • Pricing Analysis
      • Market Share Analysis, 2024
        • By Chemistry
        • By Origin
        • By Form & Delivery System
        • By Solubility & Carrier
  17. Market Structure Analysis
    • Competition Dashboard
    • Competition Benchmarking
    • Market Share Analysis of Top Players
      • By Regional
      • By Chemistry
      • By Origin
      • By Form & Delivery System
      • By Solubility & Carrier
  18. Competition Analysis
    • Competition Deep Dive
      • Symrise AG
        • Overview
        • Product Portfolio
        • Profitability by Market Segments (Product/Age /Sales Channel/Region)
        • Sales Footprint
        • Strategy Overview
          • Marketing Strategy
          • Product Strategy
          • Channel Strategy
      • Givaudan SA
        • Overview
        • Product Portfolio
        • Profitability by Market Segments (Product/Age /Sales Channel/Region)
        • Sales Footprint
        • Strategy Overview
          • Marketing Strategy
          • Product Strategy
          • Channel Strategy
      • Firmenich International SA
        • Overview
        • Product Portfolio
        • Profitability by Market Segments (Product/Age /Sales Channel/Region)
        • Sales Footprint
        • Strategy Overview
          • Marketing Strategy
          • Product Strategy
          • Channel Strategy
      • International Flavors & Fragrances (IFF)
        • Overview
        • Product Portfolio
        • Profitability by Market Segments (Product/Age /Sales Channel/Region)
        • Sales Footprint
        • Strategy Overview
          • Marketing Strategy
          • Product Strategy
          • Channel Strategy
      • Takasago International Corporation
        • Overview
        • Product Portfolio
        • Profitability by Market Segments (Product/Age /Sales Channel/Region)
        • Sales Footprint
        • Strategy Overview
          • Marketing Strategy
          • Product Strategy
          • Channel Strategy
      • Sensient Technologies Corporation
        • Overview
        • Product Portfolio
        • Profitability by Market Segments (Product/Age /Sales Channel/Region)
        • Sales Footprint
        • Strategy Overview
          • Marketing Strategy
          • Product Strategy
          • Channel Strategy
      • Kerry Group plc
        • Overview
        • Product Portfolio
        • Profitability by Market Segments (Product/Age /Sales Channel/Region)
        • Sales Footprint
        • Strategy Overview
          • Marketing Strategy
          • Product Strategy
          • Channel Strategy
      • MANE
        • Overview
        • Product Portfolio
        • Profitability by Market Segments (Product/Age /Sales Channel/Region)
        • Sales Footprint
        • Strategy Overview
          • Marketing Strategy
          • Product Strategy
          • Channel Strategy
      • Zhejiang NHU Co., Ltd.
        • Overview
        • Product Portfolio
        • Profitability by Market Segments (Product/Age /Sales Channel/Region)
        • Sales Footprint
        • Strategy Overview
          • Marketing Strategy
          • Product Strategy
          • Channel Strategy
      • Wanxiang International Limited
        • Overview
        • Product Portfolio
        • Profitability by Market Segments (Product/Age /Sales Channel/Region)
        • Sales Footprint
        • Strategy Overview
          • Marketing Strategy
          • Product Strategy
          • Channel Strategy
  19. Assumptions & Acronyms Used
  20. Research Methodology

List of Tables

  • Table 1: Global Market Value (USD Million) Forecast by Region, 2020-2035
  • Table 2: Global Market Volume (Units) Forecast by Region, 2020-2035
  • Table 3: Global Market Value (USD Million) Forecast by Chemistry, 2020-2035
  • Table 4: Global Market Volume (Units) Forecast by Chemistry, 2020-2035
  • Table 5: Global Market Value (USD Million) Forecast by Origin, 2020-2035
  • Table 6: Global Market Volume (Units) Forecast by Origin, 2020-2035
  • Table 7: Global Market Value (USD Million) Forecast by Form & Delivery System, 2020-2035
  • Table 8: Global Market Volume (Units) Forecast by Form & Delivery System, 2020-2035
  • Table 9: Global Market Value (USD Million) Forecast by Solubility & Carrier, 2020-2035
  • Table 10: Global Market Volume (Units) Forecast by Solubility & Carrier, 2020-2035
  • Table 11: North America Market Value (USD Million) Forecast by Country, 2020-2035
  • Table 12: North America Market Volume (Units) Forecast by Country, 2020-2035
  • Table 13: North America Market Value (USD Million) Forecast by Chemistry, 2020-2035
  • Table 14: North America Market Volume (Units) Forecast by Chemistry, 2020-2035
  • Table 15: North America Market Value (USD Million) Forecast by Origin, 2020-2035
  • Table 16: North America Market Volume (Units) Forecast by Origin, 2020-2035
  • Table 17: North America Market Value (USD Million) Forecast by Form & Delivery System, 2020-2035
  • Table 18: North America Market Volume (Units) Forecast by Form & Delivery System, 2020-2035
  • Table 19: North America Market Value (USD Million) Forecast by Solubility & Carrier, 2020-2035
  • Table 20: North America Market Volume (Units) Forecast by Solubility & Carrier, 2020-2035
  • Table 21: Latin America Market Value (USD Million) Forecast by Country, 2020-2035
  • Table 22: Latin America Market Volume (Units) Forecast by Country, 2020-2035
  • Table 23: Latin America Market Value (USD Million) Forecast by Chemistry, 2020-2035
  • Table 24: Latin America Market Volume (Units) Forecast by Chemistry, 2020-2035
  • Table 25: Latin America Market Value (USD Million) Forecast by Origin, 2020-2035
  • Table 26: Latin America Market Volume (Units) Forecast by Origin, 2020-2035
  • Table 27: Latin America Market Value (USD Million) Forecast by Form & Delivery System, 2020-2035
  • Table 28: Latin America Market Volume (Units) Forecast by Form & Delivery System, 2020-2035
  • Table 29: Latin America Market Value (USD Million) Forecast by Solubility & Carrier, 2020-2035
  • Table 30: Latin America Market Volume (Units) Forecast by Solubility & Carrier, 2020-2035
  • Table 31: Europe Market Value (USD Million) Forecast by Country, 2020-2035
  • Table 32: Europe Market Volume (Units) Forecast by Country, 2020-2035
  • Table 33: Europe Market Value (USD Million) Forecast by Chemistry, 2020-2035
  • Table 34: Europe Market Volume (Units) Forecast by Chemistry, 2020-2035
  • Table 35: Europe Market Value (USD Million) Forecast by Origin, 2020-2035
  • Table 36: Europe Market Volume (Units) Forecast by Origin, 2020-2035
  • Table 37: Europe Market Value (USD Million) Forecast by Form & Delivery System, 2020-2035
  • Table 38: Europe Market Volume (Units) Forecast by Form & Delivery System, 2020-2035
  • Table 39: Europe Market Value (USD Million) Forecast by Solubility & Carrier, 2020-2035
  • Table 40: Europe Market Volume (Units) Forecast by Solubility & Carrier, 2020-2035
  • Table 41: East Asia Market Value (USD Million) Forecast by Country, 2020-2035
  • Table 42: East Asia Market Volume (Units) Forecast by Country, 2020-2035
  • Table 43: East Asia Market Value (USD Million) Forecast by Chemistry, 2020-2035
  • Table 44: East Asia Market Volume (Units) Forecast by Chemistry, 2020-2035
  • Table 45: East Asia Market Value (USD Million) Forecast by Origin, 2020-2035
  • Table 46: East Asia Market Volume (Units) Forecast by Origin, 2020-2035
  • Table 47: East Asia Market Value (USD Million) Forecast by Form & Delivery System, 2020-2035
  • Table 48: East Asia Market Volume (Units) Forecast by Form & Delivery System, 2020-2035
  • Table 49: East Asia Market Value (USD Million) Forecast by Solubility & Carrier, 2020-2035
  • Table 50: East Asia Market Volume (Units) Forecast by Solubility & Carrier, 2020-2035
  • Table 51: South Asia & Pacific Market Value (USD Million) Forecast by Country, 2020-2035
  • Table 52: South Asia & Pacific Market Volume (Units) Forecast by Country, 2020-2035
  • Table 53: South Asia & Pacific Market Value (USD Million) Forecast by Chemistry, 2020-2035
  • Table 54: South Asia & Pacific Market Volume (Units) Forecast by Chemistry, 2020-2035
  • Table 55: South Asia & Pacific Market Value (USD Million) Forecast by Origin, 2020-2035
  • Table 56: South Asia & Pacific Market Volume (Units) Forecast by Origin, 2020-2035
  • Table 57: South Asia & Pacific Market Value (USD Million) Forecast by Form & Delivery System, 2020-2035
  • Table 58: South Asia & Pacific Market Volume (Units) Forecast by Form & Delivery System, 2020-2035
  • Table 59: South Asia & Pacific Market Value (USD Million) Forecast by Solubility & Carrier, 2020-2035
  • Table 60: South Asia & Pacific Market Volume (Units) Forecast by Solubility & Carrier, 2020-2035
  • Table 61: Middle East and Africa Market Value (USD Million) Forecast by Country, 2020-2035
  • Table 62: Middle East and Africa Market Volume (Units) Forecast by Country, 2020-2035
  • Table 63: Middle East and Africa Market Value (USD Million) Forecast by Chemistry, 2020-2035
  • Table 64: Middle East and Africa Market Volume (Units) Forecast by Chemistry, 2020-2035
  • Table 65: Middle East and Africa Market Value (USD Million) Forecast by Origin, 2020-2035
  • Table 66: Middle East and Africa Market Volume (Units) Forecast by Origin, 2020-2035
  • Table 67: Middle East and Africa Market Value (USD Million) Forecast by Form & Delivery System, 2020-2035
  • Table 68: Middle East and Africa Market Volume (Units) Forecast by Form & Delivery System, 2020-2035
  • Table 69: Middle East and Africa Market Value (USD Million) Forecast by Solubility & Carrier, 2020-2035
  • Table 70: Middle East and Africa Market Volume (Units) Forecast by Solubility & Carrier, 2020-2035


List of Figures

  • Figure 1: Global Market Value (USD Million) by Chemistry, 2025-2035
  • Figure 2: Global Market Value (USD Million) by Origin, 2025-2035
  • Figure 3: Global Market Value (USD Million) by Form & Delivery System, 2025-2035
  • Figure 4: Global Market Value (USD Million) by Solubility & Carrier, 2025-2035
  • Figure 5: Global Market Value (USD Million) by Region, 2025-2035
  • Figure 6: Global Market Value (USD Million) Analysis by Region, 2020-2035
  • Figure 7: Global Market Volume (Units) Analysis by Region, 2020-2035
  • Figure 8: Global Market Value Share (%) and BPS Analysis by Region, 2025-2035
  • Figure 9: Global Market Y-o-Y Growth (%) Projections by Region, 2025-2035
  • Figure 10: Global Market Value (USD Million) Analysis by Chemistry, 2020-2035
  • Figure 11: Global Market Volume (Units) Analysis by Chemistry, 2020-2035
  • Figure 12: Global Market Value Share (%) and BPS Analysis by Chemistry, 2025-2035
  • Figure 13: Global Market Y-o-Y Growth (%) Projections by Chemistry, 2025-2035
  • Figure 14: Global Market Value (USD Million) Analysis by Origin, 2020-2035
  • Figure 15: Global Market Volume (Units) Analysis by Origin, 2020-2035
  • Figure 16: Global Market Value Share (%) and BPS Analysis by Origin, 2025-2035
  • Figure 17: Global Market Y-o-Y Growth (%) Projections by Origin, 2025-2035
  • Figure 18: Global Market Value (USD Million) Analysis by Form & Delivery System, 2020-2035
  • Figure 19: Global Market Volume (Units) Analysis by Form & Delivery System, 2020-2035
  • Figure 20: Global Market Value Share (%) and BPS Analysis by Form & Delivery System, 2025-2035
  • Figure 21: Global Market Y-o-Y Growth (%) Projections by Form & Delivery System, 2025-2035
  • Figure 22: Global Market Value (USD Million) Analysis by Solubility & Carrier, 2020-2035
  • Figure 23: Global Market Volume (Units) Analysis by Solubility & Carrier, 2020-2035
  • Figure 24: Global Market Value Share (%) and BPS Analysis by Solubility & Carrier, 2025-2035
  • Figure 25: Global Market Y-o-Y Growth (%) Projections by Solubility & Carrier, 2025-2035
  • Figure 26: Global Market Attractiveness by Chemistry, 2025-2035
  • Figure 27: Global Market Attractiveness by Origin, 2025-2035
  • Figure 28: Global Market Attractiveness by Form & Delivery System, 2025-2035
  • Figure 29: Global Market Attractiveness by Solubility & Carrier, 2025-2035
  • Figure 30: Global Market Attractiveness by Region, 2025-2035
  • Figure 31: North America Market Value (USD Million) by Chemistry, 2025-2035
  • Figure 32: North America Market Value (USD Million) by Origin, 2025-2035
  • Figure 33: North America Market Value (USD Million) by Form & Delivery System, 2025-2035
  • Figure 34: North America Market Value (USD Million) by Solubility & Carrier, 2025-2035
  • Figure 35: North America Market Value (USD Million) by Country, 2025-2035
  • Figure 36: North America Market Value (USD Million) Analysis by Country, 2020-2035
  • Figure 37: North America Market Volume (Units) Analysis by Country, 2020-2035
  • Figure 38: North America Market Value Share (%) and BPS Analysis by Country, 2025-2035
  • Figure 39: North America Market Y-o-Y Growth (%) Projections by Country, 2025-2035
  • Figure 40: North America Market Value (USD Million) Analysis by Chemistry, 2020-2035
  • Figure 41: North America Market Volume (Units) Analysis by Chemistry, 2020-2035
  • Figure 42: North America Market Value Share (%) and BPS Analysis by Chemistry, 2025-2035
  • Figure 43: North America Market Y-o-Y Growth (%) Projections by Chemistry, 2025-2035
  • Figure 44: North America Market Value (USD Million) Analysis by Origin, 2020-2035
  • Figure 45: North America Market Volume (Units) Analysis by Origin, 2020-2035
  • Figure 46: North America Market Value Share (%) and BPS Analysis by Origin, 2025-2035
  • Figure 47: North America Market Y-o-Y Growth (%) Projections by Origin, 2025-2035
  • Figure 48: North America Market Value (USD Million) Analysis by Form & Delivery System, 2020-2035
  • Figure 49: North America Market Volume (Units) Analysis by Form & Delivery System, 2020-2035
  • Figure 50: North America Market Value Share (%) and BPS Analysis by Form & Delivery System, 2025-2035
  • Figure 51: North America Market Y-o-Y Growth (%) Projections by Form & Delivery System, 2025-2035
  • Figure 52: North America Market Value (USD Million) Analysis by Solubility & Carrier, 2020-2035
  • Figure 53: North America Market Volume (Units) Analysis by Solubility & Carrier, 2020-2035
  • Figure 54: North America Market Value Share (%) and BPS Analysis by Solubility & Carrier, 2025-2035
  • Figure 55: North America Market Y-o-Y Growth (%) Projections by Solubility & Carrier, 2025-2035
  • Figure 56: North America Market Attractiveness by Chemistry, 2025-2035
  • Figure 57: North America Market Attractiveness by Origin, 2025-2035
  • Figure 58: North America Market Attractiveness by Form & Delivery System, 2025-2035
  • Figure 59: North America Market Attractiveness by Solubility & Carrier, 2025-2035
  • Figure 60: North America Market Attractiveness by Country, 2025-2035
  • Figure 61: Latin America Market Value (USD Million) by Chemistry, 2025-2035
  • Figure 62: Latin America Market Value (USD Million) by Origin, 2025-2035
  • Figure 63: Latin America Market Value (USD Million) by Form & Delivery System, 2025-2035
  • Figure 64: Latin America Market Value (USD Million) by Solubility & Carrier, 2025-2035
  • Figure 65: Latin America Market Value (USD Million) by Country, 2025-2035
  • Figure 66: Latin America Market Value (USD Million) Analysis by Country, 2020-2035
  • Figure 67: Latin America Market Volume (Units) Analysis by Country, 2020-2035
  • Figure 68: Latin America Market Value Share (%) and BPS Analysis by Country, 2025-2035
  • Figure 69: Latin America Market Y-o-Y Growth (%) Projections by Country, 2025-2035
  • Figure 70: Latin America Market Value (USD Million) Analysis by Chemistry, 2020-2035
  • Figure 71: Latin America Market Volume (Units) Analysis by Chemistry, 2020-2035
  • Figure 72: Latin America Market Value Share (%) and BPS Analysis by Chemistry, 2025-2035
  • Figure 73: Latin America Market Y-o-Y Growth (%) Projections by Chemistry, 2025-2035
  • Figure 74: Latin America Market Value (USD Million) Analysis by Origin, 2020-2035
  • Figure 75: Latin America Market Volume (Units) Analysis by Origin, 2020-2035
  • Figure 76: Latin America Market Value Share (%) and BPS Analysis by Origin, 2025-2035
  • Figure 77: Latin America Market Y-o-Y Growth (%) Projections by Origin, 2025-2035
  • Figure 78: Latin America Market Value (USD Million) Analysis by Form & Delivery System, 2020-2035
  • Figure 79: Latin America Market Volume (Units) Analysis by Form & Delivery System, 2020-2035
  • Figure 80: Latin America Market Value Share (%) and BPS Analysis by Form & Delivery System, 2025-2035
  • Figure 81: Latin America Market Y-o-Y Growth (%) Projections by Form & Delivery System, 2025-2035
  • Figure 82: Latin America Market Value (USD Million) Analysis by Solubility & Carrier, 2020-2035
  • Figure 83: Latin America Market Volume (Units) Analysis by Solubility & Carrier, 2020-2035
  • Figure 84: Latin America Market Value Share (%) and BPS Analysis by Solubility & Carrier, 2025-2035
  • Figure 85: Latin America Market Y-o-Y Growth (%) Projections by Solubility & Carrier, 2025-2035
  • Figure 86: Latin America Market Attractiveness by Chemistry, 2025-2035
  • Figure 87: Latin America Market Attractiveness by Origin, 2025-2035
  • Figure 88: Latin America Market Attractiveness by Form & Delivery System, 2025-2035
  • Figure 89: Latin America Market Attractiveness by Solubility & Carrier, 2025-2035
  • Figure 90: Latin America Market Attractiveness by Country, 2025-2035
  • Figure 91: Europe Market Value (USD Million) by Chemistry, 2025-2035
  • Figure 92: Europe Market Value (USD Million) by Origin, 2025-2035
  • Figure 93: Europe Market Value (USD Million) by Form & Delivery System, 2025-2035
  • Figure 94: Europe Market Value (USD Million) by Solubility & Carrier, 2025-2035
  • Figure 95: Europe Market Value (USD Million) by Country, 2025-2035
  • Figure 96: Europe Market Value (USD Million) Analysis by Country, 2020-2035
  • Figure 97: Europe Market Volume (Units) Analysis by Country, 2020-2035
  • Figure 98: Europe Market Value Share (%) and BPS Analysis by Country, 2025-2035
  • Figure 99: Europe Market Y-o-Y Growth (%) Projections by Country, 2025-2035
  • Figure 100: Europe Market Value (USD Million) Analysis by Chemistry, 2020-2035
  • Figure 101: Europe Market Volume (Units) Analysis by Chemistry, 2020-2035
  • Figure 102: Europe Market Value Share (%) and BPS Analysis by Chemistry, 2025-2035
  • Figure 103: Europe Market Y-o-Y Growth (%) Projections by Chemistry, 2025-2035
  • Figure 104: Europe Market Value (USD Million) Analysis by Origin, 2020-2035
  • Figure 105: Europe Market Volume (Units) Analysis by Origin, 2020-2035
  • Figure 106: Europe Market Value Share (%) and BPS Analysis by Origin, 2025-2035
  • Figure 107: Europe Market Y-o-Y Growth (%) Projections by Origin, 2025-2035
  • Figure 108: Europe Market Value (USD Million) Analysis by Form & Delivery System, 2020-2035
  • Figure 109: Europe Market Volume (Units) Analysis by Form & Delivery System, 2020-2035
  • Figure 110: Europe Market Value Share (%) and BPS Analysis by Form & Delivery System, 2025-2035
  • Figure 111: Europe Market Y-o-Y Growth (%) Projections by Form & Delivery System, 2025-2035
  • Figure 112: Europe Market Value (USD Million) Analysis by Solubility & Carrier, 2020-2035
  • Figure 113: Europe Market Volume (Units) Analysis by Solubility & Carrier, 2020-2035
  • Figure 114: Europe Market Value Share (%) and BPS Analysis by Solubility & Carrier, 2025-2035
  • Figure 115: Europe Market Y-o-Y Growth (%) Projections by Solubility & Carrier, 2025-2035
  • Figure 116: Europe Market Attractiveness by Chemistry, 2025-2035
  • Figure 117: Europe Market Attractiveness by Origin, 2025-2035
  • Figure 118: Europe Market Attractiveness by Form & Delivery System, 2025-2035
  • Figure 119: Europe Market Attractiveness by Solubility & Carrier, 2025-2035
  • Figure 120: Europe Market Attractiveness by Country, 2025-2035
  • Figure 121: East Asia Market Value (USD Million) by Chemistry, 2025-2035
  • Figure 122: East Asia Market Value (USD Million) by Origin, 2025-2035
  • Figure 123: East Asia Market Value (USD Million) by Form & Delivery System, 2025-2035
  • Figure 124: East Asia Market Value (USD Million) by Solubility & Carrier, 2025-2035
  • Figure 125: East Asia Market Value (USD Million) by Country, 2025-2035
  • Figure 126: East Asia Market Value (USD Million) Analysis by Country, 2020-2035
  • Figure 127: East Asia Market Volume (Units) Analysis by Country, 2020-2035
  • Figure 128: East Asia Market Value Share (%) and BPS Analysis by Country, 2025-2035
  • Figure 129: East Asia Market Y-o-Y Growth (%) Projections by Country, 2025-2035
  • Figure 130: East Asia Market Value (USD Million) Analysis by Chemistry, 2020-2035
  • Figure 131: East Asia Market Volume (Units) Analysis by Chemistry, 2020-2035
  • Figure 132: East Asia Market Value Share (%) and BPS Analysis by Chemistry, 2025-2035
  • Figure 133: East Asia Market Y-o-Y Growth (%) Projections by Chemistry, 2025-2035
  • Figure 134: East Asia Market Value (USD Million) Analysis by Origin, 2020-2035
  • Figure 135: East Asia Market Volume (Units) Analysis by Origin, 2020-2035
  • Figure 136: East Asia Market Value Share (%) and BPS Analysis by Origin, 2025-2035
  • Figure 137: East Asia Market Y-o-Y Growth (%) Projections by Origin, 2025-2035
  • Figure 138: East Asia Market Value (USD Million) Analysis by Form & Delivery System, 2020-2035
  • Figure 139: East Asia Market Volume (Units) Analysis by Form & Delivery System, 2020-2035
  • Figure 140: East Asia Market Value Share (%) and BPS Analysis by Form & Delivery System, 2025-2035
  • Figure 141: East Asia Market Y-o-Y Growth (%) Projections by Form & Delivery System, 2025-2035
  • Figure 142: East Asia Market Value (USD Million) Analysis by Solubility & Carrier, 2020-2035
  • Figure 143: East Asia Market Volume (Units) Analysis by Solubility & Carrier, 2020-2035
  • Figure 144: East Asia Market Value Share (%) and BPS Analysis by Solubility & Carrier, 2025-2035
  • Figure 145: East Asia Market Y-o-Y Growth (%) Projections by Solubility & Carrier, 2025-2035
  • Figure 146: East Asia Market Attractiveness by Chemistry, 2025-2035
  • Figure 147: East Asia Market Attractiveness by Origin, 2025-2035
  • Figure 148: East Asia Market Attractiveness by Form & Delivery System, 2025-2035
  • Figure 149: East Asia Market Attractiveness by Solubility & Carrier, 2025-2035
  • Figure 150: East Asia Market Attractiveness by Country, 2025-2035
  • Figure 151: South Asia & Pacific Market Value (USD Million) by Chemistry, 2025-2035
  • Figure 152: South Asia & Pacific Market Value (USD Million) by Origin, 2025-2035
  • Figure 153: South Asia & Pacific Market Value (USD Million) by Form & Delivery System, 2025-2035
  • Figure 154: South Asia & Pacific Market Value (USD Million) by Solubility & Carrier, 2025-2035
  • Figure 155: South Asia & Pacific Market Value (USD Million) by Country, 2025-2035
  • Figure 156: South Asia & Pacific Market Value (USD Million) Analysis by Country, 2020-2035
  • Figure 157: South Asia & Pacific Market Volume (Units) Analysis by Country, 2020-2035
  • Figure 158: South Asia & Pacific Market Value Share (%) and BPS Analysis by Country, 2025-2035
  • Figure 159: South Asia & Pacific Market Y-o-Y Growth (%) Projections by Country, 2025-2035
  • Figure 160: South Asia & Pacific Market Value (USD Million) Analysis by Chemistry, 2020-2035
  • Figure 161: South Asia & Pacific Market Volume (Units) Analysis by Chemistry, 2020-2035
  • Figure 162: South Asia & Pacific Market Value Share (%) and BPS Analysis by Chemistry, 2025-2035
  • Figure 163: South Asia & Pacific Market Y-o-Y Growth (%) Projections by Chemistry, 2025-2035
  • Figure 164: South Asia & Pacific Market Value (USD Million) Analysis by Origin, 2020-2035
  • Figure 165: South Asia & Pacific Market Volume (Units) Analysis by Origin, 2020-2035
  • Figure 166: South Asia & Pacific Market Value Share (%) and BPS Analysis by Origin, 2025-2035
  • Figure 167: South Asia & Pacific Market Y-o-Y Growth (%) Projections by Origin, 2025-2035
  • Figure 168: South Asia & Pacific Market Value (USD Million) Analysis by Form & Delivery System, 2020-2035
  • Figure 169: South Asia & Pacific Market Volume (Units) Analysis by Form & Delivery System, 2020-2035
  • Figure 170: South Asia & Pacific Market Value Share (%) and BPS Analysis by Form & Delivery System, 2025-2035
  • Figure 171: South Asia & Pacific Market Y-o-Y Growth (%) Projections by Form & Delivery System, 2025-2035
  • Figure 172: South Asia & Pacific Market Value (USD Million) Analysis by Solubility & Carrier, 2020-2035
  • Figure 173: South Asia & Pacific Market Volume (Units) Analysis by Solubility & Carrier, 2020-2035
  • Figure 174: South Asia & Pacific Market Value Share (%) and BPS Analysis by Solubility & Carrier, 2025-2035
  • Figure 175: South Asia & Pacific Market Y-o-Y Growth (%) Projections by Solubility & Carrier, 2025-2035
  • Figure 176: South Asia & Pacific Market Attractiveness by Chemistry, 2025-2035
  • Figure 177: South Asia & Pacific Market Attractiveness by Origin, 2025-2035
  • Figure 178: South Asia & Pacific Market Attractiveness by Form & Delivery System, 2025-2035
  • Figure 179: South Asia & Pacific Market Attractiveness by Solubility & Carrier, 2025-2035
  • Figure 180: South Asia & Pacific Market Attractiveness by Country, 2025-2035
  • Figure 181: Middle East and Africa Market Value (USD Million) by Chemistry, 2025-2035
  • Figure 182: Middle East and Africa Market Value (USD Million) by Origin, 2025-2035
  • Figure 183: Middle East and Africa Market Value (USD Million) by Form & Delivery System, 2025-2035
  • Figure 184: Middle East and Africa Market Value (USD Million) by Solubility & Carrier, 2025-2035
  • Figure 185: Middle East and Africa Market Value (USD Million) by Country, 2025-2035
  • Figure 186: Middle East and Africa Market Value (USD Million) Analysis by Country, 2020-2035
  • Figure 187: Middle East and Africa Market Volume (Units) Analysis by Country, 2020-2035
  • Figure 188: Middle East and Africa Market Value Share (%) and BPS Analysis by Country, 2025-2035
  • Figure 189: Middle East and Africa Market Y-o-Y Growth (%) Projections by Country, 2025-2035
  • Figure 190: Middle East and Africa Market Value (USD Million) Analysis by Chemistry, 2020-2035
  • Figure 191: Middle East and Africa Market Volume (Units) Analysis by Chemistry, 2020-2035
  • Figure 192: Middle East and Africa Market Value Share (%) and BPS Analysis by Chemistry, 2025-2035
  • Figure 193: Middle East and Africa Market Y-o-Y Growth (%) Projections by Chemistry, 2025-2035
  • Figure 194: Middle East and Africa Market Value (USD Million) Analysis by Origin, 2020-2035
  • Figure 195: Middle East and Africa Market Volume (Units) Analysis by Origin, 2020-2035
  • Figure 196: Middle East and Africa Market Value Share (%) and BPS Analysis by Origin, 2025-2035
  • Figure 197: Middle East and Africa Market Y-o-Y Growth (%) Projections by Origin, 2025-2035
  • Figure 198: Middle East and Africa Market Value (USD Million) Analysis by Form & Delivery System, 2020-2035
  • Figure 199: Middle East and Africa Market Volume (Units) Analysis by Form & Delivery System, 2020-2035
  • Figure 200: Middle East and Africa Market Value Share (%) and BPS Analysis by Form & Delivery System, 2025-2035
  • Figure 201: Middle East and Africa Market Y-o-Y Growth (%) Projections by Form & Delivery System, 2025-2035
  • Figure 202: Middle East and Africa Market Value (USD Million) Analysis by Solubility & Carrier, 2020-2035
  • Figure 203: Middle East and Africa Market Volume (Units) Analysis by Solubility & Carrier, 2020-2035
  • Figure 204: Middle East and Africa Market Value Share (%) and BPS Analysis by Solubility & Carrier, 2025-2035
  • Figure 205: Middle East and Africa Market Y-o-Y Growth (%) Projections by Solubility & Carrier, 2025-2035
  • Figure 206: Middle East and Africa Market Attractiveness by Chemistry, 2025-2035
  • Figure 207: Middle East and Africa Market Attractiveness by Origin, 2025-2035
  • Figure 208: Middle East and Africa Market Attractiveness by Form & Delivery System, 2025-2035
  • Figure 209: Middle East and Africa Market Attractiveness by Solubility & Carrier, 2025-2035
  • Figure 210: Middle East and Africa Market Attractiveness by Country, 2025-2035

Frequently Asked Questions

How big is the Global Cooling Essences Market in 2025?

The Global Cooling Essences Market is estimated to be valued at USD 712.4 million in 2025.

What will be the size of the Global Cooling Essences Market in 2035?

The market size for the Global Cooling Essences Market is projected to reach USD 1,905.3 million by 2035.

How much will be the Global Cooling Essences Market growth between 2025 and 2035?

The Global Cooling Essences Market is expected to grow at a 10.3% CAGR between 2025 and 2035.

What are the key chemistry types in the Global Cooling Essences Market?

The key chemistry types in the Global Cooling Essences Market are menthol family, menthyl esters, WS-series cooling amides, and other blends.

Which application segment will contribute significant share in the Global Cooling Essences Market in 2025?

In terms of application, the oral care segment is expected to command 30% share in the Global Cooling Essences Market in 2025.

Explore Similar Insights

Future Market Insights

Cooling Essences Market