Reports

- Global Locations -

Headquarters

Future Market Insights, Inc.

Christiana Corporate, 200
Continental Drive, Suite 401,
Newark, Delaware - 19713,
United States

T: +1-845-579-5705

Americas

Future Market Insights, Inc.

616 Corporate Way, Suite 2-9018,
Valley Cottage, NY 10989, United States

T: +1-347-918-3531

MEA

Future Market Insights

1602-6 Jumeirah Bay X2 Tower, Plot No: JLT-PH2-X2A,
Jumeirah Lakes Towers, Dubai,
United Arab Emirates

Europe

Future Market Insights

3rd Floor, 207 Regent Street,
W1B 3HH London
United Kingdom

T: + 44 (0) 20 8123 9659
D: +44 (0) 20 3287 4268

Asia Pacific

Future Market Insights

IndiaLand Global Tech Park, Unit UG-1, Behind Grand HighStreet, Phase 1, Hinjawadi, MH, Pune – 411057, India

Cryogenic Boxes Market Outlook (2022-2032)

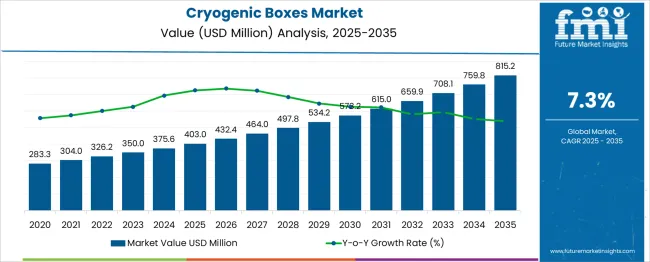
[250 Pages Report] According to the study, the global cryogenic boxes market is expected to grow at a CAGR of 7.3% between 2022 and 2032. The market value is projected to increase from US$ 326.2 Mn in 2022 to US$ 657.3 Mn by 2032. The cryogenic boxes market was valued at US$ 305 Mn at the end of 2021 and is anticipated to exhibit Y-o-Y growth of 7.0% in 2022

Attribute Details
Global Cryogenic Boxes Market Size (2022E) US$ 326.2 Million
Projected Market Size (2032F) US$ 657.3 Million
Value CAGR (2022 to 2032) 7.3%
Top 3 Countries Market Share 34.5%

Newly released data from cryogenic boxes market analysis shows that global demand of overall plastic cryogenic boxes enjoyed year-on-year (YoY) growth of 6.8% in 2021. This growth is attributed to unprecedented outbreak of COVID-19 across the globe.

The need of cryogenic boxes exponentially increased for the transportation of COVID-19 vaccine vials, syringes, and several other healthcare products. Over the coming decade, the consumption of paper & paperboard based cryogenic boxes is estimated to increase at a growth rate of 8% amid rising sustainability concerns.

The consumption of cryogenic boxes in healthcare industry witnessed robust growth in 2021 with worldwide revenues up 12.6% year over year. A new forecast by Future Market Insights (FMI) estimates that cryogenic boxes revenues in the healthcare industry will nearly double between 2022 and 2032.

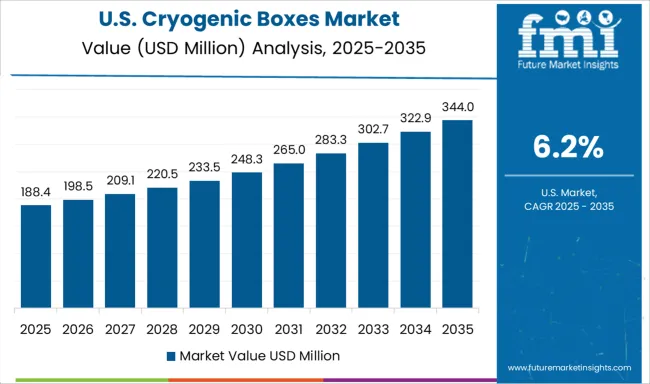
It is expected to reach a valuation of nearly US$ 309 Mn in 2032 with a ten-year compound annual growth rate (CAGR) of 8%. Regionally, in 2021, the U.S cryogenic boxes market grew by 5.5% year on year, the total demand/sales of cryogenic boxes in North America reached US$ 82.4 Mn.

Don't pay for what you don't need

Customize your report by selecting specific countries or regions and save 30%!

2015-2021 Cryogenic Boxes Market Demand Outlook Compared to 2022-2032 Forecast

During the historic period (2015-2021), the cryogenic boxes market grew at a CAGR of 5.5% and valued at US$ 305 Mn in 2021. However, with the increase in manufacturing of vaccine and cosmetic products, the global market is estimated to increase 2.2x over the next decade.

Cryogenic boxes are used to store and transport organic material at ultra-low temperatures for short or long period of time. It is designed to keep cryogenic vials and tubes safe, utilizing modern technologies and products to give a boost to the cryogenic box market. Various market participants and product innovations helped to increase market penetration during this time period.

Cryogenic Boxes Market

The market for cryogenic boxes observed exponential growth following the outbreak of COVID-19. Growth is also due to increasing research into better vaccine development, introduction of antiviral medications, and immunity-boosting shots.

Furthermore, increasing demand owing to non-fragile lab applications is another driving the cryogenic boxes market. Application of cryogenic boxes in healthcare sector is expected to create significant revenue creating opportunities for the manufacturers.

How will Expansion of Biopharmaceutical Industry Affect Cryogenic Boxes Market?

The biopharmaceutical sector is gaining immense traction in the pharmaceutical industry, and it has the potential to grow rapidly in the next years. Disruptive technologies, digitization, and a comprehensive approach to the treatment of incurable diseases are some of the factors boosting the market.

With the expansion of biopharmaceutical industry, cryogenic box applications are expected to surge. Cryovials could be utilized to store cancer, HIV, and Alzheimer's disease medications. According to the Pharmaceutical Research and Manufacturers of America (PhRMA), the biopharmaceutical business in the United States accounted for 3.2 percent of total GDP in 2017, with a value of US$ 625 billion. This is further expected to increase the sales of cryogenic boxes in upcoming decade.

Ismail Sutaria
Ismail Sutaria

Principal Consultant

Talk to Analyst

Find your sweet spots for generating winning opportunities in this market.

Which is the Leading Region in the Cryogenic Boxes Market?

The cryogenic boxes demand is increasing for storing and transporting vaccines, chemicals, and various other ingredients in different packaging formats such as vials, ampoules, and tubes. The demand for cryogenic boxes for storing powder or liquid ingredient in vials is surging across the globe.

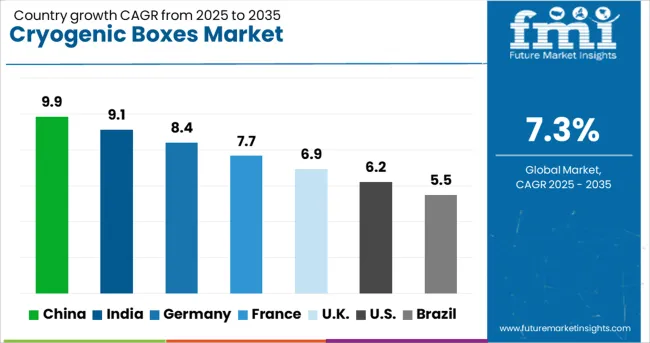
However, due to increasing clinical research and drug research in India, the demand for cryogenic boxes for storing tubes is expected to rise in South Asia. As per FMI, South Asia market is expected to hold a market share of 44% during the forecast period.

Consumption and sales of cryogenic boxes in ampoules segment is estimated to hold a varying market share between 10-15% in all regions. Although this consist of low market share in Europe, it is expected to increase with the significant pace in 2022-2032.

Country-wise Insights

How is the U.S. Cryogenic Boxes Market Faring?

Presence of Leading Cryogenic Boxes Manufacturers in the U.S. to Push the Sales

The U.S. is considered to have the lowest market barriers to new market entrants in the pharmaceutical industry. It also has the most favorable business climate for the research and sale of pharmaceutical equipment and medications.

According to FMI, the U.S. will reach a valuation of US$ 73 Mn in 2022, accounting for about 23% of the worldwide cryogenic box market.

Why is India Considered to be the Most Lucrative Cryogenic Boxes Market?

As per the annual report published by Department of Pharmaceuticals, Ministry of Chemicals and Fertilizers, Government of India, India pharmaceutical industry is the world’s third largest by volume and 14th largest by value.

India is the largest provider of generic drugs globally. India supplies affordable and low-cost generic drugs to millions of people across the globe and operates a significant number of United States Food and Drug Administration (USFDA) and World Health Organization (WHO) Good Manufacturing Practices (GMP)-compliant plants.

India accounts for 60% of global vaccine production, contributing 40 to 70% of the WHO demand for Diphtheria, Tetanus and Pertussis (DPT) and Bacillus Calmette–Guérin (BCG) vaccines, and 90 percent of the WHO demand for the measles vaccine.

FMI team predicts that increasing exports and imports of vaccines and many other ingredients expected to create US$ 28.3 Mn revenue opportunity in next decade.

Get the data you need at a Fraction of the cost

Personalize your report by choosing insights you need
and save 40%!

Category-wise Insights

Which Material Will Hold Lion’s Share in the Cryogenic Boxes Market?

Growing Sustainability Concerns to Spur the Sales of Paper & Paperboard Cryogenic Boxes

Plastic cryogenic box accounts for over 50% of the whole cryogenic box market, according to FMI. Demand for plastic cryogenic boxes in humid areas for protection against rain, dampness, as well as other liquid contents, is increasing.

However, paper & paperboard cryogenic boxes are gaining traction due to the easy biodegradable property of paper & paperboard cryogenic box and government restrictions also prohibit the use of plastic cryogenic box in various countries.

Which is the Leading End-Use Segment in the Cryogenic Boxes Market?

Cryogenic Boxes Market to Benefit from Rising Application in Healthcare Industry

Among the end-use, healthcare accounted for the largest share in 2021 and is poised to maintain its reign during the forecast period. Healthcare is expected to accelerate with a CAGR of 8% in the global market is expected to attract investors.

As per the report published by World Health Organization, global spending on health more than doubled in real terms over the past two decades, reaching US$ 8.5 trillion in 2019, or 9.8% of global GDP.

Competitive Landscape

With big global and local competitors, the cryogenic box market is fiercely competitive. Customers can choose their sizes thanks to the market's leading companies. Cryogenic box lids are also being innovated by several manufacturers in order to gain market share.

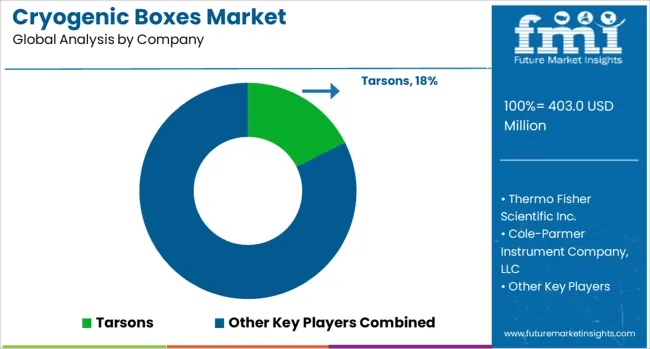
Market shares are projected to change as a result of overall innovation in material, size, and appearance. Some of the market's major companies are Tarsons, Thermo Fisher Scientific Inc., Cole-Parmer Instrument Company, LLC, Merck KGaA, ratiolab, BIOLOGIX GROUP LTD, Heathrow Scientific, Bioline Technologies, TENAK A/S, Deluxe Scientific Surgico Private Limited, CAPP, GENAXXON bioscience, Glassco, AHN Biotechnologie GmbH

Some of the key developments:

  • Capp App, established in Denmark, offers environmentally friendly cardboard cryogenic boxes that not only repel moisture but also protect against minor chemical leaks.
  • TENAK is working on high-quality cryogenic boxes that can be autoclaved and have cell codes/indices imprinted on the lid for simple identification.

Scope of the Report

Attribute Details
Forecast Period 2022 to 2032
Historical Data Available for 2015 to 2021
Market Analysis US$ Million for Value and Units for Volume
Key Regions Covered North America, Latin America, Europe, East Asia, South Asia, and the Middle East & Africa
Key Countries Covered USA, Brazil, Mexico, Germany,UK, China, India, Japan, Australia, and GCC Countries
Key Segments Covered Material, Application, End Use Industry, Region
Key Companies Profiled
  • Tarsons
  • Thermo Fisher Scientific Inc.
  • Cole-Parmer Instrument Company
  • LLC, Merck KGaA, ratiolab
  • BIOLOGIX GROUP LTD
  • Heathrow Scientific
  • Bioline Technologies
  • TENAK A/S
  • Deluxe Scientific Surgico Private Limited
  • CAPP
  • GENAXXON bioscience
  • Glassco
  • AHN Biotechnologie GmbH
Report Coverage Market Forecast, Company Share Analysis, Competition Intelligence, DROT Analysis, Market Dynamics and Challenges, and Strategic Growth Initiatives

Global Cryogenic Boxes Market by Category

By Material:

  • Plastic
  • Paper & paperboard
  • Metal

By Application:

  • Vials
  • Ampoules
  • Tubes

By End Use Industry:

  • Chemical
  • Healthcare
  • Personal Care

By Region:

  • North America
  • Latin America
  • Europe
  • Middle East and Africa
  • East Asia
  • South Asia
  • Oceania

Frequently Asked Questions

What will be the growth prospects of the global cryogenic boxes market?

The cryogenic boxes market was valued at US $ 305 Mn in 2021, and it is expected to grow at a CAGR of 7.3% from 2022 to 2032.

Which material type is expected to lead the global cryogenic boxes market during the forecast period?

During the forecast period, plastic cryogenic boxes are estimated to grow at the fastest rate. However, paper & paperboard cryogenic boxes will gain traction on the back of rising sustainability concerns across the globe.

Which region is expected to contribute maximum to the global cryogenic boxes market?

India is expected to reflect an incremental growth of 2.2x during the forecast period.

Table of Content

1. Executive Summary

    1.1. Global Market Outlook

    1.2. Demand Side Trends

    1.3. Supply Side Trends

    1.4. Technology Roadmap

    1.5. Analysis and Recommendations

2. Market Overview

    2.1. Market Coverage / Taxonomy

    2.2. Market Definition / Scope / Limitations

3. Key Market Trends

    3.1. Key Trends Impacting the Market

    3.2. Product Innovation / Development Trends

4. Key Success Factors

    4.1. Product Adoption / Usage Analysis

    4.2. Product USPs / Features

    4.3. Strategic Promotional Strategies

5. Cryogenic Boxes Market Demand Analysis 2015–2021 and Forecast, 2022–2032

    5.1. Historical Market Volume (Mn Units) Analysis, 2015–2021

    5.2. Current and Future Market Volume (Mn Units) Projections, 2022–2032

    5.3. Y-o-Y Growth Trend Analysis

6. Cryogenic Boxes Market - Pricing Analysis

    6.1. Regional Pricing Analysis 

    6.2. Global Average Pricing Analysis Benchmark

7. Cryogenic Boxes Market Demand (in Value or Size in US$ Mn) Analysis 2015–2021 and Forecast, 2022–2032

    7.1. Historical Market Value (US$ Mn) Analysis, 2015–2021

    7.2. Current and Future Market Value (US$ Mn) Projections, 2022–2032

        7.2.1. Y-o-Y Growth Trend Analysis

        7.2.2. Absolute $ Opportunity Analysis

8. Market Background

    8.1. Global Packaging Market Outlook

    8.2. Global Rigid Packaging Market Outlook

    8.3. Global Cold Chain Packaging Market Outlook

    8.4. Macro-Economic Factors

    8.5. Forecast Factors - Relevance & Impact

    8.6. Value Chain

        8.6.1. Raw Material Suppliers

        8.6.2. Cryogenic Boxes  Manufacturers

        8.6.3. End Users / Brand Owners

    8.7. COVID-19 Crisis – Impact Assessment

        8.7.1. Current Statistics

        8.7.2. Short-Mid-Long Term Outlook 

        8.7.3. Likely Rebound

    8.8. Market Dynamics

        8.8.1. Drivers

        8.8.2. Restraints

        8.8.3. Opportunity Analysis

    8.9. Supply Demand Analysis

9. Global Cryogenic Boxes Market Analysis 2015–2021 and Forecast 2022–2032, By Material

    9.1. Introduction / Key Findings

    9.2. Historical Market Size (US$ Mn) and Volume Analysis, by Material, 2015–2021

    9.3. Current and Future Market Size (US$ Mn) and Volume Analysis and Forecast, by Material, 2022–2032

        9.3.1. Paper & Paperboard Cryogenic Boxes 

        9.3.2. Plastic Cryogenic Boxes 

        9.3.3. Metal

    9.4. Market Attractiveness Analysis, by Material

10. Global Cryogenic Boxes Market Analysis 2015–2021 and Forecast 2022–2032, By Application

    10.1. Introduction / Key Findings

    10.2. Historical Market Size (US$ Mn) and Volume Analysis, by Application, 2015–2021

    10.3. Current and Future Market Size (US$ Mn) and Volume Analysis and Forecast, by Application, 2022–2032

        10.3.1. Vials

        10.3.2. Ampoules

        10.3.3. Tubes

    10.4. Market Attractiveness Analysis, by Application

11. Global Cryogenic Boxes Market Analysis 2015–2021 and Forecast 2022–2032, By End Use

    11.1. Introduction / Key Findings

    11.2. Historical Market Size (US$ Mn) and Volume Analysis, by End Use, 2015–2021

    11.3. Current and Future Market Size (US$ Mn) and Volume Analysis and Forecast, by End Use, 2022–2032

        11.3.1. Chemical

        11.3.2. Healthcare

        11.3.3. Personal Care

    11.4. Market Attractiveness Analysis, by End Use

12. Global Cryogenic Boxes Market Analysis 2015–2021 and Forecast 2022–2032, by Region

    12.1. Introduction / Key Findings

    12.2. Historical Market Size (US$ Mn) and Volume Analysis, by Region, 2015–2021

    12.3. Current and Future Market Size (US$ Mn) and Volume Analysis and Forecast, by Region, 2022–2032

        12.3.1. North America

        12.3.2. Latin America

        12.3.3. Europe

        12.3.4. Middle East and Africa (MEA)

        12.3.5. East Asia

        12.3.6. South Asia 

        12.3.7. Oceania 

    12.4. Market Attractiveness Analysis, by Region

13. North America Cryogenic Boxes Market Analysis 2015–2021 and Forecast 2022–2032

    13.1. Introduction / Key Findings

    13.2. Historical Market Size (US$ Mn) and Volume (Mn Units) Analysis, by Market Taxonomy, 2015–2021

    13.3. Current Market Size (US$ Mn) and Volume (Mn Units) Analysis and Forecast, by Market Taxonomy, 2022–2032

        13.3.1. By Country

            13.3.1.1. U.S.

            13.3.1.2. Canada

        13.3.2. By Material

        13.3.3. By Application

        13.3.4. By End Use

    13.4. Market Attractiveness Analysis

        13.4.1. By Country

        13.4.2. By Material

        13.4.3. By Application

        13.4.4. By End Use

14. Latin America Cryogenic Boxes Market Analysis 2015–2021 and Forecast 2022–2032

    14.1. Introduction / Key Findings

    14.2. Historical Market Size (US$ Mn) and Volume (Mn Units) Analysis, by Market Taxonomy, 2015–2021

    14.3. Current Market Size (US$ Mn) and Volume (Mn Units) Analysis and Forecast, by Market Taxonomy, 2022–2032

        14.3.1. By Country

            14.3.1.1. Brazil

            14.3.1.2. Mexico

            14.3.1.3. Argentina

            14.3.1.4. Rest of Latin America

        14.3.2. By Material

        14.3.3. By Application

        14.3.4. By End Use

    14.4. Market Attractiveness Analysis

        14.4.1. By Country

        14.4.2. By Material

        14.4.3. By Application

        14.4.4. By End Use

15. Europe Cryogenic Boxes Market Analysis 2015–2021 and Forecast 2022–2032

    15.1. Introduction / Key Findings

    15.2. Historical Market Size (US$ Mn) and Volume (Mn Units) Analysis, by Market Taxonomy, 2015–2021

    15.3. Current Market Size (US$ Mn) and Volume (Mn Units) Analysis and Forecast, by Market Taxonomy, 2022–2032

        15.3.1. By Country

            15.3.1.1. Germany

            15.3.1.2. Italy

            15.3.1.3. France

            15.3.1.4. U.K.

            15.3.1.5. Spain

            15.3.1.6. BENELUX

            15.3.1.7. Nordic

            15.3.1.8. Russia

            15.3.1.9. Poland

            15.3.1.10. Rest of Europe

        15.3.2. By Material

        15.3.3. By Application

        15.3.4. By End Use

    15.4. Market Attractiveness Analysis

        15.4.1. By Country

        15.4.2. By Material

        15.4.3. By Application

        15.4.4. By End Use

16. Middle East & Africa Cryogenic Boxes Market Analysis 2015–2021 and Forecast 2022–2032

    16.1. Introduction / Key Findings

    16.2. Historical Market Size (US$ Mn) and Volume (Mn Units) Analysis, by Market Taxonomy, 2015–2021

    16.3. Current Market Size (US$ Mn) and Volume (Mn Units) Analysis and Forecast, by Market Taxonomy, 2022–2032

        16.3.1. By Country

            16.3.1.1. GCC Countries

            16.3.1.2. Turkey

            16.3.1.3. Northern Africa

            16.3.1.4. South Africa

            16.3.1.5. Rest of Middle East and Africa

        16.3.2. By Material

        16.3.3. By Application

        16.3.4. By End Use

    16.4. Market Attractiveness Analysis

        16.4.1. By Country

        16.4.2. By Material

        16.4.3. By Application

        16.4.4. By End Use

17. East Asia Cryogenic Boxes Market Analysis 2015–2021 and Forecast 2022–2032

    17.1. Introduction / Key Findings

    17.2. Historical Market Size (US$ Mn) and Volume (Mn Units) Analysis, by Market Taxonomy, 2015–2021

    17.3. Current Market Size (US$ Mn) and Volume (Mn Units) Analysis and Forecast, by Market Taxonomy, 2022–2032

        17.3.1. By Country

            17.3.1.1. China

            17.3.1.2. Japan

            17.3.1.3. South Korea

        17.3.2. By Material

        17.3.3. By Application

        17.3.4. By End Use

    17.4. Market Attractiveness Analysis

        17.4.1. By Country

        17.4.2. By Material

        17.4.3. By Application

        17.4.4. By End Use

18. South Asia Cryogenic Boxes Market Analysis 2015–2021 and Forecast 2022–2032

    18.1. Introduction / Key Findings

    18.2. Historical Market Size (US$ Mn) and Volume (Mn Units) Analysis, by Market Taxonomy, 2015–2021

    18.3. Current Market Size (US$ Mn) and Volume (Mn Units) Analysis and Forecast, by Market Taxonomy, 2022–2032

        18.3.1. By Country

            18.3.1.1. India

            18.3.1.2. Thailand

            18.3.1.3. Indonesia

            18.3.1.4. Malaysia

            18.3.1.5. Rest of South Asia

        18.3.2. By Material

        18.3.3. By Application

        18.3.4. By End Use

    18.4. Market Attractiveness Analysis

        18.4.1. By Country

        18.4.2. By Material

        18.4.3. By Application

        18.4.4. By End Use

19. Oceania Cryogenic Boxes Market Analysis 2015–2021 and Forecast 2022–2032

    19.1. Introduction / Key Findings

    19.2. Historical Market Size (US$ Mn) and Volume (Mn Units) Analysis, by Market Taxonomy, 2015–2021

    19.3. Current Market Size (US$ Mn) and Volume (Mn Units) Analysis and Forecast, by Market Taxonomy, 2022–2032

        19.3.1. By Country

            19.3.1.1. Australia

            19.3.1.2. New Zealand

        19.3.2. By Material

        19.3.3. By Application

        19.3.4. By End Use

    19.4. Market Attractiveness Analysis

        19.4.1. By Country

        19.4.2. By Material

        19.4.3. By Application

        19.4.4. By End Use

20. Country wise Cryogenic Boxes Market Analysis 

    20.1. United States (US) Cryogenic Boxes Market Analysis

        20.1.1. By Material

        20.1.2. By Application

        20.1.3. By End Use

    20.2. Canada Cryogenic Boxes Market Analysis

        20.2.1. By Material

        20.2.2. By Application

        20.2.3. By End Use

    20.3. Brazil Cryogenic Boxes Market Analysis

        20.3.1. By Material

        20.3.2. By Application

        20.3.3. By End Use

    20.4. Mexico Cryogenic Boxes Market Analysis

        20.4.1. By Material

        20.4.2. By Application

        20.4.3. By End Use

    20.5. Germany Cryogenic Boxes Market Analysis

        20.5.1. By Material

        20.5.2. By Application

        20.5.3. By End Use

    20.6. Italy Cryogenic Boxes Market Analysis

        20.6.1. By Material

        20.6.2. By Application

        20.6.3. By End Use

    20.7. France Cryogenic Boxes Market Analysis

        20.7.1. By Material

        20.7.2. By Application

        20.7.3. By End Use

    20.8. U.K. Cryogenic Boxes Market Analysis

        20.8.1. By Material

        20.8.2. By Application

        20.8.3. By End Use

    20.9. Spain Cryogenic Boxes Market Analysis

        20.9.1. By Material

        20.9.2. By Application

        20.9.3. By End Use

    20.10. Russia Cryogenic Boxes Market Analysis

        20.10.1. By Material

        20.10.2. By Application

        20.10.3. By End Use

    20.11. China Cryogenic Boxes Market Analysis

        20.11.1. By Material

        20.11.2. By Application

        20.11.3. By End Use

    20.12. Japan Cryogenic Boxes Market Analysis

        20.12.1. By Application

        20.12.2. By Material

        20.12.3. By End Use

    20.13. India Cryogenic Boxes Market Analysis

        20.13.1. By Material

        20.13.2. By Application

        20.13.3. By End Use

    20.14. GCC Countries Cryogenic Boxes Market Analysis

        20.14.1. By Material

        20.14.2. By Application

        20.14.3. By End Use

    20.15. Australia Cryogenic Boxes Market Analysis

        20.15.1. By Material

        20.15.2. By Application

        20.15.3. By End Use

21. Market Structure Analysis

    21.1. Market Analysis, by Tier of Companies (Cryogenic Boxes )

    21.2. Market Share Analysis of Top Players

    21.3. Market Presence Analysis

22. Competition Analysis

    22.1. Competition Dashboard

    22.2. Competition Benchmarking

    22.3. Competition Deep Dive 

        22.3.1. Tarsons

            22.3.1.1. Overview

            22.3.1.2. Product Portfolio

            22.3.1.3. Profitability by Market Segments (Product/Channel/Region)

            22.3.1.4. Sales Footprint

            22.3.1.5. Strategy Overview

        22.3.2. Thermo Fisher Scientific Inc.

            22.3.2.1. Overview

            22.3.2.2. Product Portfolio

            22.3.2.3. Profitability by Market Segments (Product/Channel/Region)

            22.3.2.4. Sales Footprint

            22.3.2.5. Strategy Overview

        22.3.3. Cole-Parmer Instrument Company, LLC

            22.3.3.1. Overview

            22.3.3.2. Product Portfolio

            22.3.3.3. Profitability by Market Segments (Product/Channel/Region)

            22.3.3.4. Sales Footprint

            22.3.3.5. Strategy Overview

        22.3.4. Merck KGaA

            22.3.4.1. Overview

            22.3.4.2. Product Portfolio

            22.3.4.3. Profitability by Market Segments (Product/Channel/Region)

            22.3.4.4. Sales Footprint

            22.3.4.5. Strategy Overview

        22.3.5. Ratiolab

            22.3.5.1. Overview

            22.3.5.2. Product Portfolio

            22.3.5.3. Profitability by Market Segments (Product/Channel/Region)

            22.3.5.4. Sales Footprint

            22.3.5.5. Strategy Overview

        22.3.6. BIOLOGIX GROUP LTD

            22.3.6.1. Overview

            22.3.6.2. Product Portfolio

            22.3.6.3. Profitability by Market Segments (Product/Channel/Region)

            22.3.6.4. Sales Footprint

            22.3.6.5. Strategy Overview

        22.3.7. Heathrow Scientific

            22.3.7.1. Overview

            22.3.7.2. Product Portfolio

            22.3.7.3. Profitability by Market Segments (Product/Channel/Region)

            22.3.7.4. Sales Footprint

            22.3.7.5. Strategy Overview

        22.3.8. Bioline Technologies

            22.3.8.1. Overview

            22.3.8.2. Product Portfolio

            22.3.8.3. Profitability by Market Segments (Product/Channel/Region)

            22.3.8.4. Sales Footprint

            22.3.8.5. Strategy Overview

        22.3.9. TENAK A/S

            22.3.9.1. Overview

            22.3.9.2. Product Portfolio

            22.3.9.3. Profitability by Market Segments (Product/Channel/Region)

            22.3.9.4. Sales Footprint

            22.3.9.5. Strategy Overview

        22.3.10. Deluxe Scientific Surgico Private Limited

            22.3.10.1. Overview

            22.3.10.2. Product Portfolio

            22.3.10.3. Profitability by Market Segments (Product/Channel/Region)

            22.3.10.4. Sales Footprint

            22.3.10.5. Strategy Overview

        22.3.11. CAPP

            22.3.11.1. Overview

            22.3.11.2. Product Portfolio

            22.3.11.3. Profitability by Market Segments (Product/Channel/Region)

            22.3.11.4. Sales Footprint

            22.3.11.5. Strategy Overview

        22.3.12. Eppendorf SE

            22.3.12.1. Overview

            22.3.12.2. Product Portfolio

            22.3.12.3. Profitability by Market Segments (Product/Channel/Region)

            22.3.12.4. Sales Footprint

            22.3.12.5. Strategy Overview

        22.3.13. GENAXXON bioscience

            22.3.13.1. Overview

            22.3.13.2. Product Portfolio

            22.3.13.3. Profitability by Market Segments (Product/Channel/Region)

            22.3.13.4. Sales Footprint

            22.3.13.5. Strategy Overview

        22.3.14. Glassco

            22.3.14.1. Overview

            22.3.14.2. Product Portfolio

            22.3.14.3. Profitability by Market Segments (Product/Channel/Region)

            22.3.14.4. Sales Footprint

            22.3.14.5. Strategy Overview

        22.3.15. AHN Biotechnologie GmbH

            22.3.15.1. Overview

            22.3.15.2. Product Portfolio

            22.3.15.3. Profitability by Market Segments (Product/Channel/Region)

            22.3.15.4. Sales Footprint

            22.3.15.5. Strategy Overview

23. Assumptions and Acronyms Used

24. Research Methodology

Don't pay for what you don't need

Customize your report by selecting specific countries or regions and save 30%!

List of Tables

Table 1: Global Cryogenic Boxes Market Value (US$ Mn) by Material, 2015H-2032F

Table 2: Global Cryogenic Boxes Market Volume (Mn Units) by Material, 2015H-2032F

Table 3: Global Cryogenic Boxes Market Value (US$ Mn) by Application, 2015H-2032F

Table 4: Global Cryogenic Boxes Market Volume (Mn Units) by Application, 2015H-2032F

Table 5: Global Cryogenic Boxes Market Value (US$ Mn) by End Use, 2015H-2032F

Table 6: Global Cryogenic Boxes Market Volume (Mn Units) by End Use, 2015H-2032F

Table 7: Global Cryogenic Boxes Market Value (US$ Mn) by Region, 2015H-2032F

Table 8: Global Cryogenic Boxes Market Volume (Mn Units) by Region, 2015H-2032F

Table 9: North America Cryogenic Boxes Market Value (US$ Mn) by Material, 2015H-2032F

Table 10: North America Cryogenic Boxes Market Volume (Mn Units) by Material, 2015H-2032F

Table 11: North America Cryogenic Boxes Market Value (US$ Mn) by Application, 2015H-2032F

Table 12: North America Cryogenic Boxes Market Volume (Mn Units) by Application, 2015H-2032F

Table 13: North America Cryogenic Boxes Market Value (US$ Mn) by End Use, 2015H-2032F

Table 14: North America Cryogenic Boxes Market Volume (Mn Units) by End Use, 2015H-2032F

Table 15: North America Cryogenic Boxes Market Value (US$ Mn) by Country, 2015H-2032F

Table 16: North America Cryogenic Boxes Market Volume (Mn Units) by Country, 2015H-2032F

Table 17: Latin America Cryogenic Boxes Market Value (US$ Mn) by Material, 2015H-2032F

Table 18: Latin America Cryogenic Boxes Market Volume (Mn Units) by Material, 2015H-2032F

Table 19: Latin America Cryogenic Boxes Market Value (US$ Mn) by Application, 2015H-2032F

Table 20: Latin America Cryogenic Boxes Market Volume (Mn Units) by Application, 2015H-2032F

Table 21: Latin America Cryogenic Boxes Market Value (US$ Mn) by End Use, 2015H-2032F

Table 22: Latin America Cryogenic Boxes Market Volume (Mn Units) by End Use, 2015H-2032F

Table 23: Latin America Cryogenic Boxes Market Value (US$ Mn) by Country, 2015H-2032F

Table 24: Latin America Cryogenic Boxes Market Volume (Mn Units) by Country, 2015H-2032F

Table 25: Europe Cryogenic Boxes Market Value (US$ Mn) by Material, 2015H-2032F

Table 26: Europe Cryogenic Boxes Market Volume (Mn Units) by Material, 2015H-2032F

Table 27: Europe Cryogenic Boxes Market Value (US$ Mn) by Application, 2015H-2032F

Table 28: Europe Cryogenic Boxes Market Volume (Mn Units) by Application, 2015H-2032F

Table 29: Europe Cryogenic Boxes Market Value (US$ Mn) by End Use, 2015H-2032F

Table 30: Europe Cryogenic Boxes Market Volume (Mn Units) by End Use, 2015H-2032F

Table 31: Europe Cryogenic Boxes Market Value (US$ Mn) by Country, 2015H-2032F

Table 32: Europe Cryogenic Boxes Market Volume (Mn Units) by Country, 2015H-2032F

Table 33: MEA Cryogenic Boxes Market Value (US$ Mn) by Material, 2015H-2032F

Table 34: MEA Cryogenic Boxes Market Volume (Mn Units) by Material, 2015H-2032F

Table 35: MEA Cryogenic Boxes Market Value (US$ Mn) by Application, 2015H-2032F

Table 36: MEA Cryogenic Boxes Market Volume (Mn Units) by Application, 2015H-2032F

Table 37: MEA Cryogenic Boxes Market Value (US$ Mn) by End Use, 2015H-2032F

Table 38: MEA Cryogenic Boxes Market Volume (Mn Units) by End Use, 2015H-2032F

Table 39: MEA Cryogenic Boxes Market Value (US$ Mn) by Country, 2015H-2032F

Table 40: MEA Cryogenic Boxes Market Volume (Mn Units) by Country, 2015H-2032F

Table 41: East Asia Cryogenic Boxes Market Value (US$ Mn) by Material, 2015H-2032F

Table 42: East Asia Cryogenic Boxes Market Volume (Mn Units) by Material, 2015H-2032F

Table 43: East Asia Cryogenic Boxes Market Value (US$ Mn) by Application, 2015H-2032F

Table 44: East Asia Cryogenic Boxes Market Volume (Mn Units) by Application, 2015H-2032F

Table 45: East Asia Cryogenic Boxes Market Value (US$ Mn) by End Use, 2015H-2032F

Table 46: East Asia Cryogenic Boxes Market Volume (Mn Units) by End Use, 2015H-2032F

Table 47: East Asia Cryogenic Boxes Market Value (US$ Mn) by Country, 2015H-2032F

Table 48: East Asia Cryogenic Boxes Market Volume (Mn Units) by Country, 2015H-2032F

Table 49: South Asia Cryogenic Boxes Market Value (US$ Mn) by Material, 2015H-2032F

Table 50: South Asia Cryogenic Boxes Market Volume (Mn Units) by Material, 2015H-2032F

Table 51: South Asia Cryogenic Boxes Market Value (US$ Mn) by Application, 2015H-2032F

Table 52: South Asia Cryogenic Boxes Market Volume (Mn Units) by Application, 2015H-2032F

Table 53: South Asia Cryogenic Boxes Market Value (US$ Mn) by End Use, 2015H-2032F

Table 54: South Asia Cryogenic Boxes Market Volume (Mn Units) by End Use, 2015H-2032F

Table 55: South Asia Cryogenic Boxes Market Value (US$ Mn) by Country, 2015H-2032F

Table 56: South Asia Cryogenic Boxes Market Volume (Mn Units) by Country, 2015H-2032F

Table 57: Oceania Cryogenic Boxes Market Value (US$ Mn) by Material, 2015H-2032F

Table 58: Oceania Cryogenic Boxes Market Volume (Mn Units) by Material, 2015H-2032F

Table 59: Oceania Cryogenic Boxes Market Value (US$ Mn) by Application, 2015H-2032F

Table 60: Oceania Cryogenic Boxes Market Volume (Mn Units) by Application, 2015H-2032F

Table 61: Oceania Cryogenic Boxes Market Value (US$ Mn) by End Use, 2015H-2032F

Table 62: Oceania Cryogenic Boxes Market Volume (Mn Units) by End Use, 2015H-2032F

Table 63: Oceania Cryogenic Boxes Market Value (US$ Mn) by Country, 2015H-2032F

Table 64: Oceania Cryogenic Boxes Market Volume (Mn Units) by Country, 2015H-2032F
Ismail Sutaria
Ismail Sutaria

Principal Consultant

Talk to Analyst

Find your sweet spots for generating winning opportunities in this market.

List of Charts

Figure 1: Global Cryogenic Boxes Market Share Analysis by Material, 2022E & 2032F

Figure 2: Global Cryogenic Boxes Market Attractiveness Analysis by Material, 2022E-2032F

Figure 3: Global Cryogenic Boxes Market Y-o-Y Analysis by Material, 2019H-2032F

Figure 4: Global Cryogenic Boxes Market Share Analysis by Application, 2022E & 2032F

Figure 5: Global Cryogenic Boxes Market Attractiveness Analysis by Application, 2022E-2032F

Figure 6: Global Cryogenic Boxes Market Y-o-Y Analysis by Application, 2019H-2032F

Figure 7: Global Cryogenic Boxes Market Share Analysis by End Use, 2022E & 2032F

Figure 8: Global Cryogenic Boxes Market Attractiveness Analysis by End Use, 2022E-2032F

Figure 9: Global Cryogenic Boxes Market Y-o-Y Analysis by End Use, 2019H-2032F

Figure 10: Global Cryogenic Boxes Market Share Analysis by Region, 2022E & 2032F

Figure 11: Global Cryogenic Boxes Market Attractiveness Analysis by Region, 2022E-2032F

Figure 12: Global Cryogenic Boxes Market Y-o-Y Analysis by Region, 2019H-2032F

Figure 13: North America Cryogenic Boxes Market Value Share Analysis by Material 2022(E)

Figure 14: North America Cryogenic Boxes Market Share Analysis by Application, 2022E & 2032F

Figure 15: North America Cryogenic Boxes Market Incremental Opportunity Analysis (US$ Mn), by End Use 2022(E)-2032(F)

Figure 16: North America Cryogenic Boxes Market Value Share Analysis by Country 2022(E)

Figure 17: Latin America Cryogenic Boxes Market Value Share Analysis by Material 2022(E)

Figure 18: Latin America Cryogenic Boxes Market Share Analysis by Application, 2022E & 2032F

Figure 19: Latin America Cryogenic Boxes Market Incremental Opportunity Analysis (US$ Mn), by End Use 2022(E)-2032(F)

Figure 20: Latin America Cryogenic Boxes Market Value Share Analysis by Country 2022(E)

Figure 21: Europe Cryogenic Boxes Market Value Share Analysis by Material 2022(E)

Figure 22: Europe Cryogenic Boxes Market Share Analysis by Application, 2022E & 2032F

Figure 23: Europe Cryogenic Boxes Market Incremental Opportunity Analysis (US$ Mn), by End Use 2022(E)-2032(F)

Figure 24: Europe Cryogenic Boxes Market Value Share Analysis by Country 2022(E)

Figure 25: MEA Cryogenic Boxes Market Value Share Analysis by Material 2022(E)

Figure 26: MEA Cryogenic Boxes Market Share Analysis by Application, 2022E & 2032F

Figure 27: MEA Cryogenic Boxes Market Incremental Opportunity Analysis (US$ Mn), by End Use 2022(E)-2032(F)

Figure 28: MEA Cryogenic Boxes Market Value Share Analysis by Country 2022(E)

Figure 29: East Asia Cryogenic Boxes Market Value Share Analysis by Material 2022(E)

Figure 30: East Asia Cryogenic Boxes Market Share Analysis by Application, 2022E & 2032F

Figure 31: East Asia Cryogenic Boxes Market Incremental Opportunity Analysis (US$ Mn), by End Use 2022(E)-2032(F)

Figure 32: East Asia Cryogenic Boxes Market Value Share Analysis by Country 2022(E)

Figure 33: South Asia Cryogenic Boxes Market Value Share Analysis by Material 2022(E)

Figure 34: South Asia Cryogenic Boxes Market Share Analysis by Application, 2022E & 2032F

Figure 35: South Asia Cryogenic Boxes Market Incremental Opportunity Analysis (US$ Mn), by End Use 2022(E)-2032(F)

Figure 36: South Asia Cryogenic Boxes Market Value Share Analysis by Country 2022(E)

Figure 37: Oceania Cryogenic Boxes Market Value Share Analysis by Material 2022(E)

Figure 38: Oceania Cryogenic Boxes Market Share Analysis by Application, 2022E & 2032F

Figure 39: Oceania Cryogenic Boxes Market Incremental Opportunity Analysis (US$ Mn), by End Use 2022(E)-2032(F)

Figure 40: Oceania Cryogenic Boxes Market Value Share Analysis by Country 2022(E)

Figure 41: United States Cryogenic Boxes Market Value Share Analysis, by Material, 2022(E)

Figure 42: United States Cryogenic Boxes Market Value Share Analysis, by Application, 2022(E) & 2032(F)

Figure 43: United States Cryogenic Boxes Market Value (US$ Mn) Analysis, by End Use, 2022(E)

Figure 44: Canada Cryogenic Boxes Market Value Share Analysis, by Material, 2022(E)

Figure 45: Canada Cryogenic Boxes Market Value Share Analysis, by Application, 2022(E) & 2032(F)

Figure 46: Canada Cryogenic Boxes Market Value (US$ Mn) Analysis, by End Use, 2022(E)

Figure 47: Brazil Cryogenic Boxes Market Value Share Analysis, by Material, 2022(E)

Figure 48: Brazil Cryogenic Boxes Market Value Share Analysis, by Application, 2022(E) & 2032(F)

Figure 49: Brazil Cryogenic Boxes Market Value (US$ Mn) Analysis, by End Use, 2022(E)

Figure 50: Mexico Cryogenic Boxes Market Value Share Analysis, by Material, 2022(E)

Figure 51: Mexico Cryogenic Boxes Market Value Share Analysis, by Application, 2022(E) & 2032(F)

Figure 52: Mexico Cryogenic Boxes Market Value (US$ Mn) Analysis, by End Use, 2022(E)

Figure 53: Germany Cryogenic Boxes Market Value Share Analysis, by Material, 2022(E)

Figure 54: Germany Cryogenic Boxes Market Value Share Analysis, by Application, 2022(E) & 2032(F)

Figure 55: Germany Cryogenic Boxes Market Value (US$ Mn) Analysis, by End Use, 2022(E)

Figure 56: Italy Cryogenic Boxes Market Value Share Analysis, by Material, 2022(E)

Figure 57: Italy Cryogenic Boxes Market Value Share Analysis, by Application, 2022(E) & 2032(F)

Figure 58: Italy Cryogenic Boxes Market Value (US$ Mn) Analysis, by End Use, 2022(E)

Figure 59: France Cryogenic Boxes Market Value Share Analysis, by Material, 2022(E)

Figure 60: France Cryogenic Boxes Market Value Share Analysis, by Application, 2022(E) & 2032(F)

Figure 61: France Cryogenic Boxes Market Value (US$ Mn) Analysis, by End Use, 2022(E)

Figure 62: U.K. Cryogenic Boxes Market Value Share Analysis, by Material, 2022(E)

Figure 63: U.K. Cryogenic Boxes Market Value Share Analysis, by Application, 2022(E) & 2032(F)

Figure 64: U.K. Cryogenic Boxes Market Value (US$ Mn) Analysis, by End Use, 2022(E)

Figure 65: Spain Cryogenic Boxes Market Value Share Analysis, by Material, 2022(E)

Figure 66: Spain Cryogenic Boxes Market Value Share Analysis, by Application, 2022(E) & 2032(F)

Figure 67: Spain Cryogenic Boxes Market Value (US$ Mn) Analysis, by End Use, 2022(E)

Figure 68: Russia Cryogenic Boxes Market Value Share Analysis, by Material, 2022(E)

Figure 69: Russia Cryogenic Boxes Market Value Share Analysis, by Application, 2022(E) & 2032(F)

Figure 70: Russia Cryogenic Boxes Market Value (US$ Mn) Analysis, by End Use, 2022(E)

Figure 71: China Cryogenic Boxes Market Value Share Analysis, by Material, 2022(E)

Figure 72: China Cryogenic Boxes Market Value Share Analysis, by Application, 2022(E) & 2032(F)

Figure 73: China Cryogenic Boxes Market Value (US$ Mn) Analysis, by End Use, 2022(E)

Figure 74: Japan Cryogenic Boxes Market Value Share Analysis, by Material, 2022(E)

Figure 75: Japan Cryogenic Boxes Market Value Share Analysis, by Application, 2022(E) & 2032(F)

Figure 76: Japan Cryogenic Boxes Market Value (US$ Mn) Analysis, by End Use, 2022(E)

Figure 77: India Cryogenic Boxes Market Value Share Analysis, by Material, 2022(E)

Figure 78: India Cryogenic Boxes Market Value Share Analysis, by Application, 2022(E) & 2032(F)

Figure 79: India Cryogenic Boxes Market Value (US$ Mn) Analysis, by End Use, 2022(E)

Figure 80: GCC Countries Cryogenic Boxes Market Value Share Analysis, by Material, 2022(E)

Figure 81: GCC Countries Cryogenic Boxes Market Value Share Analysis, by Application, 2022(E) & 2032(F)

Figure 82: GCC Countries Cryogenic Boxes Market Value (US$ Mn) Analysis, by End Use, 2022(E)

Figure 83: Australia Cryogenic Boxes Market Value Share Analysis, by Material, 2022(E)

Figure 84: Australia Cryogenic Boxes Market Value Share Analysis, by Application, 2022(E) & 2032(F)

Figure 85: Australia Cryogenic Boxes Market Value (US$ Mn) Analysis, by End Use, 2022(E)

Recommendations

Packaging

Luxury Rigid Box Market

Published : January 2024

Packaging

Corrugated Bin Boxes Market

Published : August 2023

Packaging

Corrugated Box Market

Published : March 2023

Packaging

Interlocking Boxes Market

Published : July 2022

Explore Packaging Insights

View Reports