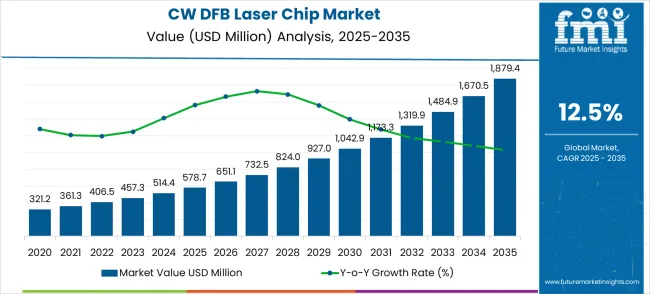
The CW DFB laser chip market is anticipated to grow from USD 578.7 million in 2025 to USD 1,879.4 million by 2035, registering a CAGR of 12.5%. The market exhibits a clear growth trajectory over the decade, with revenue rising from USD 321.2 million in 2020 to USD 578.7 million in 2025. Early-stage growth is driven by the increasing deployment of laser chips in telecommunications, optical sensing, and high-precision industrial applications. Expansion is further supported by investments in photonics infrastructure, research, and development across major markets. The steady revenue increase reflects a rising adoption rate, highlighting the market’s importance in enabling efficient optical communication, precise measurement systems, and high-performance photonics solutions. Overall, the market is clearly in a growth phase.
| Metric | Value |
|---|---|
| Estimated Value in (2025E) | USD 578.7 million |
| Forecast Value in (2035F) | USD 1,879.4 million |
| Forecast CAGR (2025 to 2035) | 12.5% |
Between 2025 and 2030, the CW DFB laser chip market grows from USD 578.7 million to USD 1,042.9 million, indicating accelerated adoption across diverse applications. During this period, industrial use in LiDAR systems, high-speed data communication, and environmental sensing contributes to revenue gains. Incremental investments in optical networking infrastructure and precision sensing devices support market expansion. The year-on-year growth trend demonstrates that demand continues to strengthen rather than stagnate, with companies increasingly deploying CW DFB laser chips to enhance system efficiency and reliability. Replacement of legacy technologies and integration into new applications further drive the market forward. The overall performance indicates a sustained growth pattern during this mid-decade phase.
From 2030 to 2035, the market value rises from USD 1,042.9 million to USD 1,879.4 million, representing the final and peak growth phase. This period reflects widespread adoption across advanced optical networks, high-capacity data communication systems, and emerging photonics applications. Growth is fueled by rising demand for high-performance laser chips that ensure precision, efficiency, and reliability in critical operations. Expansion into new geographical markets, coupled with continuous technology upgrades, reinforces market strength. The consistent year-on-year revenue increase confirms that the CW DFB laser chip market is far from stagnating or declining. The decade-long trend demonstrates sustained growth, underlining the strategic importance of these laser chips in future photonics and optical communication industries.
Market expansion is being supported by the exponential growth in data traffic and the corresponding demand for high-performance optical communication systems that can provide superior wavelength stability, narrow linewidth, and reliable output power for long-distance transmission. Modern telecommunications infrastructure is increasingly focused on optical components that can support ultra-high bandwidth requirements while maintaining signal integrity and operational efficiency. The proven capability of CW DFB laser chips to deliver exceptional spectral purity, temperature stability, and modulation performance makes them essential components of advanced optical communication systems.
The growing emphasis on 5G network deployment and edge computing infrastructure is driving demand for high-performance optical transceivers that can support massive data throughput and ultra-low latency requirements. Industry preference for laser sources that can provide consistent performance across wide temperature ranges while supporting high-speed modulation is creating opportunities for advanced DFB laser technology development. The rising influence of artificial intelligence applications and cloud computing services is also contributing to increased demand for sophisticated optical interconnect solutions across different data center and network infrastructure deployments.
The market is segmented by classification, application, and region. By classification, the market is divided into 75-100mW, 100-200mW, 200-500mW, 500-750mW, 750mW-1000mW, and other power ranges. Based on application, the market is categorized into fiber access and communication network, data center, and other applications. Regionally, the market is divided into Asia Pacific, North America, Europe, Latin America, and Middle East & Africa.
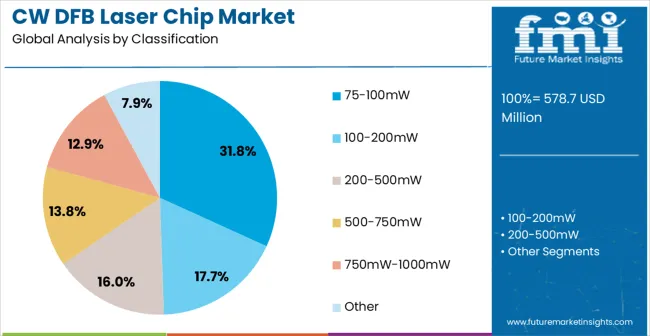
The 75-100mW classification is projected to account for 31.8% of the CW DFB laser chip market in 2025, making it the leading power range. This segment offers an optimal balance of output power, energy efficiency, and operational reliability, making it suitable for most fiber optic communication applications. It addresses standard transmission requirements while supporting robust performance and longevity. Ongoing technology improvements in wavelength stability, thermal management, and integration capabilities further strengthen its adoption. Optical system designers continue to favor this power range for its versatility, compatibility with diverse system architectures, and alignment with both current network demands and planned future deployments.
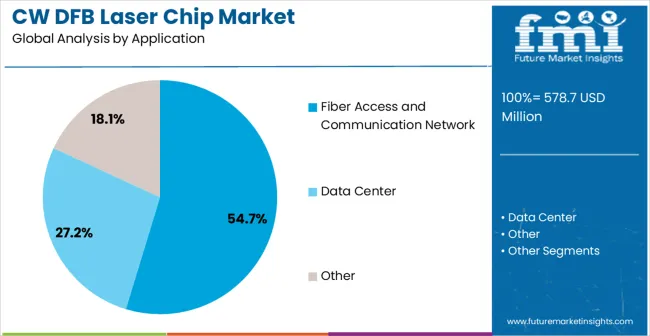
Fiber access and communication network applications are expected to represent 54.7% of CW DFB laser chip demand in 2025, making them the largest application segment. This dominance is driven by global expansion of fiber-to-the-home deployments and 5G backhaul networks requiring high-performance, reliable laser sources. CW DFB chips provide precise wavelength stability and output consistency critical for long-term network reliability. Telecommunications operators increasingly integrate these lasers into network infrastructure to support bandwidth growth and future scalability. The segment also benefits from evolving optical technologies, including advanced modulation techniques and dense wavelength-division multiplexing, ensuring that CW DFB lasers continue to meet both current and next-generation communication needs.
The CW DFB laser chip market is advancing rapidly due to exponential growth in data traffic and accelerating deployment of optical communication infrastructure. However, the market faces challenges including complex manufacturing processes, high development costs, and technical requirements for wavelength precision and thermal stability. Innovation in semiconductor processing and optical design continues to influence product development and market expansion patterns.
The growing deployment of 5G networks is creating enhanced opportunities for CW DFB laser chip integration with high-capacity backhaul and fronthaul optical networks. Advanced 5G infrastructure requires ultra-high bandwidth optical connections that can support massive data throughput with minimal latency. Edge computing deployment provides opportunities for distributed optical networks that can optimize both performance and operational efficiency across diverse geographic locations.
The continuous-wave distributed feedback (CW DFB) laser chip market is expanding due to growing demand for high-speed fiber-optic communication networks. CW DFB laser chips provide stable, narrow linewidth emission, making them critical for dense wavelength division multiplexing (DWDM) and long-haul optical networks. Telecommunications operators are upgrading infrastructure to support increasing data traffic and broadband penetration, driving the adoption of reliable and high-performance laser sources. The push for faster, low-latency communication systems in 5G, metro, and enterprise networks is further boosting market growth.
| Country | CAGR (2025-2035) |
|---|---|
| China | 16.9% |
| India | 15.6% |
| Germany | 14.4% |
| Brazil | 13.1% |
| USA | 11.9% |
| UK | 10.6% |
| Japan | 9.4% |
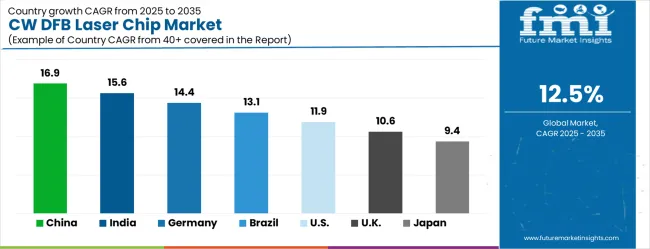
The CW DFB laser chip market is experiencing exceptional growth globally, with China leading at a 16.9% CAGR through 2035, driven by massive 5G infrastructure deployment, government support for optical communication technologies, and rapidly expanding data center construction. India follows at 15.6%, supported by growing telecommunications infrastructure development, increasing digitalization initiatives, and expanding optical network deployment. Germany shows growth at 14.4%, emphasizing precision optical technology excellence and comprehensive communication infrastructure. Brazil records 13.1% growth, focusing on expanding telecommunications modernization and growing adoption of fiber optic technologies. The USA shows 11.9% growth, representing strong investment in next-generation optical networks and data center expansion.
The report covers an in-depth analysis of 40+ countries top-performing countries are highlighted below.
China is rapidly accelerating optical communication capabilities, supporting CW DFB laser chip adoption at a CAGR of 16.9% through 2035. Expanding 5G networks and government-backed semiconductor development programs are driving strong demand for high-performance laser components. The country’s massive telecommunications infrastructure and growing optical device manufacturing capacity are creating opportunities for both domestic and international technology providers. Leading companies are establishing research, production, and distribution networks to meet rising market requirements. Industry focus includes improving transmission efficiency, enhancing network reliability, and supporting rapid data center expansion. Government incentives for 5G deployment and infrastructure investment further catalyze adoption across major telecom hubs.
India is witnessing a surge in optical communication infrastructure development, supporting CW DFB laser chip adoption at a CAGR of 15.6% through 2035. Nationwide digitalization initiatives and investment in 5G network expansion are fueling demand for precision laser components. Domestic and international technology companies are forming partnerships to deploy advanced optical systems across telecom networks. The market emphasizes efficient data transmission, enhanced network capacity, and reduced latency. Telecom operators and equipment manufacturers are increasingly integrating high-performance laser chips to support growing connectivity demands. Policy support for infrastructure modernization and investment incentives are driving accelerated adoption of CW DFB lasers across metropolitan and emerging telecom regions.
Optical communication sector in Germany is focusing on high-precision laser technology, driving CW DFB laser chip growth at a CAGR of 14.4% through 2035. Emphasis on advanced semiconductor integration and state-of-the-art telecom systems underpins strong demand for reliable and efficient laser sources. German companies prioritize process optimization, quality assurance, and technological precision while collaborating with research institutions for performance enhancements. Adoption spans network operators, equipment manufacturers, and data centers seeking cutting-edge optical solutions. Regulatory standards and advanced industrial capabilities foster the development of innovative laser technologies. Technical expertise, process control, and strategic partnerships position Germany as a leading European hub for high-performance CW DFB laser chip deployment.
Telecommunications modernization and fiber optic network expansion in Brazil are driving CW DFB laser chip adoption at a CAGR of 13.1% through 2035. The country’s focus on improving digital infrastructure and integrating advanced optical systems is promoting demand for high-performance laser components. Brazilian operators are deploying sophisticated laser technologies to enhance network bandwidth and service quality. Partnerships with international optical technology providers support knowledge transfer and localized adoption of modern laser solutions. The market emphasizes infrastructure enhancement, reliable data transmission, and network scalability across major urban and regional telecom hubs. Investments in fiber networks and optical components enable Brazil to strengthen domestic communications capabilities and prepare for next-generation network deployment.
The USA optical communication sector is driving CW DFB laser chip adoption at a CAGR of 11.9% through 2035, powered by advanced network infrastructure and extensive data center expansion. Emphasis on high-performance laser systems supports efficient long-distance data transmission and reduced latency. American telecom operators and technology companies are integrating cutting-edge optical components to maintain leadership in next-generation communication networks. Research and development programs focus on improving laser performance, system integration, and scalability. Strong industrial infrastructure combined with innovation initiatives ensures rapid deployment of CW DFB lasers across major metropolitan and cloud data hub regions. Policy support for 5G and high-speed optical networks further accelerates technology adoption nationwide.
The United Kingdom is emphasizing advanced optical network deployment, with CW DFB laser chip adoption projected at a CAGR of 10.6% through 2035. Telecom operators are integrating next-generation optical systems to optimize network performance, reduce latency, and increase bandwidth. Investment in fiber optic infrastructure and modernized communication equipment is promoting demand for high-precision laser components. Technology providers are developing innovative laser solutions to meet stringent performance and reliability standards. Government-backed innovation programs and industrial modernization initiatives accelerate the adoption of CW DFB lasers across metropolitan and regional telecom networks. Focus areas include improved network resilience, high-speed data transfer, and seamless integration with emerging 5G technologies.
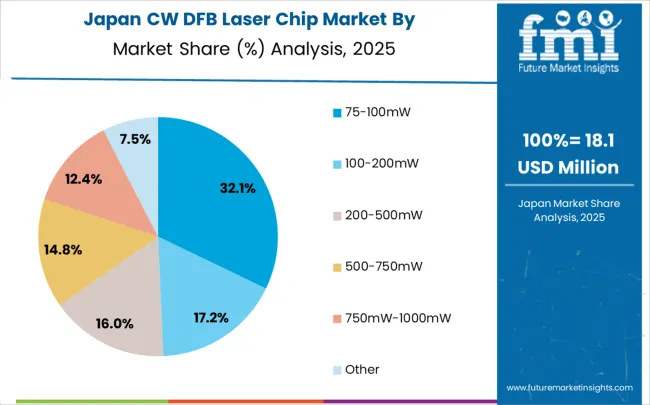
Demand for telecommunications sector in Japan is prioritizing high-precision optical engineering, driving CW DFB laser chip adoption at a CAGR of 9.4% through 2035. Leading technology companies are integrating sophisticated laser components into telecom and data center networks to ensure reliable, low-latency communications. Emphasis on precision manufacturing, innovation-driven development, and stringent quality standards is supporting the demand for advanced CW DFB lasers. Collaborative initiatives between industry and research institutions foster technology refinement, performance optimization, and process efficiency. Japan’s market focuses on energy-efficient solutions, high-speed data transmission, and enhanced network reliability to maintain global competitiveness in optical communication technologies. Strategic infrastructure investment further accelerates adoption across telecom operators and high-capacity data centers nationwide.
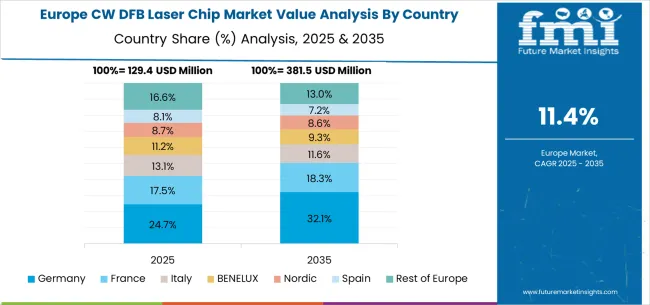
The CW DFB laser chip market in Europe is projected to grow from USD 129.4 million in 2025 to USD 381.5 million by 2035, registering a CAGR of 11.4% over the forecast period. Germany will dominate, rising from 24.7% in 2025 to 32.1% by 2035, driven by its strong optical technology ecosystem, advanced telecom infrastructure, and extensive R&D leadership.
France will hold 17.5% in 2025, growing to 18.3% by 2035, supported by network modernization projects and optical communication deployments. Italy will represent 11.2% in 2025, easing slightly to 9.3% by 2035, reflecting moderate adoption in photonics manufacturing.
The BENELUX region will capture 8.7% in 2025, holding steady at 9.3% by 2035, driven by regional telecom hubs and specialized optical device integration. The Nordic countries will contribute 8.1% in 2025, softening to 7.2% by 2035, reflecting slower adoption despite advanced digital initiatives.
Spain will account for 11.6% in 2025, declining to 10.0% by 2035, reflecting steady but slower adoption of laser-based systems. Meanwhile, the Rest of Europe will fall from 16.6% in 2025 to 13.0% by 2035, as investments concentrate in Western European telecom clusters.
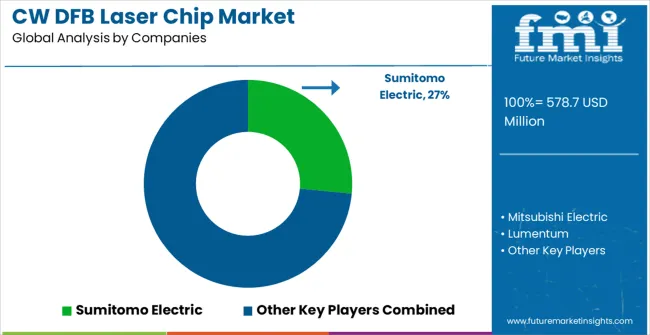
The CW DFB laser chip market is characterized by competition among specialized optical semiconductor companies, established telecommunications equipment manufacturers, and innovative photonic technology providers. Companies are investing in advanced semiconductor processing, wavelength precision enhancement, strategic partnerships, and system integration to deliver high-performance, reliable, and cost-effective CW DFB laser solutions. Technology development, manufacturing excellence, and customer support strategies are central to strengthening competitive advantages and market presence.
Sumitomo Electric leads the market with significant expertise in optical semiconductor technologies, offering comprehensive CW DFB laser chip solutions with focus on performance optimization and telecommunications applications. Mitsubishi Electric provides established optical component capabilities with emphasis on precision manufacturing and quality assurance. Lumentum focuses on advanced optical technologies with comprehensive photonic integration and system solutions. Broadcom delivers comprehensive semiconductor solutions with strong focus on optical communication and data center applications.
Yuanjie Semiconductor Technology Co., Ltd. operates with focus on optical semiconductor innovation and comprehensive laser technologies. Henan Shijia Photons Technology Co., Ltd. specializes in photonic components with emphasis on optical communication applications. Applied Optoelectronics, Inc. (AOI) provides comprehensive optical solutions with focus on telecommunications and data center markets. MACOM, LuxNet Corporation, and Xiamen Sanan Integrated Circuit Co., Ltd. provide diverse technological approaches and manufacturing capabilities to enhance overall market development and optical technology advancement.
| Items | Values |
|---|---|
| Quantitative Units (2025) | USD 578.7 million |
| Classification | 75-100mW, 100-200mW, 200-500mW, 500-750mW, 750mW-1000mW, Other |
| Application | Fiber Access and Communication Network, Data Center, Other |
| Regions Covered | Asia Pacific, North America, Europe, Latin America, Middle East & Africa |
| Countries Covered | China, India, Germany, Brazil, United States, United Kingdom, Japan and 40+ countries |
| Key Companies Profiled | Sumitomo Electric, Mitsubishi Electric, Lumentum, Broadcom, Yuanjie Semiconductor Technology Co., Ltd., Henan Shijia Photons Technology Co., Ltd., Applied Optoelectronics, Inc. (AOI), MACOM, LuxNet Corporation, Xiamen Sanan Integrated Circuit Co., Ltd. |
| Additional Attributes | Dollar sales by power range and application, regional adoption trends, competitive landscape, telecommunications partnerships, integration with optical systems, innovations in wavelength precision and power efficiency, performance analysis, and optical network optimization strategies |
The global CW DFB laser chip market is estimated to be valued at USD 578.7 million in 2025.
The market size for the CW DFB laser chip market is projected to reach USD 1,879.4 million by 2035.
The CW DFB laser chip market is expected to grow at a 12.5% CAGR between 2025 and 2035.
The key product types in CW DFB laser chip market are 75-100mw, 100-200mw, 200-500mw, 500-750mw, 750mw-1000mw and other.
In terms of application, fiber access and communication network segment to command 54.7% share in the CW DFB laser chip market in 2025.


Our Research Products

The "Full Research Suite" delivers actionable market intel, deep dives on markets or technologies, so clients act faster, cut risk, and unlock growth.

The Leaderboard benchmarks and ranks top vendors, classifying them as Established Leaders, Leading Challengers, or Disruptors & Challengers.

Locates where complements amplify value and substitutes erode it, forecasting net impact by horizon

We deliver granular, decision-grade intel: market sizing, 5-year forecasts, pricing, adoption, usage, revenue, and operational KPIs—plus competitor tracking, regulation, and value chains—across 60 countries broadly.

Spot the shifts before they hit your P&L. We track inflection points, adoption curves, pricing moves, and ecosystem plays to show where demand is heading, why it is changing, and what to do next across high-growth markets and disruptive tech

Real-time reads of user behavior. We track shifting priorities, perceptions of today’s and next-gen services, and provider experience, then pace how fast tech moves from trial to adoption, blending buyer, consumer, and channel inputs with social signals (#WhySwitch, #UX).

Partner with our analyst team to build a custom report designed around your business priorities. From analysing market trends to assessing competitors or crafting bespoke datasets, we tailor insights to your needs.
Supplier Intelligence
Discovery & Profiling
Capacity & Footprint
Performance & Risk
Compliance & Governance
Commercial Readiness
Who Supplies Whom
Scorecards & Shortlists
Playbooks & Docs
Category Intelligence
Definition & Scope
Demand & Use Cases
Cost Drivers
Market Structure
Supply Chain Map
Trade & Policy
Operating Norms
Deliverables
Buyer Intelligence
Account Basics
Spend & Scope
Procurement Model
Vendor Requirements
Terms & Policies
Entry Strategy
Pain Points & Triggers
Outputs
Pricing Analysis
Benchmarks
Trends
Should-Cost
Indexation
Landed Cost
Commercial Terms
Deliverables
Brand Analysis
Positioning & Value Prop
Share & Presence
Customer Evidence
Go-to-Market
Digital & Reputation
Compliance & Trust
KPIs & Gaps
Outputs
Full Research Suite comprises of:
Market outlook & trends analysis
Interviews & case studies
Strategic recommendations
Vendor profiles & capabilities analysis
5-year forecasts
8 regions and 60+ country-level data splits
Market segment data splits
12 months of continuous data updates
DELIVERED AS:
PDF EXCEL ONLINE
CCW Armored Cable Market Size and Share Forecast Outlook 2025 to 2035
Laboratory Glassware and Plasticware Market
DFB Narrow Linewidth Single Frequency Lasers Market Size and Share Forecast Outlook 2025 to 2035
Demand for DFB Narrow Linewidth Single Frequency Lasers in USA Size and Share Forecast Outlook 2025 to 2035
Demand for DFB Narrow Linewidth Single Frequency Lasers in UK Size and Share Forecast Outlook 2025 to 2035
Chip-on-the-Tip Endoscopes Market Size and Share Forecast Outlook 2025 to 2035
Chipless RFID Industry Analysis in United States Size and Share Forecast Outlook 2025 to 2035
Chip Resistor Market Size and Share Forecast Outlook 2025 to 2035
Chip-On-Flex Market Size and Share Forecast Outlook 2025 to 2035
Chipboard Box Market Size and Share Forecast Outlook 2025 to 2035
Chip-On-Board (COB) Light Emitting Diode (LED) Market Analysis and Forecast 2025 to 2035, By Application and Region
Chip Scale Package LED Market Insights – Trends & Forecast 2025 to 2035
Chip Warmers Market Growth – Trends & Forecast 2025 to 2035
Industry Share & Competitive Positioning in Chipboard Box Industry
Chip Antenna Market
Biochips Market Size and Share Forecast Outlook 2025 to 2035
5G Chipset Market Analysis - Growth & Forecast through 2034
Lab Chip Devices Market Size and Share Forecast Outlook 2025 to 2035
IoT Chip Market Size and Share Forecast Outlook 2025 to 2035
Microchip Electrophoresis Market Size and Share Forecast Outlook 2025 to 2035

Thank you!
You will receive an email from our Business Development Manager. Please be sure to check your SPAM/JUNK folder too.
Chat With
MaRIA