Cyber-Physical System Market Size and Share Forecast Outlook 2025 to 2035

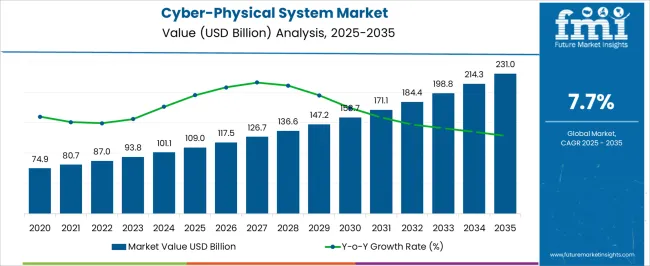
The Cyber-Physical System Market is estimated to be valued at USD 109.0 billion in 2025 and is projected to reach USD 231.0 billion by 2035, registering a compound annual growth rate (CAGR) of 7.7% over the forecast period.
Quick Stats for Cyber-Physical System Market

  • Cyber-Physical System Market Industry Value (2025): USD 109.0 billion
  • Cyber-Physical System Market Forecast Value (2035): USD 231.0 billion
  • Cyber-Physical System Market Forecast CAGR: 7.7%
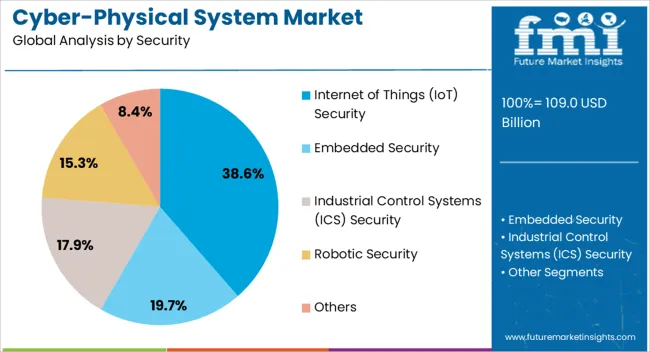
  • Leading Segment in Cyber-Physical System Market in 2025: Internet of Things (IoT) Security (38.6%)
  • Key Growth Region in Cyber-Physical System Market: North America, Asia-Pacific, Europe
  • Top Key Players in Cyber-Physical System Market: IBM Corporation, Microsoft Corporation, Dell EMC, VMware Inc., Hewlett Packard Enterprise, Schneider Electric, SAP SE, Honeywell International Inc., Hitachi Vantara, Oracle

Cyber Physical System Market Market Value Analysis

Metric Value
Cyber-Physical System Market Estimated Value in (2025 E) USD 109.0 billion
Cyber-Physical System Market Forecast Value in (2035 F) USD 231.0 billion
Forecast CAGR (2025 to 2035) 7.7%

Rationale for Segmental Growth in the Cyber-Physical System Market

The cyber-physical system (CPS) market is advancing rapidly, supported by the convergence of digital technologies with physical processes across industries. Industry reports, government initiatives, and corporate disclosures have highlighted CPS as a key enabler of smart manufacturing, intelligent infrastructure, and resilient supply chains. The rising adoption of Industry 4.0 practices, integration of IoT-enabled devices, and deployment of real-time monitoring systems are accelerating CPS implementation.

Security considerations have become increasingly critical, as connected environments present heightened risks of cyberattacks targeting operational technology. Consequently, enterprises and governments are channeling significant investment toward CPS security and data protection.

On the technology front, advances in AI, digital twins, and predictive analytics are enhancing CPS performance, driving adoption across manufacturing, energy, healthcare, and transport sectors. Future growth is expected to be driven by the scaling of cloud-based CPS platforms, expansion of smart factories, and adoption of autonomous systems, with security, software solutions, and manufacturing applications at the core of segmental expansion.
Segmental Analysis

Insights into the Security Segment: Internet of Things (IoT) Security

Cyber Physical System Market Analysis By Security

The Internet of Things (IoT) Security segment is projected to account for 38.6% of the cyber-physical system market revenue in 2025, maintaining its leadership position within the security landscape. This dominance has been supported by the proliferation of IoT devices across industrial and consumer applications, which has heightened vulnerability to cyberattacks and data breaches. Industry updates and security advisories have emphasized that IoT endpoints often serve as entry points for system compromise, driving demand for specialized CPS security frameworks.

Investment in IoT-focused encryption, authentication, and intrusion detection systems has grown, supported by regulatory requirements and international cybersecurity standards. Enterprises have prioritized IoT security as an essential layer for operational continuity, particularly in critical infrastructure sectors.

As the scale and complexity of IoT deployments increase, the IoT Security segment is expected to retain its leadership, driven by its role in mitigating systemic risks and enabling trust in connected CPS environments.
Insights into the Component Segment: Software

Cyber Physical System Market Analysis By Component

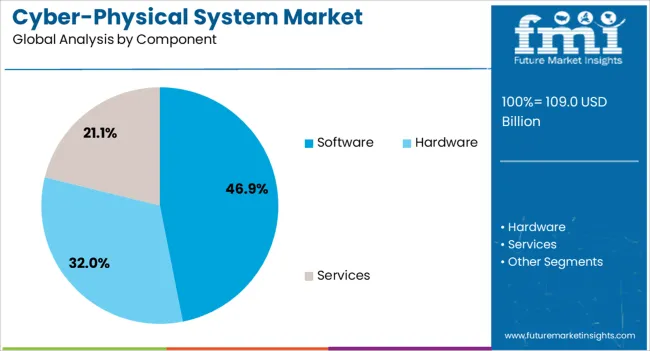
The Software segment is projected to contribute 46.9% of the cyber-physical system market revenue in 2025, establishing itself as the leading component category. Growth in this segment has been driven by the essential role of software in enabling communication, control, and optimization between physical assets and digital platforms. Advances in middleware, real-time analytics, and simulation tools have expanded the functionality of CPS, supporting predictive maintenance and autonomous decision-making.

Corporate disclosures and product launches have highlighted increasing investment in software platforms that integrate AI and machine learning to enhance system adaptability. Additionally, the flexibility of software allows scalability across industries, reducing implementation barriers and enabling customization for diverse end-use applications.

The growing demand for digital twins and virtualization technologies has reinforced software’s role at the center of CPS innovation. With continuous upgrades, open-source frameworks, and cloud-native architectures, the Software segment is expected to maintain its leadership in driving CPS adoption.
Insights into the End Use Verticals Segment: Manufacturing

Cyber Physical System Market Analysis By End Use Verticals

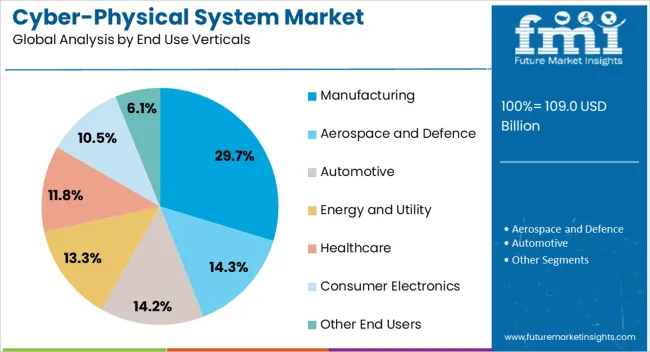
The Manufacturing segment is projected to account for 29.7% of the cyber-physical system market revenue in 2025, leading all end-use verticals. This prominence has been attributed to the integration of CPS in smart factories, where automation, robotics, and real-time monitoring are central to operational efficiency. Industry 4.0 initiatives have accelerated CPS deployment in manufacturing to optimize production lines, reduce downtime, and ensure quality assurance.

Press releases and industry case studies have noted significant investment in CPS-enabled predictive maintenance, supply chain visibility, and energy-efficient production systems. The manufacturing sector’s reliance on precision, speed, and safety has further supported adoption of CPS frameworks, particularly in automotive, electronics, and heavy machinery industries.

Additionally, the adoption of CPS has been linked to enhanced workforce safety and compliance with regulatory standards. With ongoing digital transformation initiatives and expanding adoption of autonomous and semi-autonomous production systems, the Manufacturing segment is expected to remain the most significant end-use vertical for CPS deployment.

Market Trends and Drivers Promoting the Adoption of Cyber-Physical Systems

Surging adoption of basic components of cyber-physical systems like memory units, sensors, storage devices, and monitoring devices computing units in many new sectors.

Energy and utility industries, in particular, are expected to spur substantial demand for cyber-physical systems due to their application in smart grid technology.

Cyber-physical systems have a crucial role in the development and optimization of autonomous cars and intelligent transportation systems. Increasing emphasis on raising the sales of electric vehicles is projected to fuel the demand for CPS for the creation of automated EVs.

Category-wise Cyber-Physical System Market Analysis

Embedded Security Systems is Predicted to Enjoy Wide Popularity

Embedded cyber-physical systems are slated to acquire a 38.4% share in 2025. Factors governing the rapid sales of this security type include reducing prices of networking devices and IoT sensors are boosting the adoption of in-built or embedded security systems.

Leading Security Segment Embedded Security
Value Share (2025) 38.4%

Surging demand for cyber-physical embedded systems in EVs is further spurring the sales of cyber-physical systems in the automotive sector.

Automotive Segment is Predicted to Account for Higher Demand for Cyber-Physical Systems

The automotive sector is projected to register a 37.7% share of the total revenue generated in 2025. Additionally, the segment is anticipated to observe lucrative growth over the forecast period.

Leading End Use Vertical Automotive
Value Share (2025) 37.7%

Rising demand for cyber-physical systems in Electronic Control Units (ECUs) in automotive is pushing the sales of cyber-physical systems. ECUs are increasingly deployed to control different mechanical subsystems like engines, brakes, steering, and suspension. This ensures maximum utilization of fuel or energy in automotives by discarding the use of surplus energy.
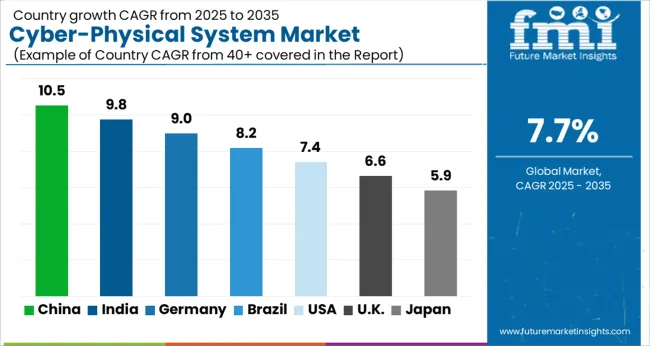
Global Cyber-Physical System Industry Demand Analysis by Country

Cyber Physical System Market Cagr Analysis By Country

Quantitative insights related to growth projections of cyber-physical systems in the top five countries point to an interesting future for industry vendors. Companies are expected to experience robust growth in the United States, China, Australia and New Zealand. The last one is on the radar of several firms due to higher growth prospects emerging in Australia and New Zealand.

Based on the proceeding table, it can be concluded that Asia Pacific, except Japan and North America, are going to be destination areas for leading providers of cyber-physical systems.

Debut of Multidisciplinary Projects to Strengthen CPS is Fueling United States Market

The cyber-physical system market in the United States is flourishing at a 15.1% CAGR over the forecast period. Advanced infrastructure for the adoption of progressive technologies like artificial intelligence and IoT in several industries is building a conducive environment for the use of cyber-physical systems.

Significant presence of several world-renowned technology and IT companies, such as Microsoft, IBM, and others, in the United States is increasing the competitiveness of the industry.

Recently, success patterns have emerged for creating cyber-physical systems with Agile that are advancing the industry's growth. The market is expected to benefit from the launch of multidisciplinary projects to simulate, model, and analyze cyber-physical systems (CPS), to make these systems more robust and their analysis more effective and scalable. In April 2025, for instance, the Defense Award introduced the Purdue project to make cyber-physical systems stronger.
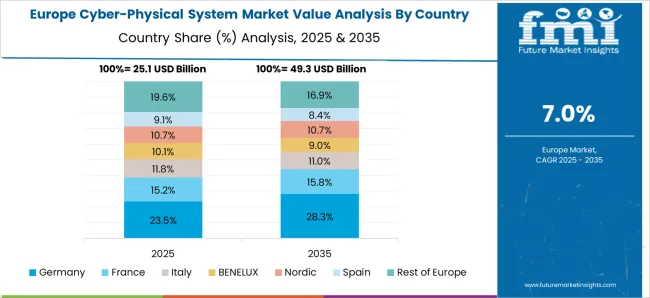
Industry 4.0 to Stir Demand for Cyber-security Systems in Germany

Cyber Physical System Market Europe Country Market Share Analysis, 2025 & 2035

The demand for cyber-physical systems in Germany is increasing at a sluggish 3.3% CAGR during the forecast period. Despite the present maturity levels in Germany, the regional market is widely recognized as a prominent player in the whole of Europe.

The presence of developed infrastructure for automotive, manufacturing, energy, and utility sectors is increasing the adoption of cyber-physical systems in Germany.

Latest developments, such as the initiation of the Industry 4.0 project by the German government, are expected to improve the scope of cyber-physical systems in the country. IoT and cyber-physical systems form the technological base for this project.

Surging Risks to National Safety Elevating the Horizon of Cyber-physical Systems in China

In China, the cyber-physical system industry is projected to expand at a CAGR of 14.5% over the next ten years. The surging adoption of cyber-physical systems is fast replacing traditional industrial systems for streamlined integration of autonomous operations.

China’s leading position as a supplier and manufacturer of cyber-physical system hardware in the Asia Pacific is driven by the strong electronics manufacturing sector and low-cost labor availability.

Rising risks to national safety are further pushing cybersecurity experts and researchers to engage in an endless race to deal with digital vulnerabilities emerging in the private and public sectors.

Several Sectors in Japan to Observe Demand for Cyber-physical Systems

Demand for cyber-physical system solutions and services in Japan is expected to register a steady 3.6% CAGR during the studied period. Growing demand for cyber-physical system services in various sectors, such as smart grids, smart factories, smart healthcare, and a few other industries.

Robust presence of favorable policies, MNCs, and reputable supplier network supporting the CPS industry.

Australia and New Zealand Together are Emerging as an Opportunity Playground for Players

The cyber-physical system market in Australia and New Zealand is poised to offer a lucrative environment for players. The industry is expected to expand at a robust 17% CAGR over the stipulated period.

The continuous entry of international cyber-physical system vendors and manufacturers in these two countries is enhancing the industry’s growth prospects. Additionally, strong investment by the government to promote IR 4.0 and boost the application of other future-oriented technologies across different sectors is accelerating the use of CPS.
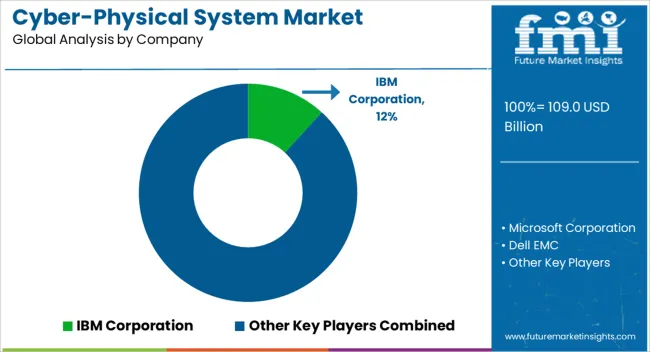
Competitive Analysis Of The Cyber-physical System Sector

Cyber Physical System Market Analysis By Company

Cyber-physical system sector is highly consolidated as few leading technology firms continue to wield their power over the global market. Several top manufacturers are heavily investing in research and development practices and product innovation to broaden the use cases of cyber-physical systems.

Research activities are also aimed at advancing core technologies like artificial intelligence (AI), the Internet of Things (IoT), and machine learning (ML). New players are attempting to accelerate their business transformation, facilitated by the latest technology, while increasing their customer base.

CPS vendors are collaborating with research institutions and solution providers to increase their industry share. This is resulting in faster development cycles, knowledge sharing, and integration of different platforms to provide comprehensive CPS solutions.

Latest Developments Uplifting the Cyber-Physical System Industry

  • Dataminr, a United States-based AI company, declared in April 2025 that the Cyber-physical A2I Partner Coalition is going to be introduced at the coming RSA Conference. The coalition is aimed at creating and sharing best practices to help businesses utilize AI advancements to prepare for convergent cyber-physical threats quickly.
  • DSIT, an abbreviation of the Department for Science, Innovation and Technology is offering resources for the setting up of the National Cyber-Physical Infrastructure (NCPI) ecosystem in the United Kingdom. The collaboration was made public in October 2025. It expands on the Cyber-physical Infrastructure Consultation that the United Kingdom government delivered in March 2025.

Enlisted Below are Leading Cyber-Physical System Players

  • IBM Corporation
  • Microsoft Corporation
  • Dell EMC
  • Broadcom Inc.
  • Hewlett Packard Enterprise
  • Schneider Electric
  • SAP SE
  • Honeywell International Inc.
  • Hitachi Vantara
  • Oracle
  • Others

Market Segmentation of Cyber-Physical System

By Security:

Based on security, the industry is divided into embedded security, industrial control systems (ICS) security, robotic security, Internet of Things (IoT) security, and others

By Component:

By component, the industry is categorized into hardware, software, and services

By End Use Verticals:

Various end-use verticals that deploy cyber-physical systems are aerospace and defense, automotive, energy and utility, healthcare, manufacturing, consumer electronics, and others

By Region:

Industry analysis has been carried out in key countries of North America, Europe, Asia Pacific, Middle East and Africa, and Latin America

Frequently Asked Questions

How big is the cyber-physical system market in 2025?

The global cyber-physical system market is estimated to be valued at USD 109.0 billion in 2025.

What will be the size of cyber-physical system market in 2035?

The market size for the cyber-physical system market is projected to reach USD 231.0 billion by 2035.

How much will be the cyber-physical system market growth between 2025 and 2035?

The cyber-physical system market is expected to grow at a 7.7% CAGR between 2025 and 2035.

What are the key product types in the cyber-physical system market?

The key product types in cyber-physical system market are internet of things (iot) security, embedded security, industrial control systems (ics) security, robotic security and others.

Which component segment to contribute significant share in the cyber-physical system market in 2025?

In terms of component, software segment to command 46.9% share in the cyber-physical system market in 2025.

Table of Content

  1. Executive Summary
    • Global Market Outlook
    • Demand-side Trends
    • Supply-side Trends
    • Technology Roadmap Analysis
    • Analysis and Recommendations
  2. Market Overview
    • Market Coverage / Taxonomy
    • Market Definition / Scope / Limitations
  3. Market Background
    • Market Dynamics
      • Drivers
      • Restraints
      • Opportunity
      • Trends
    • Scenario Forecast
      • Demand in Optimistic Scenario
      • Demand in Likely Scenario
      • Demand in Conservative Scenario
    • Opportunity Map Analysis
    • Product Life Cycle Analysis
    • Supply Chain Analysis
    • Investment Feasibility Matrix
    • Value Chain Analysis
    • PESTLE and Porter’s Analysis
    • Regulatory Landscape
    • Regional Parent Market Outlook
    • Production and Consumption Statistics
    • Import and Export Statistics
  4. Global Market Analysis 2020 to 2024 and Forecast, 2025 to 2035
    • Historical Market Size Value (USD Million) Analysis, 2020 to 2024
    • Current and Future Market Size Value (USD Million) Projections, 2025 to 2035
      • Y-o-Y Growth Trend Analysis
      • Absolute $ Opportunity Analysis
  5. Global Market Pricing Analysis 2020 to 2024 and Forecast 2025 to 2035
  6. Global Market Analysis 2020 to 2024 and Forecast 2025 to 2035, By Security
    • Introduction / Key Findings
    • Historical Market Size Value (USD Million) Analysis By Security , 2020 to 2024
    • Current and Future Market Size Value (USD Million) Analysis and Forecast By Security , 2025 to 2035
      • Internet of Things (IoT) Security
      • Embedded Security
      • Industrial Control Systems (ICS) Security
      • Robotic Security
      • Others
    • Y-o-Y Growth Trend Analysis By Security , 2020 to 2024
    • Absolute $ Opportunity Analysis By Security , 2025 to 2035
  7. Global Market Analysis 2020 to 2024 and Forecast 2025 to 2035, By Component
    • Introduction / Key Findings
    • Historical Market Size Value (USD Million) Analysis By Component, 2020 to 2024
    • Current and Future Market Size Value (USD Million) Analysis and Forecast By Component, 2025 to 2035
      • Software
      • Hardware
      • Services
    • Y-o-Y Growth Trend Analysis By Component, 2020 to 2024
    • Absolute $ Opportunity Analysis By Component, 2025 to 2035
  8. Global Market Analysis 2020 to 2024 and Forecast 2025 to 2035, By End Use Verticals
    • Introduction / Key Findings
    • Historical Market Size Value (USD Million) Analysis By End Use Verticals, 2020 to 2024
    • Current and Future Market Size Value (USD Million) Analysis and Forecast By End Use Verticals, 2025 to 2035
      • Manufacturing
      • Aerospace and Defence
      • Automotive
      • Energy and Utility
      • Healthcare
      • Consumer Electronics
      • Other End Users
    • Y-o-Y Growth Trend Analysis By End Use Verticals, 2020 to 2024
    • Absolute $ Opportunity Analysis By End Use Verticals, 2025 to 2035
  9. Global Market Analysis 2020 to 2024 and Forecast 2025 to 2035, By Region
    • Introduction
    • Historical Market Size Value (USD Million) Analysis By Region, 2020 to 2024
    • Current Market Size Value (USD Million) Analysis and Forecast By Region, 2025 to 2035
      • North America
      • Latin America
      • Western Europe
      • Eastern Europe
      • East Asia
      • South Asia and Pacific
      • Middle East & Africa
    • Market Attractiveness Analysis By Region
  10. North America Market Analysis 2020 to 2024 and Forecast 2025 to 2035, By Country
    • Historical Market Size Value (USD Million) Trend Analysis By Market Taxonomy, 2020 to 2024
    • Market Size Value (USD Million) Forecast By Market Taxonomy, 2025 to 2035
      • By Country
        • USA
        • Canada
        • Mexico
      • By Security
      • By Component
      • By End Use Verticals
    • Market Attractiveness Analysis
      • By Country
      • By Security
      • By Component
      • By End Use Verticals
    • Key Takeaways
  11. Latin America Market Analysis 2020 to 2024 and Forecast 2025 to 2035, By Country
    • Historical Market Size Value (USD Million) Trend Analysis By Market Taxonomy, 2020 to 2024
    • Market Size Value (USD Million) Forecast By Market Taxonomy, 2025 to 2035
      • By Country
        • Brazil
        • Chile
        • Rest of Latin America
      • By Security
      • By Component
      • By End Use Verticals
    • Market Attractiveness Analysis
      • By Country
      • By Security
      • By Component
      • By End Use Verticals
    • Key Takeaways
  12. Western Europe Market Analysis 2020 to 2024 and Forecast 2025 to 2035, By Country
    • Historical Market Size Value (USD Million) Trend Analysis By Market Taxonomy, 2020 to 2024
    • Market Size Value (USD Million) Forecast By Market Taxonomy, 2025 to 2035
      • By Country
        • Germany
        • UK
        • Italy
        • Spain
        • France
        • Nordic
        • BENELUX
        • Rest of Western Europe
      • By Security
      • By Component
      • By End Use Verticals
    • Market Attractiveness Analysis
      • By Country
      • By Security
      • By Component
      • By End Use Verticals
    • Key Takeaways
  13. Eastern Europe Market Analysis 2020 to 2024 and Forecast 2025 to 2035, By Country
    • Historical Market Size Value (USD Million) Trend Analysis By Market Taxonomy, 2020 to 2024
    • Market Size Value (USD Million) Forecast By Market Taxonomy, 2025 to 2035
      • By Country
        • Russia
        • Poland
        • Hungary
        • Balkan & Baltic
        • Rest of Eastern Europe
      • By Security
      • By Component
      • By End Use Verticals
    • Market Attractiveness Analysis
      • By Country
      • By Security
      • By Component
      • By End Use Verticals
    • Key Takeaways
  14. East Asia Market Analysis 2020 to 2024 and Forecast 2025 to 2035, By Country
    • Historical Market Size Value (USD Million) Trend Analysis By Market Taxonomy, 2020 to 2024
    • Market Size Value (USD Million) Forecast By Market Taxonomy, 2025 to 2035
      • By Country
        • China
        • Japan
        • South Korea
      • By Security
      • By Component
      • By End Use Verticals
    • Market Attractiveness Analysis
      • By Country
      • By Security
      • By Component
      • By End Use Verticals
    • Key Takeaways
  15. South Asia and Pacific Market Analysis 2020 to 2024 and Forecast 2025 to 2035, By Country
    • Historical Market Size Value (USD Million) Trend Analysis By Market Taxonomy, 2020 to 2024
    • Market Size Value (USD Million) Forecast By Market Taxonomy, 2025 to 2035
      • By Country
        • India
        • ASEAN
        • Australia & New Zealand
        • Rest of South Asia and Pacific
      • By Security
      • By Component
      • By End Use Verticals
    • Market Attractiveness Analysis
      • By Country
      • By Security
      • By Component
      • By End Use Verticals
    • Key Takeaways
  16. Middle East & Africa Market Analysis 2020 to 2024 and Forecast 2025 to 2035, By Country
    • Historical Market Size Value (USD Million) Trend Analysis By Market Taxonomy, 2020 to 2024
    • Market Size Value (USD Million) Forecast By Market Taxonomy, 2025 to 2035
      • By Country
        • Kingdom of Saudi Arabia
        • Other GCC Countries
        • Turkiye
        • South Africa
        • Other African Union
        • Rest of Middle East & Africa
      • By Security
      • By Component
      • By End Use Verticals
    • Market Attractiveness Analysis
      • By Country
      • By Security
      • By Component
      • By End Use Verticals
    • Key Takeaways
  17. Key Countries Market Analysis
    • USA
      • Pricing Analysis
      • Market Share Analysis, 2024
        • By Security
        • By Component
        • By End Use Verticals
    • Canada
      • Pricing Analysis
      • Market Share Analysis, 2024
        • By Security
        • By Component
        • By End Use Verticals
    • Mexico
      • Pricing Analysis
      • Market Share Analysis, 2024
        • By Security
        • By Component
        • By End Use Verticals
    • Brazil
      • Pricing Analysis
      • Market Share Analysis, 2024
        • By Security
        • By Component
        • By End Use Verticals
    • Chile
      • Pricing Analysis
      • Market Share Analysis, 2024
        • By Security
        • By Component
        • By End Use Verticals
    • Germany
      • Pricing Analysis
      • Market Share Analysis, 2024
        • By Security
        • By Component
        • By End Use Verticals
    • UK
      • Pricing Analysis
      • Market Share Analysis, 2024
        • By Security
        • By Component
        • By End Use Verticals
    • Italy
      • Pricing Analysis
      • Market Share Analysis, 2024
        • By Security
        • By Component
        • By End Use Verticals
    • Spain
      • Pricing Analysis
      • Market Share Analysis, 2024
        • By Security
        • By Component
        • By End Use Verticals
    • France
      • Pricing Analysis
      • Market Share Analysis, 2024
        • By Security
        • By Component
        • By End Use Verticals
    • India
      • Pricing Analysis
      • Market Share Analysis, 2024
        • By Security
        • By Component
        • By End Use Verticals
    • ASEAN
      • Pricing Analysis
      • Market Share Analysis, 2024
        • By Security
        • By Component
        • By End Use Verticals
    • Australia & New Zealand
      • Pricing Analysis
      • Market Share Analysis, 2024
        • By Security
        • By Component
        • By End Use Verticals
    • China
      • Pricing Analysis
      • Market Share Analysis, 2024
        • By Security
        • By Component
        • By End Use Verticals
    • Japan
      • Pricing Analysis
      • Market Share Analysis, 2024
        • By Security
        • By Component
        • By End Use Verticals
    • South Korea
      • Pricing Analysis
      • Market Share Analysis, 2024
        • By Security
        • By Component
        • By End Use Verticals
    • Russia
      • Pricing Analysis
      • Market Share Analysis, 2024
        • By Security
        • By Component
        • By End Use Verticals
    • Poland
      • Pricing Analysis
      • Market Share Analysis, 2024
        • By Security
        • By Component
        • By End Use Verticals
    • Hungary
      • Pricing Analysis
      • Market Share Analysis, 2024
        • By Security
        • By Component
        • By End Use Verticals
    • Kingdom of Saudi Arabia
      • Pricing Analysis
      • Market Share Analysis, 2024
        • By Security
        • By Component
        • By End Use Verticals
    • Turkiye
      • Pricing Analysis
      • Market Share Analysis, 2024
        • By Security
        • By Component
        • By End Use Verticals
    • South Africa
      • Pricing Analysis
      • Market Share Analysis, 2024
        • By Security
        • By Component
        • By End Use Verticals
  18. Market Structure Analysis
    • Competition Dashboard
    • Competition Benchmarking
    • Market Share Analysis of Top Players
      • By Regional
      • By Security
      • By Component
      • By End Use Verticals
  19. Competition Analysis
    • Competition Deep Dive
      • IBM Corporation
        • Overview
        • Product Portfolio
        • Profitability by Market Segments (Product/Age /Sales Channel/Region)
        • Sales Footprint
        • Strategy Overview
          • Marketing Strategy
          • Product Strategy
          • Channel Strategy
      • Microsoft Corporation
      • Dell EMC
      • VMware Inc.
      • Hewlett Packard Enterprise
      • Schneider Electric
      • SAP SE
      • Honeywell International Inc.
      • Hitachi Vantara
      • Oracle
  20. Assumptions & Acronyms Used
  21. Research Methodology

List of Tables

  • Table 1: Global Market Value (USD Million) Forecast by Region, 2020 to 2035
  • Table 2: Global Market Value (USD Million) Forecast by Security , 2020 to 2035
  • Table 3: Global Market Value (USD Million) Forecast by Component, 2020 to 2035
  • Table 4: Global Market Value (USD Million) Forecast by End Use Verticals, 2020 to 2035
  • Table 5: North America Market Value (USD Million) Forecast by Country, 2020 to 2035
  • Table 6: North America Market Value (USD Million) Forecast by Security , 2020 to 2035
  • Table 7: North America Market Value (USD Million) Forecast by Component, 2020 to 2035
  • Table 8: North America Market Value (USD Million) Forecast by End Use Verticals, 2020 to 2035
  • Table 9: Latin America Market Value (USD Million) Forecast by Country, 2020 to 2035
  • Table 10: Latin America Market Value (USD Million) Forecast by Security , 2020 to 2035
  • Table 11: Latin America Market Value (USD Million) Forecast by Component, 2020 to 2035
  • Table 12: Latin America Market Value (USD Million) Forecast by End Use Verticals, 2020 to 2035
  • Table 13: Western Europe Market Value (USD Million) Forecast by Country, 2020 to 2035
  • Table 14: Western Europe Market Value (USD Million) Forecast by Security , 2020 to 2035
  • Table 15: Western Europe Market Value (USD Million) Forecast by Component, 2020 to 2035
  • Table 16: Western Europe Market Value (USD Million) Forecast by End Use Verticals, 2020 to 2035
  • Table 17: Eastern Europe Market Value (USD Million) Forecast by Country, 2020 to 2035
  • Table 18: Eastern Europe Market Value (USD Million) Forecast by Security , 2020 to 2035
  • Table 19: Eastern Europe Market Value (USD Million) Forecast by Component, 2020 to 2035
  • Table 20: Eastern Europe Market Value (USD Million) Forecast by End Use Verticals, 2020 to 2035
  • Table 21: East Asia Market Value (USD Million) Forecast by Country, 2020 to 2035
  • Table 22: East Asia Market Value (USD Million) Forecast by Security , 2020 to 2035
  • Table 23: East Asia Market Value (USD Million) Forecast by Component, 2020 to 2035
  • Table 24: East Asia Market Value (USD Million) Forecast by End Use Verticals, 2020 to 2035
  • Table 25: South Asia and Pacific Market Value (USD Million) Forecast by Country, 2020 to 2035
  • Table 26: South Asia and Pacific Market Value (USD Million) Forecast by Security , 2020 to 2035
  • Table 27: South Asia and Pacific Market Value (USD Million) Forecast by Component, 2020 to 2035
  • Table 28: South Asia and Pacific Market Value (USD Million) Forecast by End Use Verticals, 2020 to 2035
  • Table 29: Middle East & Africa Market Value (USD Million) Forecast by Country, 2020 to 2035
  • Table 30: Middle East & Africa Market Value (USD Million) Forecast by Security , 2020 to 2035
  • Table 31: Middle East & Africa Market Value (USD Million) Forecast by Component, 2020 to 2035
  • Table 32: Middle East & Africa Market Value (USD Million) Forecast by End Use Verticals, 2020 to 2035

List of Figures

  • Figure 1: Global Market Pricing Analysis
  • Figure 2: Global Market Value (USD Million) Forecast 2020-2035
  • Figure 3: Global Market Value Share and BPS Analysis by Security , 2025 and 2035
  • Figure 4: Global Market Y-o-Y Growth Comparison by Security , 2025-2035
  • Figure 5: Global Market Attractiveness Analysis by Security
  • Figure 6: Global Market Value Share and BPS Analysis by Component, 2025 and 2035
  • Figure 7: Global Market Y-o-Y Growth Comparison by Component, 2025-2035
  • Figure 8: Global Market Attractiveness Analysis by Component
  • Figure 9: Global Market Value Share and BPS Analysis by End Use Verticals, 2025 and 2035
  • Figure 10: Global Market Y-o-Y Growth Comparison by End Use Verticals, 2025-2035
  • Figure 11: Global Market Attractiveness Analysis by End Use Verticals
  • Figure 12: Global Market Value (USD Million) Share and BPS Analysis by Region, 2025 and 2035
  • Figure 13: Global Market Y-o-Y Growth Comparison by Region, 2025-2035
  • Figure 14: Global Market Attractiveness Analysis by Region
  • Figure 15: North America Market Incremental Dollar Opportunity, 2025-2035
  • Figure 16: Latin America Market Incremental Dollar Opportunity, 2025-2035
  • Figure 17: Western Europe Market Incremental Dollar Opportunity, 2025-2035
  • Figure 18: Eastern Europe Market Incremental Dollar Opportunity, 2025-2035
  • Figure 19: East Asia Market Incremental Dollar Opportunity, 2025-2035
  • Figure 20: South Asia and Pacific Market Incremental Dollar Opportunity, 2025-2035
  • Figure 21: Middle East & Africa Market Incremental Dollar Opportunity, 2025-2035
  • Figure 22: North America Market Value Share and BPS Analysis by Country, 2025 and 2035
  • Figure 23: North America Market Value Share and BPS Analysis by Security , 2025 and 2035
  • Figure 24: North America Market Y-o-Y Growth Comparison by Security , 2025-2035
  • Figure 25: North America Market Attractiveness Analysis by Security
  • Figure 26: North America Market Value Share and BPS Analysis by Component, 2025 and 2035
  • Figure 27: North America Market Y-o-Y Growth Comparison by Component, 2025-2035
  • Figure 28: North America Market Attractiveness Analysis by Component
  • Figure 29: North America Market Value Share and BPS Analysis by End Use Verticals, 2025 and 2035
  • Figure 30: North America Market Y-o-Y Growth Comparison by End Use Verticals, 2025-2035
  • Figure 31: North America Market Attractiveness Analysis by End Use Verticals
  • Figure 32: Latin America Market Value Share and BPS Analysis by Country, 2025 and 2035
  • Figure 33: Latin America Market Value Share and BPS Analysis by Security , 2025 and 2035
  • Figure 34: Latin America Market Y-o-Y Growth Comparison by Security , 2025-2035
  • Figure 35: Latin America Market Attractiveness Analysis by Security
  • Figure 36: Latin America Market Value Share and BPS Analysis by Component, 2025 and 2035
  • Figure 37: Latin America Market Y-o-Y Growth Comparison by Component, 2025-2035
  • Figure 38: Latin America Market Attractiveness Analysis by Component
  • Figure 39: Latin America Market Value Share and BPS Analysis by End Use Verticals, 2025 and 2035
  • Figure 40: Latin America Market Y-o-Y Growth Comparison by End Use Verticals, 2025-2035
  • Figure 41: Latin America Market Attractiveness Analysis by End Use Verticals
  • Figure 42: Western Europe Market Value Share and BPS Analysis by Country, 2025 and 2035
  • Figure 43: Western Europe Market Value Share and BPS Analysis by Security , 2025 and 2035
  • Figure 44: Western Europe Market Y-o-Y Growth Comparison by Security , 2025-2035
  • Figure 45: Western Europe Market Attractiveness Analysis by Security
  • Figure 46: Western Europe Market Value Share and BPS Analysis by Component, 2025 and 2035
  • Figure 47: Western Europe Market Y-o-Y Growth Comparison by Component, 2025-2035
  • Figure 48: Western Europe Market Attractiveness Analysis by Component
  • Figure 49: Western Europe Market Value Share and BPS Analysis by End Use Verticals, 2025 and 2035
  • Figure 50: Western Europe Market Y-o-Y Growth Comparison by End Use Verticals, 2025-2035
  • Figure 51: Western Europe Market Attractiveness Analysis by End Use Verticals
  • Figure 52: Eastern Europe Market Value Share and BPS Analysis by Country, 2025 and 2035
  • Figure 53: Eastern Europe Market Value Share and BPS Analysis by Security , 2025 and 2035
  • Figure 54: Eastern Europe Market Y-o-Y Growth Comparison by Security , 2025-2035
  • Figure 55: Eastern Europe Market Attractiveness Analysis by Security
  • Figure 56: Eastern Europe Market Value Share and BPS Analysis by Component, 2025 and 2035
  • Figure 57: Eastern Europe Market Y-o-Y Growth Comparison by Component, 2025-2035
  • Figure 58: Eastern Europe Market Attractiveness Analysis by Component
  • Figure 59: Eastern Europe Market Value Share and BPS Analysis by End Use Verticals, 2025 and 2035
  • Figure 60: Eastern Europe Market Y-o-Y Growth Comparison by End Use Verticals, 2025-2035
  • Figure 61: Eastern Europe Market Attractiveness Analysis by End Use Verticals
  • Figure 62: East Asia Market Value Share and BPS Analysis by Country, 2025 and 2035
  • Figure 63: East Asia Market Value Share and BPS Analysis by Security , 2025 and 2035
  • Figure 64: East Asia Market Y-o-Y Growth Comparison by Security , 2025-2035
  • Figure 65: East Asia Market Attractiveness Analysis by Security
  • Figure 66: East Asia Market Value Share and BPS Analysis by Component, 2025 and 2035
  • Figure 67: East Asia Market Y-o-Y Growth Comparison by Component, 2025-2035
  • Figure 68: East Asia Market Attractiveness Analysis by Component
  • Figure 69: East Asia Market Value Share and BPS Analysis by End Use Verticals, 2025 and 2035
  • Figure 70: East Asia Market Y-o-Y Growth Comparison by End Use Verticals, 2025-2035
  • Figure 71: East Asia Market Attractiveness Analysis by End Use Verticals
  • Figure 72: South Asia and Pacific Market Value Share and BPS Analysis by Country, 2025 and 2035
  • Figure 73: South Asia and Pacific Market Value Share and BPS Analysis by Security , 2025 and 2035
  • Figure 74: South Asia and Pacific Market Y-o-Y Growth Comparison by Security , 2025-2035
  • Figure 75: South Asia and Pacific Market Attractiveness Analysis by Security
  • Figure 76: South Asia and Pacific Market Value Share and BPS Analysis by Component, 2025 and 2035
  • Figure 77: South Asia and Pacific Market Y-o-Y Growth Comparison by Component, 2025-2035
  • Figure 78: South Asia and Pacific Market Attractiveness Analysis by Component
  • Figure 79: South Asia and Pacific Market Value Share and BPS Analysis by End Use Verticals, 2025 and 2035
  • Figure 80: South Asia and Pacific Market Y-o-Y Growth Comparison by End Use Verticals, 2025-2035
  • Figure 81: South Asia and Pacific Market Attractiveness Analysis by End Use Verticals
  • Figure 82: Middle East & Africa Market Value Share and BPS Analysis by Country, 2025 and 2035
  • Figure 83: Middle East & Africa Market Value Share and BPS Analysis by Security , 2025 and 2035
  • Figure 84: Middle East & Africa Market Y-o-Y Growth Comparison by Security , 2025-2035
  • Figure 85: Middle East & Africa Market Attractiveness Analysis by Security
  • Figure 86: Middle East & Africa Market Value Share and BPS Analysis by Component, 2025 and 2035
  • Figure 87: Middle East & Africa Market Y-o-Y Growth Comparison by Component, 2025-2035
  • Figure 88: Middle East & Africa Market Attractiveness Analysis by Component
  • Figure 89: Middle East & Africa Market Value Share and BPS Analysis by End Use Verticals, 2025 and 2035
  • Figure 90: Middle East & Africa Market Y-o-Y Growth Comparison by End Use Verticals, 2025-2035
  • Figure 91: Middle East & Africa Market Attractiveness Analysis by End Use Verticals
  • Figure 92: Global Market - Tier Structure Analysis
  • Figure 93: Global Market - Company Share Analysis
Dashboard
Dashboard
Dashboard
Dashboard
Dashboard
Dashboard

Full Research Suite comprises of:

Market outlook & trends analysis

Market outlook & trends analysis

Interviews & case studies

Interviews & case studies

Strategic recommendations

Strategic recommendations

Vendor profiles & capabilities analysis

Vendor profiles & capabilities analysis

5-year forecasts

5-year forecasts

8 regions and 60+ country-level data splits

8 regions and 60+ country-level data splits

Market segment data splits

Market segment data splits

12 months of continuous data updates

12 months of continuous data updates

DELIVERED AS:

PDF EXCEL ONLINE

Full Research Suite


$5000

$7500

$10000

Buy Report Now
Similar Industry Reports

Similar Industry Reports

System-On-Package Market

System-On-Package Market Size and Share Forecast Outlook 2025 to 2035

Systems Administration Management Tools Market

Systems Administration Management Tools Market Size and Share Forecast Outlook 2025 to 2035

Systemic Sclerosis Treatment Market

Systemic Sclerosis Treatment Market - Trends & Forecast 2025 to 2035

System on Module Market

System on Module Market Growth – Trends & Forecast 2025 to 2035

Systemic Lupus Erythematosus SLE Drugs Market

SLE Drugs Market Insights - Growth & Forecast 2025 to 2035

Systemic Mastocytosis Treatment Market

Systemic Mastocytosis Treatment Market

Systemic Infection Treatment Market

Systemic Infection Treatment Market

5G System Integration Market

5G System Integration Market Insights - Demand & Growth Forecast 2025 to 2035

VRF Systems Market
VRF Systems Market

VRF Systems Market Growth - Trends & Forecast 2025 to 2035

Rail System Dryer Market

Rail System Dryer Market Size and Share Forecast Outlook 2025 to 2035

HVAC System Analyzer Market

HVAC System Analyzer Market Size and Share Forecast Outlook 2025 to 2035

DWDM System Market
DWDM System Market

DWDM System Market Analysis by Services, Product, Vertical, and Region – Growth, Trends, and Forecast from 2025 to 2035

Cloud Systems Management Software Market

Cloud Systems Management Software Market Size and Share Forecast Outlook 2025 to 2035

Hi-Fi Systems Market

Hi-Fi Systems Market Size and Share Forecast Outlook 2025 to 2035

X-ray System Market
X-ray System Market

X-ray System Market Analysis - Size, Share, and Forecast 2025 to 2035

Power System Simulator Market

Power System Simulator Market Growth - Trends & Forecast 2025 to 2035

Brake System Market
Brake System Market

Brake System Market Growth – Trends & Forecast 2024-2034

Cough systems Market

Cough systems Market

Closed System Transfer Devices Market

Closed System Transfer Devices Market Insights – Industry Trends & Forecast 2024-2034

Railway System Market

Railway System Market Size and Share Forecast Outlook 2025 to 2035

Future Market Insights

Cyber-Physical System Market

Chat With MaRIA

Chat With

MaRIA

Hi There, I am MaRIA, Your Market Research Intelligence Assistant. How may I help you?