Depilatory Hair Removal Creams Market Size and Share Forecast Outlook 2025 to 2035

The Depilatory Hair Removal Creams Market is expected to record a valuation of USD 2,951.7 million in 2025 and USD 6,254.3 million in 2035, with an increase of USD 3,302.6 million, which equals a growth of 193% over the decade. The overall expansion represents a CAGR of 7.8% and a near 2X increase in market size.
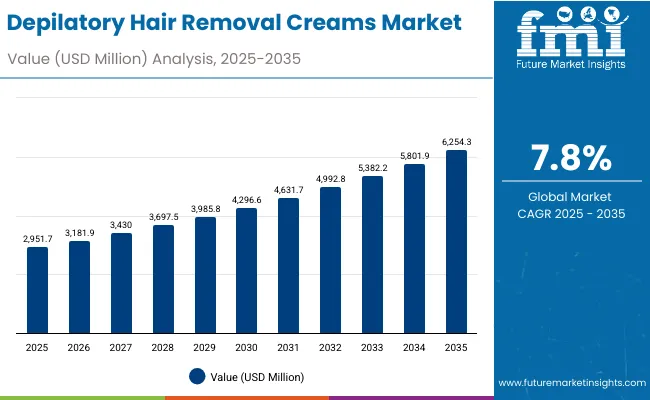
Quick Stats for Depilatory Hair Removal Creams Market

  • Depilatory Hair Removal Creams Market Value (2025): USD 2,951.7 million
  • Depilatory Hair Removal Creams Market Forecast Value (2035): USD 6,254.3 million
  • Depilatory Hair Removal Creams Market Forecast CAGR: 7.8%
  • Leading Segment in Depilatory Hair Removal Creams Market in 2025: Creams (47.2%)
  • Key Growth Regions in the Depilatory Hair Removal Creams Market: Asia-Pacific, North America, Europe
  • Top Key Players in Depilatory Hair Removal Creams Market: Veet, Nair, Sally Hansen, Veet Men, Veet Pure, Avon, Olay, Parissa, Veet Sensitive, Nad’s

Depilatory Hair Removal Creams Market

Depilatory Hair Removal Creams Market Key Takeaways

Metric Value
Depilatory Hair Removal Creams Market Estimated Value in (2025E) USD 2,951.7 million
Depilatory Hair Removal Creams Market Forecast Value in (2035F) USD 6,254.3 million
Forecast CAGR (2025 to 2035) 7.8%

During the first five-year period from 2025 to 2030, the market increases from USD 2,951.7 million to USD 4,296.6 million, adding USD 1,344.9 million, which accounts for 41% of the total decade growth. This phase records steady adoption across female grooming, unisex sensitive-skin formulations, and mass-market retail expansion, driven by product accessibility and rising disposable incomes. Cream-based depilatories dominate this period as they cater to over 47% of global sales, supported by their affordability and skin-friendly formulations.

The second half from 2030 to 2035 contributes USD 1,957.7 million, equal to 59% of total growth, as the market jumps from USD 4,296.6 million to USD 6,254.3 million. This acceleration is powered by premiumization trends, wider acceptance among male consumers, and the introduction of enzyme-assisted and post-depilatory soothing complexes. Online platforms and direct-to-consumer (D2C) brands increasingly drive recurring sales, expanding the e-commerce share beyond 55% of total retail value by the end of the decade.

From 2020 to 2024, the Depilatory Hair Removal Creams Market grew steadily, driven by rising consumer awareness of quick, pain-free hair removal solutions and the expanding retail presence of global and regional brands. During this period, the competitive landscape was dominated by multinational personal care manufacturers holding nearly 70% of global sales, with leaders such as Veet (Reckitt Benckiser) and Nair (Church & Dwight) focusing on product safety, dermatological validation, and fragrance-free variants. Competitive differentiation relied on skin compatibility, brand reputation, and price accessibility, while organic and sensitive-skin lines began gaining traction through online retail channels. Professional and salon-based depilatory products contributed less than 10% of total market value.

Demand for depilatory hair removal creams will expand to USD 2,951.7 million in 2025, and the revenue mix will continue to shift toward enzyme-assisted and post-depilatory soothing formulations, which already account for more than 52% of ingredient-based value share. Traditional leaders face rising competition from D2C and natural beauty brands offering vegan, paraben-free, and cruelty-free solutions. Major FMCG players are pivoting toward gender-neutral and sustainability-driven formulations, integrating recyclable packaging and plant-based actives to retain relevance. Emerging entrants specializing in sensitive-skin and quick-rinse formulations are gaining share, signaling that the next phase of competition will favor ingredient transparency, product safety, and digital-first consumer engagement strategies.

Why the Depilatory Hair Removal Creams Market is growing?

The depilatory hair removal creams market is growing as consumers increasingly prefer convenient, pain-free alternatives to salon waxing or laser treatments. Urban lifestyles, time constraints, and affordability are driving the popularity of at-home solutions, particularly among women and young adults. Continuous innovations such as quick-rinse formulas, sensitive-skin variants, and pleasant fragrances are enhancing user experience, resulting in higher adoption rates across emerging economies and boosting overall category expansion.

Market growth is further supported by the surge in gender-neutral and dermatologically tested depilatory creams catering to broader demographics. Brands are investing in enzyme-assisted and soothing ingredient blends that minimize irritation and suit sensitive skin, expanding their appeal to men and unisex consumers. This shift, combined with strong e-commerce availability and social media-driven grooming trends, has diversified the customer base and increased purchase frequency, solidifying long-term market momentum worldwide.

Segmental Analysis

The Depilatory Hair Removal Creams Market is segmented by product type, key ingredients, application area, distribution channel, end user, and region. By product type, it includes creams, lotions, foams/aerosols, and roll-on gels, with creams dominating global sales due to ease of use and skin compatibility. Key ingredient segmentation covers calcium/alkali thioglycolate systems, enzyme-assisted blends, and soothing post-depilatory complexes, reflecting growing demand for gentle and natural formulations. Application areas include legs and arms, underarms, bikini/intimate zones, and face, capturing varied consumer grooming needs.

Distribution channels span supermarkets and hypermarkets, pharmacies and drugstores, e-commerce, and salons or professional supply outlets, with online retail showing the fastest growth. By end user, the market covers women, men, and unisex sensitive-skin users, reflecting inclusivity trends. Geographically, the market is analyzed across North America, Europe, East Asia, South Asia & Pacific, Latin America, and the Middle East & Africa, highlighting diverse consumer behavior and product adoption patterns worldwide.
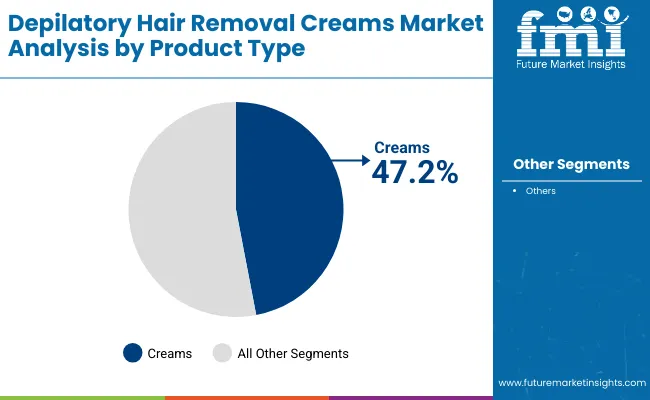
Insights into the Product Type Segment with Creams Leading in Market Share

Depilatory Hair Removal Creams Market By Products

Product Type Value Share% 2025
Creams 47.2%
Others 52.8%

The creams segment is projected to contribute 47.2% of the Depilatory Hair Removal Creams Market revenue in 2025, maintaining its position as the leading product type category. This dominance is driven by the growing preference for quick, pain-free, and affordable hair removal options that can be easily applied at home. Creams are favored for their skin-friendly formulations enriched with moisturizing and soothing agents, catering to both women and unisex sensitive-skin users.

The segment’s expansion is further supported by innovation in enzyme-based and dermatologically tested formulations that reduce irritation while improving fragrance and texture. As consumer demand shifts toward convenience and natural ingredients, the creams segment is expected to remain the cornerstone of depilatory product sales globally.
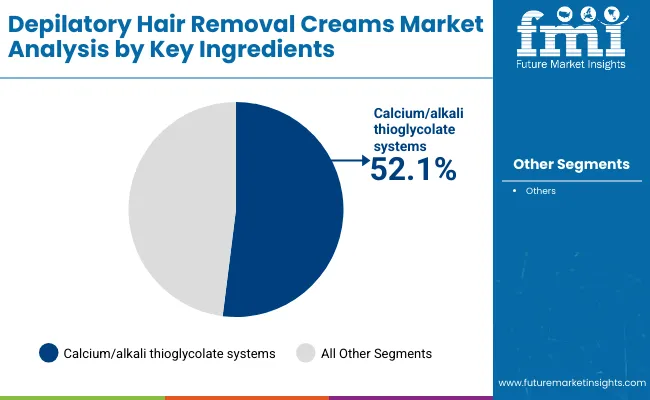
Insights into the Key Ingredients Segment with Calcium/Alkali Thioglycolate Systems Dominating the Demand

Depilatory Hair Removal Creams Market Key Ingredients

Key Ingredients Value Share% 2025
Calcium/alkali thioglycolate systems 52.1%
Others 47.9%

The calcium/alkali thioglycolate systems segment is forecasted to hold 52.1% of the Depilatory Hair Removal Creams Market share in 2025, driven by its strong performance in delivering effective and rapid hair removal results. These formulations chemically dissolve hair close to the root while maintaining a smoother skin finish, making them ideal for legs, arms, and underarm applications. Their efficiency, affordability, and compatibility with mass-market depilatory creams have ensured their continued dominance.

The segment’s growth is further supported by reformulations that balance pH levels and incorporate soothing agents to minimize irritation and improve fragrance stability. As brands prioritize safety, dermatological approval, and faster results, calcium/alkali thioglycolate systems are expected to remain the preferred base ingredient in global depilatory cream production.
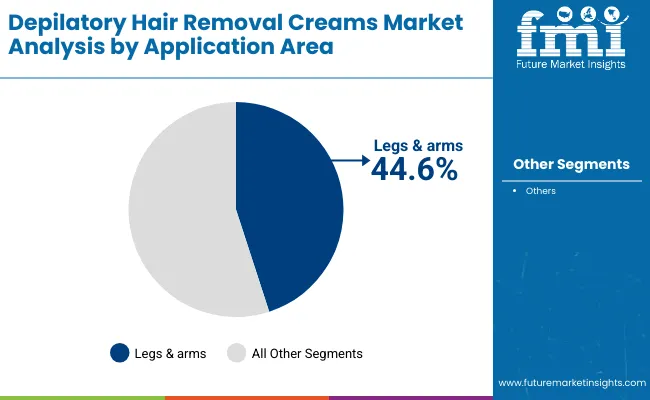
Insights into the Application Area Segment with Legs & Arms Dominating the Market

Depilatory Hair Removal Creams Market By Application

Application Area Value Share% 2025
Legs & arms 44.6%
Others 55.4%

The legs and arms segment is projected to account for 44.6% of the Depilatory Hair Removal Creams Market revenue in 2025, establishing it as the most prominent application area. This dominance stems from the high frequency of hair removal routines for these body parts, where consumers prioritize quick, painless, and evenly spread application results. Depilatory creams designed for legs and arms emphasize moisturizing and soothing properties, allowing smoother skin texture post-use without irritation.

The segment’s expansion is further supported by product innovations such as quick-rinse formulas, hydrating complexes, and fragrance-enhanced variants that appeal to women and unisex consumers alike. As grooming routines become more integrated into everyday self-care, legs and arms are expected to remain the largest and most consistent area of application in the depilatory market.

What are the Drivers, Restraints, and Key Trends of the Depilatory Hair Removal Creams Market?

Rising Demand for Convenient and Pain-Free Hair Removal Solutions

The depilatory hair removal creams market is witnessing strong growth due to rising consumer preference for quick, pain-free alternatives to waxing and shaving. Busy lifestyles and the growing influence of beauty standards across both men and women have accelerated the adoption of creams that deliver smooth skin with minimal effort. Continuous product innovations, such as fast-acting and dermatologically tested formulas, are enhancing consumer satisfaction. This shift toward convenience-driven grooming routines is strengthening brand loyalty and expanding market penetration across both developed and emerging economies.

Expansion of E-commerce and Direct-to-Consumer Channels

The rapid growth of e-commerce platforms and brand-owned digital stores has transformed the distribution landscape for depilatory creams. Consumers now have easier access to a wide variety of products, including sensitive-skin and organic variants, supported by personalized marketing and subscription-based delivery models. Online reviews and influencer-led campaigns are shaping purchase behavior, particularly among Gen Z and millennial consumers. This online visibility not only drives repeat sales but also allows brands to gather valuable data on consumer preferences, enabling targeted innovation and expanding their market reach globally.

Skin Sensitivity and Chemical Concerns

Despite growing demand, market expansion is restrained by concerns related to skin irritation, allergic reactions, and potential side effects from chemical ingredients such as thioglycolates. Consumers with sensitive skin often hesitate to use depilatory creams due to fears of burns or dryness. This has prompted stricter regulatory oversight and increased demand for natural alternatives. Brands are under pressure to improve ingredient transparency and dermatological safety while maintaining product efficacy. The need to balance performance and mildness continues to pose a challenge for large-scale consumer acceptance, especially in emerging markets.

Growth in Male Grooming and Unisex Product Lines

A major opportunity lies in the expanding male grooming segment and the rise of unisex depilatory formulations. Changing perceptions of personal care, coupled with social media influence, are encouraging men to adopt easy hair removal routines. Brands introducing gender-neutral packaging and formulations suitable for coarse hair are tapping into an underserved demographic. This trend is further supported by the increasing popularity of at-home grooming kits and sensitive-skin variants designed for universal use. The growing inclusivity and diversification of grooming preferences present a significant growth avenue for global depilatory cream manufacturers.
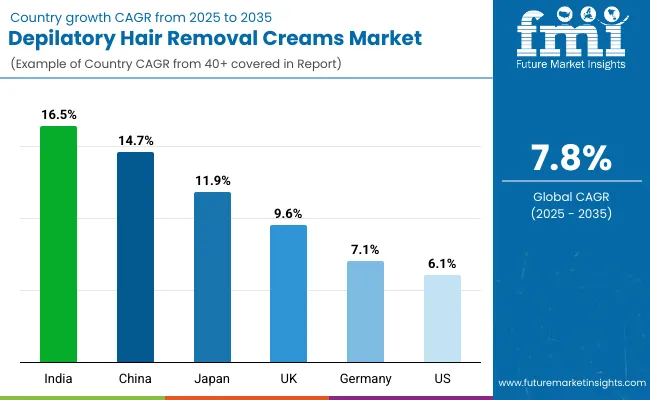
Analysis of Depilatory Hair Removal Creams Market By Key Countries

Depilatory Hair Removal Creams Market By Country

Countries Estimated CAGR (2025 to 2035)
China 14.7%
USA 6.1%
India 16.5%
UK 9.6%
Germany 7.1%
Japan 11.9%

The global Depilatory Hair Removal Creams Market displays significant regional variations, primarily influenced by grooming awareness, disposable income, and gender-neutral beauty adoption. Asia-Pacific emerges as the fastest-growing region, led by India (16.5%) and China (14.7%), where urbanization, affordability, and rising middle-class spending are fueling adoption of mass-market depilatory products. E-commerce penetration and influencer-driven beauty trends have accelerated growth, especially among younger consumers seeking convenient, pain-free solutions.

In China, innovation in enzyme-assisted formulations and local brand diversification are boosting demand for natural and sensitive-skin depilatory creams. India’s high CAGR reflects expanding beauty and personal care consumption beyond metropolitan areas, supported by aggressive retail distribution and affordable pricing strategies. Japan also posts robust growth at 11.9%, driven by premium formulations emphasizing skin sensitivity and aesthetic quality.

Europe maintains a strong growth trajectory, led by the UK (9.6%) and Germany (7.1%), where sustainability, dermatological testing, and clean-label product trends dominate consumer choices. European consumers exhibit higher brand loyalty and preference for vegan, paraben-free creams.

North America, represented by the USA (6.1%), shows stable yet mature growth, reflecting widespread product availability and premiumization trends. Demand is driven by self-care culture and inclusivity in marketing that normalizes male grooming. Overall, while mature regions emphasize product differentiation and sustainability, emerging markets such as India and China drive global momentum through affordability, accessibility, and rising personal grooming awareness.
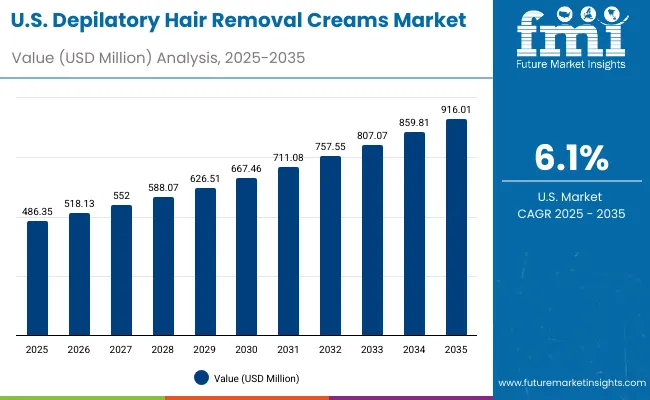
Sales Outlook for Depilatory Hair Removal Creams in the United States

Depilatory Hair Removal Creams Market Usa

Year USA Depilatory Hair Removal Creams Market (USD Million)
2025 486.35
2026 518.13
2027 552.00
2028 588.07
2029 626.51
2030 667.46
2031 711.08
2032 757.55
2033 807.07
2034 859.81
2035 916.01

The Depilatory Hair Removal Creams Market in the United States is projected to grow at a CAGR of 6.1% from 2025 to 2035, driven by strong consumer adoption of quick, non-invasive, and affordable hair removal solutions. Growth is supported by expanding product availability across retail pharmacies, supermarkets, and e-commerce platforms. Premium depilatory formulations enriched with aloe vera, shea butter, and vitamin E are appealing to consumers seeking moisturizing and skin-safe alternatives to waxing and shaving. Male grooming products are also witnessing higher uptake through gender-neutral marketing and sensitive-skin variants.

Increased online purchasing behavior and social media influence are fostering strong brand visibility for leading players such as Veet, Nair, and Sally Hansen. Subscription-based sales and targeted influencer campaigns are further supporting retention rates among millennial and Gen Z consumers. Product innovation focused on dermatologically approved, fragrance-free, and cruelty-free formulations continues to define competitive differentiation in the USA market.

  • At-home depilatory creams are replacing traditional salon waxing among women aged 18-35.
  • Growing demand for sensitive-skin and natural ingredient-based creams is expanding brand portfolios.
  • D2C and online-exclusive depilatory products are driving convenience-led sales growth nationwide.

Growth and Expansion Outlook for Depilatory Hair Removal Creams Market in the United Kingdom

The Depilatory Hair Removal Creams Market in the United Kingdom is expected to grow at a CAGR of 9.6% from 2025 to 2035, supported by the country’s evolving beauty and personal care landscape. British consumers increasingly prioritize convenience, inclusivity, and sustainability in grooming routines, driving the shift from salon-based waxing to at-home depilatory creams. Demand is rising for vegan, cruelty-free, and dermatologically tested formulations, reflecting strong alignment with ethical beauty trends. Premium brands are expanding their presence through pharmacies and online retail, while local niche players emphasize botanical and fragrance-free products to appeal to sensitive-skin users.

The UK market’s growth is further strengthened by the proliferation of subscription-based D2C brands, influencer-led marketing, and retailer partnerships with established beauty chains. Men’s grooming and gender-neutral depilatory creams are emerging as fast-expanding categories, encouraged by inclusive advertising and broader cultural acceptance of self-care. Continuous product innovation focused on quick-rinse, low-odor, and skin-conditioning variants is shaping consumer loyalty and repurchase behavior.

  • Ethical and vegan-certified depilatory creams are capturing a rising share in the UK beauty aisles.
  • Gender-neutral and sensitive-skin products are driving new consumer engagement in both online and offline retail.
  • Direct-to-consumer (D2C) and pharmacy channels are leading sales expansion through affordable premium offerings.

Growth and Expansion Outlook for Depilatory Hair Removal Creams Market in India

India is witnessing rapid growth in the Depilatory Hair Removal Creams Market, which is forecast to expand at a CAGR of 16.5% through 2035. This strong expansion is driven by rising beauty consciousness, expanding retail penetration, and increasing affordability of personal grooming products across both metropolitan and tier-2 cities. Local and international brands are actively launching herbal, paraben-free, and dermatologically tested depilatory creams suited to Indian skin tones and climatic conditions. Growing participation of women in the workforce and the popularity of quick, at-home beauty routines have further accelerated adoption.

The surge in e-commerce platforms such as Nykaa, Amazon, and Flipkart, along with social media-led brand promotions, is strengthening product visibility and accessibility across diverse consumer groups. Additionally, smaller domestic players are entering the market with ayurvedic and plant-based formulations, appealing to health-conscious buyers seeking natural alternatives.

  • Product adoption is rising in smaller cities due to affordable pricing and increasing retail outreach.
  • Local and multinational brands are expanding herbal and skin-safe product lines to capture broader demographics.
  • E-commerce and influencer-driven promotions are driving awareness and repeat purchases across young urban consumers.

Sales Outlook for Depilatory Hair Removal Creams in China

The Depilatory Hair Removal Creams Market in China is expected to grow at a CAGR of 14.7%, the highest among leading economies during 2025-2035. This robust momentum is driven by the growing beauty and personal care culture, increasing urbanization, and strong demand for affordable, fast-acting depilatory solutions among young consumers. The shift toward self-grooming and hygiene maintenance has been amplified by rising disposable incomes and the popularity of at-home beauty products. Domestic brands are expanding rapidly, offering enzyme-assisted and herbal depilatory creams that cater to the preferences of Chinese consumers seeking gentle, non-irritating formulations.

E-commerce giants such as Tmall, JD.com, and Douyin are fueling digital growth through product customization, influencer-led marketing, and promotional bundling with skincare essentials. Meanwhile, premium and international brands are localizing formulations to align with skin sensitivity and fragrance preferences. The affordability and accessibility of products, coupled with increased grooming awareness among both genders, are expected to keep China at the forefront of global market expansion.
  • Domestic beauty brands are launching enzyme-based and herbal depilatory creams for sensitive skin consumers.
  • E-commerce platforms are driving sales through targeted campaigns and skincare product bundling.
  • Rising male grooming participation and youth-oriented beauty trends are boosting long-term market potential.

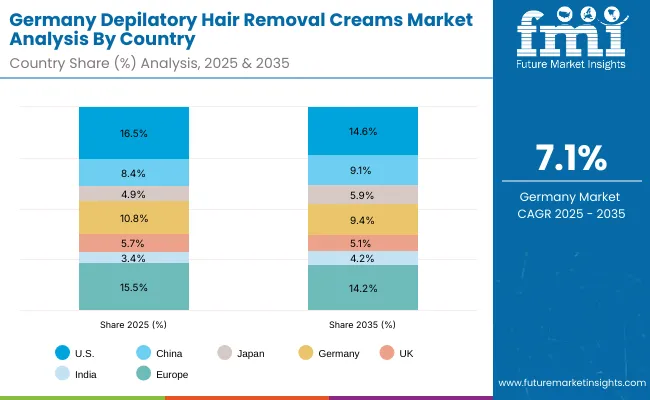
In-depth Analysis of Depilatory Hair Removal Creams in Germany

Depilatory Hair Removal Creams Market Germany

Countries 2025 Share (%)
USA 16.5%
China 8.4%
Japan 4.9%
Germany 10.8%
UK 5.7%
India 3.4%
Countries 2035 Share (%)
USA 14.6%
China 9.1%
Japan 5.9%
Germany 9.4%
UK 5.1%
India 4.2%

The Depilatory Hair Removal Creams Market in Germany is projected to grow at a CAGR of 7.1%, supported by high consumer awareness, premium beauty standards, and strong demand for dermatologically tested and eco-certified skincare products. German consumers exhibit a high preference for vegan, fragrance-free, and sensitive-skin depilatory creams, reflecting the country’s broader sustainability and clean-beauty movement. Established European brands such as Veet and Nair continue to dominate, but local niche players are gaining momentum with plant-based, cruelty-free alternatives emphasizing ingredient transparency.

The market’s expansion is also being driven by the growing male grooming segment, especially among younger demographics, supported by marketing that normalizes body hair removal for all genders. Pharmacies and drugstores remain key retail channels, while online platforms such as Douglas and Amazon Germany are expanding access to specialized products for different skin types. The rising influence of dermatologist recommendations, combined with sustainable packaging innovation and natural formulations, positions Germany as one of Europe’s most mature and eco-conscious markets.
  • Vegan and eco-labeled depilatory creams are driving premium segment growth.
  • Sensitive-skin and dermatologically certified formulations dominate consumer choices.
  • Male grooming and gender-neutral marketing campaigns are expanding the user base across age groups.

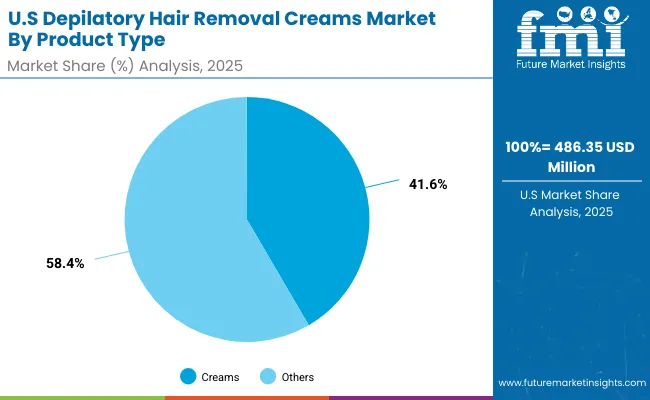
Growth Outlook for Depilatory Hair Removal Creams Market in USA

Depilatory Hair Removal Creams Market Usa 2

USA By Product Type Value Share% 2025
Creams 41.6%
Others 58.4%

The Depilatory Hair Removal Creams Market in the United States is projected to reach USD 486.35 million in 2025, led by sustained consumer demand for convenient, quick, and non-irritating hair removal solutions. Creams, holding a 41.6% share, remain the most preferred product type due to their accessibility and ability to provide smooth results without professional assistance. This segment continues to expand as consumers shift away from shaving and waxing toward pain-free alternatives suited for daily grooming routines.

The growth trajectory is supported by innovation in moisturizing and fragrance-free depilatory formulations, appealing to women and men with sensitive skin. Rising awareness of personal hygiene, particularly among working professionals, and the growing popularity of self-care products are propelling the USA market forward. E-commerce channels such as Amazon, Walmart, and Target have amplified visibility for both mass and premium brands, while D2C entrants are attracting younger audiences through subscription models and influencer-led campaigns.
  • Cream-based depilatory products remain the preferred choice for their ease of use and quick results.
  • Male grooming and gender-neutral marketing are broadening consumer appeal.
  • Online retail and social media engagement continue to drive repeat purchases and brand loyalty.

Opportunity Analysis of China Depilatory Hair Removal Creams Market

Depilatory Hair Removal Creams Market China

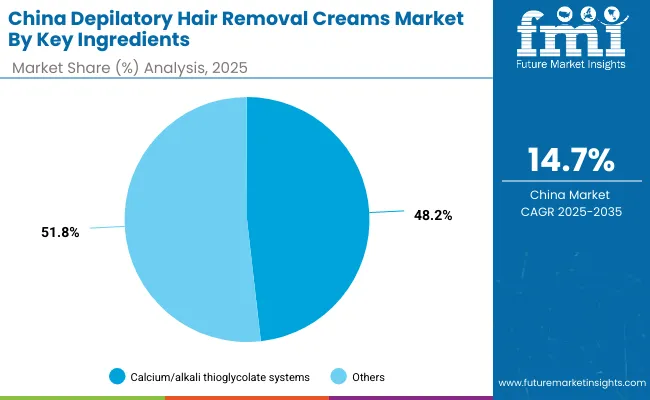
China By Key Ingredients Value Share% 2025
Calcium/alkali thioglycolate systems 48.2%
Others 51.8%

The Depilatory Hair Removal Creams Market in China presents one of the strongest growth opportunities globally, fueled by rising consumer awareness of personal grooming, hygiene, and skincare sophistication. The market is driven by a younger demographic embracing quick, at-home beauty solutions supported by digital retail ecosystems and influencer marketing. The preference for enzyme-assisted and mild thioglycolate-based formulations reflects a major shift toward skin-friendly and non-irritating depilatory options. With a 48.2% share, calcium/alkali thioglycolate systems remain foundational, though brands are investing in blends with botanical extracts and soothing actives to meet local consumer expectations for safety and fragrance.

China’s opportunity lies in the intersection of e-commerce dominance and localized innovation. Domestic brands are leveraging platforms like Tmall, Douyin, and JD.com to reach mass audiences with customized depilatory solutions, while international brands are tailoring ingredients for Asian skin sensitivity. The growth of men’s grooming, along with increased acceptance of hair removal as part of everyday hygiene, further expands the addressable market. The government’s focus on supporting local beauty startups through digital entrepreneurship and manufacturing incentives also enhances scalability.
  • Herbal and enzyme-based depilatory creams are gaining traction among young urban consumers.
  • E-commerce integration and influencer marketing are accelerating brand penetration across demographics.
  • The male grooming segment represents a new high-growth avenue for international and domestic brands alike.

Competitive Landscape of Depilatory Hair Removal Creams Market

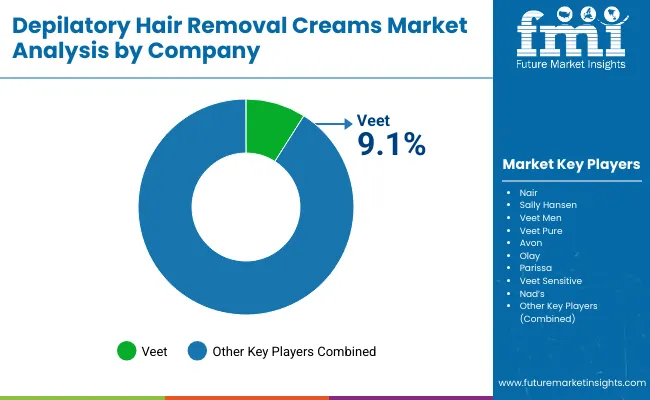
Depilatory Hair Removal Creams Market By Company

The Depilatory Hair Removal Creams Market is moderately fragmented, featuring a blend of global beauty leaders, regional manufacturers, and niche brands focusing on natural and dermatological formulations. Veet, owned by Reckitt Benckiser, leads the market with a 9.1% global value share, supported by a diverse product portfolio covering sensitive-skin, men’s, and natural variants. The brand’s consistent investment in marketing, dermatological testing, and distribution across both offline and e-commerce channels reinforces its leadership position.

Mid-sized and emerging brands such as Nair (Church & Dwight), Sally Hansen, and Olay are intensifying competition by expanding gender-inclusive and quick-rinse formulations. These companies emphasize consumer trust through skin-safe ingredients, attractive packaging, and affordability, targeting mass-market consumers seeking convenient hair removal solutions. Niche players including Parissa and Nad’s focus on organic, hypoallergenic, and cruelty-free alternatives, appealing to eco-conscious buyers and consumers with sensitive skin concerns.

Competitive differentiation in this market is shifting from product strength alone to formulation innovation, ingredient transparency, and sustainability. Brands are increasingly integrating plant-based actives, recyclable packaging, and digital marketing ecosystems to capture young, urban consumers. Collaborations with dermatologists and beauty influencers are becoming central to credibility and consumer loyalty, ensuring continuous engagement in a market driven by hygiene, convenience, and personalization trends.

Key Developments in Depilatory Hair Removal Creams Market

  • 2024: Veet introduced its "Veet Pure Sensitive Range" across major Asian and European markets, featuring enzyme-assisted and paraben-free formulations designed for sensitive skin users. The launch focused on natural extracts and reduced chemical odor, aligning with rising consumer demand for clean beauty and dermatologically tested depilatory products.
  • 2025: Nair announced the expansion of its "Nair Men Care Series" in North America and select Asia-Pacific markets, targeting the growing male grooming segment. The line includes quick-rinse depilatory creams infused with aloe vera and vitamin E, offering smooth results with reduced irritation and faster application time.

Scope of the Report

Item Value
Quantitative Units USD 2,951.7 Million
Product Type Creams, Lotions, Foams/Aerosols, Roll-on Gels
Key Ingredients Calcium/Alkali Thioglycolate Systems, Enzyme-Assisted Blends, Soothing Post-Depilatory Complexes
Application Area Legs & Arms, Underarms, Bikini/Intimate, Face
Channel Supermarkets & Hypermarkets, Pharmacies & Drugstores, E-commerce, Salons & Professional Supply
End User Women, Men, Unisex Sensitive-Skin Users
Regions Covered North America, Europe, Asia-Pacific, Latin America, Middle East & Africa
Country Covered United States, Canada, Germany, France, United Kingdom, China, Japan, India, Brazil, South Africa
Key Companies Profiled Veet, Nair, Sally Hansen, Veet Men, Veet Pure, Avon, Olay, Parissa, Veet Sensitive, Nad’s
Additional Attributes Dollar sales by product type and distribution channel, evolving consumer adoption trends in at-home grooming and personal hygiene, and rising demand for sensitive-skin and enzyme-based depilatory formulations are shaping market dynamics. Growth is also driven by expanding e-commerce penetration, increased sales of portable and travel-friendly depilatory creams, and sector-specific expansion across beauty retail, pharmacies, and online direct-to-consumer (D2C) platforms. Revenue segmentation highlights strong contributions from cream-based and unisex-sensitive formulations, while innovations focus on herbal ingredients, fragrance-neutral blends, and recyclable packaging.

Key Segments

By Product Type:

  • Creams
  • Lotions
  • Foams/aerosols
  • Roll-on gels

By Key Ingredients:

  • Calcium/alkali thioglycolate systems
  • Enzyme-assisted blends
  • Soothing post-depilatory complexes

By Application Area:

  • Legs & arms
  • Underarms
  • Bikini/intimate
  • Face

By Channel:

  • E-commerce
  • Pharmacies & drugstores
  • Salons & professional supply
  • Supermarkets & hypermarkets

By End User:

  • Women
  • Men
  • Unisex sensitive-skin users

By Region:

  • North America
  • Latin America
  • Europe
  • East Asia
  • South Asia & Pacific
  • Middle East and Africa

Table of Content

  1. Executive Summary
    • Global Market Outlook
    • Demand-side Trends
    • Supply-side Trends
    • Technology Roadmap Analysis
    • Analysis and Recommendations
  2. Market Overview
    • Market Coverage / Taxonomy
    • Market Definition / Scope / Limitations
  3. Market Background
    • Market Dynamics
      • Drivers
      • Restraints
      • Opportunity
      • Trends
    • Scenario Forecast
      • Demand in Optimistic Scenario
      • Demand in Likely Scenario
      • Demand in Conservative Scenario
    • Opportunity Map Analysis
    • Product Life Cycle Analysis
    • Supply Chain Analysis
      • Supply Side Participants and their Roles
        • Producers
        • Mid-Level Participants (Traders/ Agents/ Brokers)
        • Wholesalers and Distributors
      • Value Added and Value Created at Node in the Supply Chain
      • List of Raw Material Suppliers
      • List of Existing and Potential Buyer’s
    • Investment Feasibility Matrix
    • Value Chain Analysis
      • Profit Margin Analysis
      • Wholesalers and Distributors
      • Retailers
    • PESTLE and Porter’s Analysis
    • Regulatory Landscape
      • By Key Regions
      • By Key Countries
    • Regional Parent Market Outlook
    • Production and Consumption Statistics
    • Import and Export Statistics
  4. Global Market Analysis 2020 to 2024 and Forecast, 2025 to 2035
    • Historical Market Size Value (USD Million) & Volume (Units) Analysis, 2020 to 2024
    • Current and Future Market Size Value (USD Million) & Volume (Units) Projections, 2025 to 2035
      • Y-o-Y Growth Trend Analysis
      • Absolute $ Opportunity Analysis
  5. Global Market Analysis 2020 to 2024 and Forecast 2025 to 2035, By Product Type
    • Introduction / Key Findings
    • Historical Market Size Value (USD Million) & Volume (Units) Analysis By Product Type, 2020 to 2024
    • Current and Future Market Size Value (USD Million) & Volume (Units) Analysis and Forecast By Product Type, 2025 to 2035
      • Creams
      • Lotions
      • Foams/aerosols
      • Roll-on gels
    • Y-o-Y Growth Trend Analysis By Product Type, 2020 to 2024
    • Absolute $ Opportunity Analysis By Product Type, 2025 to 2035
  6. Global Market Analysis 2020 to 2024 and Forecast 2025 to 2035, By Key Ingredients
    • Introduction / Key Findings
    • Historical Market Size Value (USD Million) & Volume (Units) Analysis By Key Ingredients, 2020 to 2024
    • Current and Future Market Size Value (USD Million) & Volume (Units) Analysis and Forecast By Key Ingredients, 2025 to 2035
      • Calcium/alkali thioglycolate systems
      • Enzyme-assisted blends
      • Soothing post-depilatory complexes
    • Y-o-Y Growth Trend Analysis By Key Ingredients, 2020 to 2024
    • Absolute $ Opportunity Analysis By Key Ingredients, 2025 to 2035
  7. Global Market Analysis 2020 to 2024 and Forecast 2025 to 2035, By Application Area
    • Introduction / Key Findings
    • Historical Market Size Value (USD Million) & Volume (Units) Analysis By Application Area, 2020 to 2024
    • Current and Future Market Size Value (USD Million) & Volume (Units) Analysis and Forecast By Application Area, 2025 to 2035
      • Legs & arms
      • Underarms
      • Bikini/intimate
      • Face
    • Y-o-Y Growth Trend Analysis By Application Area, 2020 to 2024
    • Absolute $ Opportunity Analysis By Application Area, 2025 to 2035
  8. Global Market Analysis 2020 to 2024 and Forecast 2025 to 2035, By Channel
    • Introduction / Key Findings
    • Historical Market Size Value (USD Million) & Volume (Units) Analysis By Channel, 2020 to 2024
    • Current and Future Market Size Value (USD Million) & Volume (Units) Analysis and Forecast By Channel, 2025 to 2035
      • E-commerce
      • Pharmacies & drugstores
      • Salons & professional supply
      • Supermarkets & hypermarkets
    • Y-o-Y Growth Trend Analysis By Channel, 2020 to 2024
    • Absolute $ Opportunity Analysis By Channel, 2025 to 2035
  9. Global Market Analysis 2020 to 2024 and Forecast 2025 to 2035, By End User
    • Introduction / Key Findings
    • Historical Market Size Value (USD Million) & Volume (Units) Analysis By End User, 2020 to 2024
    • Current and Future Market Size Value (USD Million) & Volume (Units) Analysis and Forecast By End User, 2025 to 2035
      • Women
      • Men
      • Unisex sensitive-skin users
    • Y-o-Y Growth Trend Analysis By End User, 2020 to 2024
    • Absolute $ Opportunity Analysis By End User, 2025 to 2035
  10. Global Market Analysis 2020 to 2024 and Forecast 2025 to 2035, By Region
    • Introduction
    • Historical Market Size Value (USD Million) & Volume (Units) Analysis By Region, 2020 to 2024
    • Current Market Size Value (USD Million) & Volume (Units) Analysis and Forecast By Region, 2025 to 2035
      • North America
      • Latin America
      • Europe
      • East Asia
      • South Asia & Pacific
      • Middle East and Africa
    • Market Attractiveness Analysis By Region
  11. North America Market Analysis 2020 to 2024 and Forecast 2025 to 2035, By Country
    • Historical Market Size Value (USD Million) & Volume (Units) Trend Analysis By Market Taxonomy, 2020 to 2024
    • Market Size Value (USD Million) & Volume (Units) Forecast By Market Taxonomy, 2025 to 2035
      • By Country
        • USA
        • Canada
      • By Product Type
      • By Key Ingredients
      • By Application Area
      • By Channel
      • By End User
    • Market Attractiveness Analysis
      • By Country
      • By Product Type
      • By Key Ingredients
      • By Application Area
      • By Channel
      • By End User
    • Key Takeaways
  12. Latin America Market Analysis 2020 to 2024 and Forecast 2025 to 2035, By Country
    • Historical Market Size Value (USD Million) & Volume (Units) Trend Analysis By Market Taxonomy, 2020 to 2024
    • Market Size Value (USD Million) & Volume (Units) Forecast By Market Taxonomy, 2025 to 2035
      • By Country
        • Brazil
        • Mexico
        • Colombia
        • Rest of Latin America
      • By Product Type
      • By Key Ingredients
      • By Application Area
      • By Channel
      • By End User
    • Market Attractiveness Analysis
      • By Country
      • By Product Type
      • By Key Ingredients
      • By Application Area
      • By Channel
      • By End User
    • Key Takeaways
  13. Europe Market Analysis 2020 to 2024 and Forecast 2025 to 2035, By Country
    • Historical Market Size Value (USD Million) & Volume (Units) Trend Analysis By Market Taxonomy, 2020 to 2024
    • Market Size Value (USD Million) & Volume (Units) Forecast By Market Taxonomy, 2025 to 2035
      • By Country
        • Germany
        • UK
        • France
        • Italy
        • Spain
        • Belgium
        • Netherlands
        • Nordic
        • Switzerland
        • Russia
        • Poland
        • Rest of Europe
      • By Product Type
      • By Key Ingredients
      • By Application Area
      • By Channel
      • By End User
    • Market Attractiveness Analysis
      • By Country
      • By Product Type
      • By Key Ingredients
      • By Application Area
      • By Channel
      • By End User
    • Key Takeaways
  14. East Asia Market Analysis 2020 to 2024 and Forecast 2025 to 2035, By Country
    • Historical Market Size Value (USD Million) & Volume (Units) Trend Analysis By Market Taxonomy, 2020 to 2024
    • Market Size Value (USD Million) & Volume (Units) Forecast By Market Taxonomy, 2025 to 2035
      • By Country
        • China
        • Japan
        • South Korea
      • By Product Type
      • By Key Ingredients
      • By Application Area
      • By Channel
      • By End User
    • Market Attractiveness Analysis
      • By Country
      • By Product Type
      • By Key Ingredients
      • By Application Area
      • By Channel
      • By End User
    • Key Takeaways
  15. South Asia & Pacific Market Analysis 2020 to 2024 and Forecast 2025 to 2035, By Country
    • Historical Market Size Value (USD Million) & Volume (Units) Trend Analysis By Market Taxonomy, 2020 to 2024
    • Market Size Value (USD Million) & Volume (Units) Forecast By Market Taxonomy, 2025 to 2035
      • By Country
        • India
        • Thailand
        • Malaysia
        • Indonesia
        • Singapore
        • Vietnam
        • Australia
        • New Zealand
        • Rest of South Asia
      • By Product Type
      • By Key Ingredients
      • By Application Area
      • By Channel
      • By End User
    • Market Attractiveness Analysis
      • By Country
      • By Product Type
      • By Key Ingredients
      • By Application Area
      • By Channel
      • By End User
    • Key Takeaways
  16. Middle East and Africa Market Analysis 2020 to 2024 and Forecast 2025 to 2035, By Country
    • Historical Market Size Value (USD Million) & Volume (Units) Trend Analysis By Market Taxonomy, 2020 to 2024
    • Market Size Value (USD Million) & Volume (Units) Forecast By Market Taxonomy, 2025 to 2035
      • By Country
        • Turkey
        • UAE
        • Saudi Arabia
        • Israel
        • Other GCC Countries
        • North Africa
        • South Africa
      • By Product Type
      • By Key Ingredients
      • By Application Area
      • By Channel
      • By End User
    • Market Attractiveness Analysis
      • By Country
      • By Product Type
      • By Key Ingredients
      • By Application Area
      • By Channel
      • By End User
    • Key Takeaways
  17. Key Countries Market Analysis
    • USA
      • Pricing Analysis
      • Market Share Analysis, 2024
        • By Product Type
        • By Key Ingredients
        • By Application Area
        • By Channel
        • By End User
    • Canada
      • Pricing Analysis
      • Market Share Analysis, 2024
        • By Product Type
        • By Key Ingredients
        • By Application Area
        • By Channel
        • By End User
    • Brazil
      • Pricing Analysis
      • Market Share Analysis, 2024
        • By Product Type
        • By Key Ingredients
        • By Application Area
        • By Channel
        • By End User
    • Mexico
      • Pricing Analysis
      • Market Share Analysis, 2024
        • By Product Type
        • By Key Ingredients
        • By Application Area
        • By Channel
        • By End User
    • Colombia
      • Pricing Analysis
      • Market Share Analysis, 2024
        • By Product Type
        • By Key Ingredients
        • By Application Area
        • By Channel
        • By End User
    • Germany
      • Pricing Analysis
      • Market Share Analysis, 2024
        • By Product Type
        • By Key Ingredients
        • By Application Area
        • By Channel
        • By End User
    • UK
      • Pricing Analysis
      • Market Share Analysis, 2024
        • By Product Type
        • By Key Ingredients
        • By Application Area
        • By Channel
        • By End User
    • France
      • Pricing Analysis
      • Market Share Analysis, 2024
        • By Product Type
        • By Key Ingredients
        • By Application Area
        • By Channel
        • By End User
    • Italy
      • Pricing Analysis
      • Market Share Analysis, 2024
        • By Product Type
        • By Key Ingredients
        • By Application Area
        • By Channel
        • By End User
    • Spain
      • Pricing Analysis
      • Market Share Analysis, 2024
        • By Product Type
        • By Key Ingredients
        • By Application Area
        • By Channel
        • By End User
    • Belgium
      • Pricing Analysis
      • Market Share Analysis, 2024
        • By Product Type
        • By Key Ingredients
        • By Application Area
        • By Channel
        • By End User
    • Netherlands
      • Pricing Analysis
      • Market Share Analysis, 2024
        • By Product Type
        • By Key Ingredients
        • By Application Area
        • By Channel
        • By End User
    • Nordic
      • Pricing Analysis
      • Market Share Analysis, 2024
        • By Product Type
        • By Key Ingredients
        • By Application Area
        • By Channel
        • By End User
    • Switzerland
      • Pricing Analysis
      • Market Share Analysis, 2024
        • By Product Type
        • By Key Ingredients
        • By Application Area
        • By Channel
        • By End User
    • Russia
      • Pricing Analysis
      • Market Share Analysis, 2024
        • By Product Type
        • By Key Ingredients
        • By Application Area
        • By Channel
        • By End User
    • Poland
      • Pricing Analysis
      • Market Share Analysis, 2024
        • By Product Type
        • By Key Ingredients
        • By Application Area
        • By Channel
        • By End User
    • China
      • Pricing Analysis
      • Market Share Analysis, 2024
        • By Product Type
        • By Key Ingredients
        • By Application Area
        • By Channel
        • By End User
    • Japan
      • Pricing Analysis
      • Market Share Analysis, 2024
        • By Product Type
        • By Key Ingredients
        • By Application Area
        • By Channel
        • By End User
    • South Korea
      • Pricing Analysis
      • Market Share Analysis, 2024
        • By Product Type
        • By Key Ingredients
        • By Application Area
        • By Channel
        • By End User
    • India
      • Pricing Analysis
      • Market Share Analysis, 2024
        • By Product Type
        • By Key Ingredients
        • By Application Area
        • By Channel
        • By End User
    • Thailand
      • Pricing Analysis
      • Market Share Analysis, 2024
        • By Product Type
        • By Key Ingredients
        • By Application Area
        • By Channel
        • By End User
    • Indonesia
      • Pricing Analysis
      • Market Share Analysis, 2024
        • By Product Type
        • By Key Ingredients
        • By Application Area
        • By Channel
        • By End User
    • Australia
      • Pricing Analysis
      • Market Share Analysis, 2024
        • By Product Type
        • By Key Ingredients
        • By Application Area
        • By Channel
        • By End User
    • New Zealand
      • Pricing Analysis
      • Market Share Analysis, 2024
        • By Product Type
        • By Key Ingredients
        • By Application Area
        • By Channel
        • By End User
    • Turkey
      • Pricing Analysis
      • Market Share Analysis, 2024
        • By Product Type
        • By Key Ingredients
        • By Application Area
        • By Channel
        • By End User
    • UAE
      • Pricing Analysis
      • Market Share Analysis, 2024
        • By Product Type
        • By Key Ingredients
        • By Application Area
        • By Channel
        • By End User
    • Saudi Arabia
      • Pricing Analysis
      • Market Share Analysis, 2024
        • By Product Type
        • By Key Ingredients
        • By Application Area
        • By Channel
        • By End User
    • Israel
      • Pricing Analysis
      • Market Share Analysis, 2024
        • By Product Type
        • By Key Ingredients
        • By Application Area
        • By Channel
        • By End User
    • North Africa
      • Pricing Analysis
      • Market Share Analysis, 2024
        • By Product Type
        • By Key Ingredients
        • By Application Area
        • By Channel
        • By End User
    • South Africa
      • Pricing Analysis
      • Market Share Analysis, 2024
        • By Product Type
        • By Key Ingredients
        • By Application Area
        • By Channel
        • By End User
  18. Market Structure Analysis
    • Competition Dashboard
    • Competition Benchmarking
    • Market Share Analysis of Top Players
      • By Regional
      • By Product Type
      • By Key Ingredients
      • By Application Area
      • By Channel
      • By End User
  19. Competition Analysis
    • Competition Deep Dive
      • Veet
        • Overview
        • Product Portfolio
        • Profitability by Market Segments (Product/Age /Sales Channel/Region)
        • Sales Footprint
        • Strategy Overview
          • Marketing Strategy
          • Product Strategy
          • Channel Strategy
      • Nair
        • Overview
        • Product Portfolio
        • Profitability by Market Segments (Product/Age /Sales Channel/Region)
        • Sales Footprint
        • Strategy Overview
          • Marketing Strategy
          • Product Strategy
          • Channel Strategy
      • Sally Hansen
        • Overview
        • Product Portfolio
        • Profitability by Market Segments (Product/Age /Sales Channel/Region)
        • Sales Footprint
        • Strategy Overview
          • Marketing Strategy
          • Product Strategy
          • Channel Strategy
      • Veet Men
        • Overview
        • Product Portfolio
        • Profitability by Market Segments (Product/Age /Sales Channel/Region)
        • Sales Footprint
        • Strategy Overview
          • Marketing Strategy
          • Product Strategy
          • Channel Strategy
      • Veet Pure
        • Overview
        • Product Portfolio
        • Profitability by Market Segments (Product/Age /Sales Channel/Region)
        • Sales Footprint
        • Strategy Overview
          • Marketing Strategy
          • Product Strategy
          • Channel Strategy
      • Avon
        • Overview
        • Product Portfolio
        • Profitability by Market Segments (Product/Age /Sales Channel/Region)
        • Sales Footprint
        • Strategy Overview
          • Marketing Strategy
          • Product Strategy
          • Channel Strategy
      • Olay
        • Overview
        • Product Portfolio
        • Profitability by Market Segments (Product/Age /Sales Channel/Region)
        • Sales Footprint
        • Strategy Overview
          • Marketing Strategy
          • Product Strategy
          • Channel Strategy
      • Parissa
        • Overview
        • Product Portfolio
        • Profitability by Market Segments (Product/Age /Sales Channel/Region)
        • Sales Footprint
        • Strategy Overview
          • Marketing Strategy
          • Product Strategy
          • Channel Strategy
      • Veet Sensitive
        • Overview
        • Product Portfolio
        • Profitability by Market Segments (Product/Age /Sales Channel/Region)
        • Sales Footprint
        • Strategy Overview
          • Marketing Strategy
          • Product Strategy
          • Channel Strategy
      • Nad’s
        • Overview
        • Product Portfolio
        • Profitability by Market Segments (Product/Age /Sales Channel/Region)
        • Sales Footprint
        • Strategy Overview
          • Marketing Strategy
          • Product Strategy
          • Channel Strategy
      • Others
        • Overview
        • Product Portfolio
        • Profitability by Market Segments (Product/Age /Sales Channel/Region)
        • Sales Footprint
        • Strategy Overview
          • Marketing Strategy
          • Product Strategy
          • Channel Strategy
  20. Assumptions & Acronyms Used
  21. Research Methodology

List of Tables

  • Table 1: Global Market Value (USD Million) Forecast by Region, 2020-2035
  • Table 2: Global Market Volume (Units) Forecast by Region, 2020-2035
  • Table 3: Global Market Value (USD Million) Forecast by Product Type, 2020-2035
  • Table 4: Global Market Volume (Units) Forecast by Product Type, 2020-2035
  • Table 5: Global Market Value (USD Million) Forecast by Key Ingredients, 2020-2035
  • Table 6: Global Market Volume (Units) Forecast by Key Ingredients, 2020-2035
  • Table 7: Global Market Value (USD Million) Forecast by Application Area, 2020-2035
  • Table 8: Global Market Volume (Units) Forecast by Application Area, 2020-2035
  • Table 9: Global Market Value (USD Million) Forecast by Channel, 2020-2035
  • Table 10: Global Market Volume (Units) Forecast by Channel, 2020-2035
  • Table 11: Global Market Value (USD Million) Forecast by End User, 2020-2035
  • Table 12: Global Market Volume (Units) Forecast by End User, 2020-2035
  • Table 13: North America Market Value (USD Million) Forecast by Country, 2020-2035
  • Table 14: North America Market Volume (Units) Forecast by Country, 2020-2035
  • Table 15: North America Market Value (USD Million) Forecast by Product Type, 2020-2035
  • Table 16: North America Market Volume (Units) Forecast by Product Type, 2020-2035
  • Table 17: North America Market Value (USD Million) Forecast by Key Ingredients, 2020-2035
  • Table 18: North America Market Volume (Units) Forecast by Key Ingredients, 2020-2035
  • Table 19: North America Market Value (USD Million) Forecast by Application Area, 2020-2035
  • Table 20: North America Market Volume (Units) Forecast by Application Area, 2020-2035
  • Table 21: North America Market Value (USD Million) Forecast by Channel, 2020-2035
  • Table 22: North America Market Volume (Units) Forecast by Channel, 2020-2035
  • Table 23: North America Market Value (USD Million) Forecast by End User, 2020-2035
  • Table 24: North America Market Volume (Units) Forecast by End User, 2020-2035
  • Table 25: Latin America Market Value (USD Million) Forecast by Country, 2020-2035
  • Table 26: Latin America Market Volume (Units) Forecast by Country, 2020-2035
  • Table 27: Latin America Market Value (USD Million) Forecast by Product Type, 2020-2035
  • Table 28: Latin America Market Volume (Units) Forecast by Product Type, 2020-2035
  • Table 29: Latin America Market Value (USD Million) Forecast by Key Ingredients, 2020-2035
  • Table 30: Latin America Market Volume (Units) Forecast by Key Ingredients, 2020-2035
  • Table 31: Latin America Market Value (USD Million) Forecast by Application Area, 2020-2035
  • Table 32: Latin America Market Volume (Units) Forecast by Application Area, 2020-2035
  • Table 33: Latin America Market Value (USD Million) Forecast by Channel, 2020-2035
  • Table 34: Latin America Market Volume (Units) Forecast by Channel, 2020-2035
  • Table 35: Latin America Market Value (USD Million) Forecast by End User, 2020-2035
  • Table 36: Latin America Market Volume (Units) Forecast by End User, 2020-2035
  • Table 37: Europe Market Value (USD Million) Forecast by Country, 2020-2035
  • Table 38: Europe Market Volume (Units) Forecast by Country, 2020-2035
  • Table 39: Europe Market Value (USD Million) Forecast by Product Type, 2020-2035
  • Table 40: Europe Market Volume (Units) Forecast by Product Type, 2020-2035
  • Table 41: Europe Market Value (USD Million) Forecast by Key Ingredients, 2020-2035
  • Table 42: Europe Market Volume (Units) Forecast by Key Ingredients, 2020-2035
  • Table 43: Europe Market Value (USD Million) Forecast by Application Area, 2020-2035
  • Table 44: Europe Market Volume (Units) Forecast by Application Area, 2020-2035
  • Table 45: Europe Market Value (USD Million) Forecast by Channel, 2020-2035
  • Table 46: Europe Market Volume (Units) Forecast by Channel, 2020-2035
  • Table 47: Europe Market Value (USD Million) Forecast by End User, 2020-2035
  • Table 48: Europe Market Volume (Units) Forecast by End User, 2020-2035
  • Table 49: East Asia Market Value (USD Million) Forecast by Country, 2020-2035
  • Table 50: East Asia Market Volume (Units) Forecast by Country, 2020-2035
  • Table 51: East Asia Market Value (USD Million) Forecast by Product Type, 2020-2035
  • Table 52: East Asia Market Volume (Units) Forecast by Product Type, 2020-2035
  • Table 53: East Asia Market Value (USD Million) Forecast by Key Ingredients, 2020-2035
  • Table 54: East Asia Market Volume (Units) Forecast by Key Ingredients, 2020-2035
  • Table 55: East Asia Market Value (USD Million) Forecast by Application Area, 2020-2035
  • Table 56: East Asia Market Volume (Units) Forecast by Application Area, 2020-2035
  • Table 57: East Asia Market Value (USD Million) Forecast by Channel, 2020-2035
  • Table 58: East Asia Market Volume (Units) Forecast by Channel, 2020-2035
  • Table 59: East Asia Market Value (USD Million) Forecast by End User, 2020-2035
  • Table 60: East Asia Market Volume (Units) Forecast by End User, 2020-2035
  • Table 61: South Asia & Pacific Market Value (USD Million) Forecast by Country, 2020-2035
  • Table 62: South Asia & Pacific Market Volume (Units) Forecast by Country, 2020-2035
  • Table 63: South Asia & Pacific Market Value (USD Million) Forecast by Product Type, 2020-2035
  • Table 64: South Asia & Pacific Market Volume (Units) Forecast by Product Type, 2020-2035
  • Table 65: South Asia & Pacific Market Value (USD Million) Forecast by Key Ingredients, 2020-2035
  • Table 66: South Asia & Pacific Market Volume (Units) Forecast by Key Ingredients, 2020-2035
  • Table 67: South Asia & Pacific Market Value (USD Million) Forecast by Application Area, 2020-2035
  • Table 68: South Asia & Pacific Market Volume (Units) Forecast by Application Area, 2020-2035
  • Table 69: South Asia & Pacific Market Value (USD Million) Forecast by Channel, 2020-2035
  • Table 70: South Asia & Pacific Market Volume (Units) Forecast by Channel, 2020-2035
  • Table 71: South Asia & Pacific Market Value (USD Million) Forecast by End User, 2020-2035
  • Table 72: South Asia & Pacific Market Volume (Units) Forecast by End User, 2020-2035
  • Table 73: Middle East and Africa Market Value (USD Million) Forecast by Country, 2020-2035
  • Table 74: Middle East and Africa Market Volume (Units) Forecast by Country, 2020-2035
  • Table 75: Middle East and Africa Market Value (USD Million) Forecast by Product Type, 2020-2035
  • Table 76: Middle East and Africa Market Volume (Units) Forecast by Product Type, 2020-2035
  • Table 77: Middle East and Africa Market Value (USD Million) Forecast by Key Ingredients, 2020-2035
  • Table 78: Middle East and Africa Market Volume (Units) Forecast by Key Ingredients, 2020-2035
  • Table 79: Middle East and Africa Market Value (USD Million) Forecast by Application Area, 2020-2035
  • Table 80: Middle East and Africa Market Volume (Units) Forecast by Application Area, 2020-2035
  • Table 81: Middle East and Africa Market Value (USD Million) Forecast by Channel, 2020-2035
  • Table 82: Middle East and Africa Market Volume (Units) Forecast by Channel, 2020-2035
  • Table 83: Middle East and Africa Market Value (USD Million) Forecast by End User, 2020-2035
  • Table 84: Middle East and Africa Market Volume (Units) Forecast by End User, 2020-2035

List of Figures

  • Figure 1: Global Market Value (USD Million) by Product Type, 2025-2035
  • Figure 2: Global Market Value (USD Million) by Key Ingredients, 2025-2035
  • Figure 3: Global Market Value (USD Million) by Application Area, 2025-2035
  • Figure 4: Global Market Value (USD Million) by Channel, 2025-2035
  • Figure 5: Global Market Value (USD Million) by End User, 2025-2035
  • Figure 6: Global Market Value (USD Million) by Region, 2025-2035
  • Figure 7: Global Market Value (USD Million) Analysis by Region, 2020-2035
  • Figure 8: Global Market Volume (Units) Analysis by Region, 2020-2035
  • Figure 9: Global Market Value Share (%) and BPS Analysis by Region, 2025-2035
  • Figure 10: Global Market Y-o-Y Growth (%) Projections by Region, 2025-2035
  • Figure 11: Global Market Value (USD Million) Analysis by Product Type, 2020-2035
  • Figure 12: Global Market Volume (Units) Analysis by Product Type, 2020-2035
  • Figure 13: Global Market Value Share (%) and BPS Analysis by Product Type, 2025-2035
  • Figure 14: Global Market Y-o-Y Growth (%) Projections by Product Type, 2025-2035
  • Figure 15: Global Market Value (USD Million) Analysis by Key Ingredients, 2020-2035
  • Figure 16: Global Market Volume (Units) Analysis by Key Ingredients, 2020-2035
  • Figure 17: Global Market Value Share (%) and BPS Analysis by Key Ingredients, 2025-2035
  • Figure 18: Global Market Y-o-Y Growth (%) Projections by Key Ingredients, 2025-2035
  • Figure 19: Global Market Value (USD Million) Analysis by Application Area, 2020-2035
  • Figure 20: Global Market Volume (Units) Analysis by Application Area, 2020-2035
  • Figure 21: Global Market Value Share (%) and BPS Analysis by Application Area, 2025-2035
  • Figure 22: Global Market Y-o-Y Growth (%) Projections by Application Area, 2025-2035
  • Figure 23: Global Market Value (USD Million) Analysis by Channel, 2020-2035
  • Figure 24: Global Market Volume (Units) Analysis by Channel, 2020-2035
  • Figure 25: Global Market Value Share (%) and BPS Analysis by Channel, 2025-2035
  • Figure 26: Global Market Y-o-Y Growth (%) Projections by Channel, 2025-2035
  • Figure 27: Global Market Value (USD Million) Analysis by End User, 2020-2035
  • Figure 28: Global Market Volume (Units) Analysis by End User, 2020-2035
  • Figure 29: Global Market Value Share (%) and BPS Analysis by End User, 2025-2035
  • Figure 30: Global Market Y-o-Y Growth (%) Projections by End User, 2025-2035
  • Figure 31: Global Market Attractiveness by Product Type, 2025-2035
  • Figure 32: Global Market Attractiveness by Key Ingredients, 2025-2035
  • Figure 33: Global Market Attractiveness by Application Area, 2025-2035
  • Figure 34: Global Market Attractiveness by Channel, 2025-2035
  • Figure 35: Global Market Attractiveness by End User, 2025-2035
  • Figure 36: Global Market Attractiveness by Region, 2025-2035
  • Figure 37: North America Market Value (USD Million) by Product Type, 2025-2035
  • Figure 38: North America Market Value (USD Million) by Key Ingredients, 2025-2035
  • Figure 39: North America Market Value (USD Million) by Application Area, 2025-2035
  • Figure 40: North America Market Value (USD Million) by Channel, 2025-2035
  • Figure 41: North America Market Value (USD Million) by End User, 2025-2035
  • Figure 42: North America Market Value (USD Million) by Country, 2025-2035
  • Figure 43: North America Market Value (USD Million) Analysis by Country, 2020-2035
  • Figure 44: North America Market Volume (Units) Analysis by Country, 2020-2035
  • Figure 45: North America Market Value Share (%) and BPS Analysis by Country, 2025-2035
  • Figure 46: North America Market Y-o-Y Growth (%) Projections by Country, 2025-2035
  • Figure 47: North America Market Value (USD Million) Analysis by Product Type, 2020-2035
  • Figure 48: North America Market Volume (Units) Analysis by Product Type, 2020-2035
  • Figure 49: North America Market Value Share (%) and BPS Analysis by Product Type, 2025-2035
  • Figure 50: North America Market Y-o-Y Growth (%) Projections by Product Type, 2025-2035
  • Figure 51: North America Market Value (USD Million) Analysis by Key Ingredients, 2020-2035
  • Figure 52: North America Market Volume (Units) Analysis by Key Ingredients, 2020-2035
  • Figure 53: North America Market Value Share (%) and BPS Analysis by Key Ingredients, 2025-2035
  • Figure 54: North America Market Y-o-Y Growth (%) Projections by Key Ingredients, 2025-2035
  • Figure 55: North America Market Value (USD Million) Analysis by Application Area, 2020-2035
  • Figure 56: North America Market Volume (Units) Analysis by Application Area, 2020-2035
  • Figure 57: North America Market Value Share (%) and BPS Analysis by Application Area, 2025-2035
  • Figure 58: North America Market Y-o-Y Growth (%) Projections by Application Area, 2025-2035
  • Figure 59: North America Market Value (USD Million) Analysis by Channel, 2020-2035
  • Figure 60: North America Market Volume (Units) Analysis by Channel, 2020-2035
  • Figure 61: North America Market Value Share (%) and BPS Analysis by Channel, 2025-2035
  • Figure 62: North America Market Y-o-Y Growth (%) Projections by Channel, 2025-2035
  • Figure 63: North America Market Value (USD Million) Analysis by End User, 2020-2035
  • Figure 64: North America Market Volume (Units) Analysis by End User, 2020-2035
  • Figure 65: North America Market Value Share (%) and BPS Analysis by End User, 2025-2035
  • Figure 66: North America Market Y-o-Y Growth (%) Projections by End User, 2025-2035
  • Figure 67: North America Market Attractiveness by Product Type, 2025-2035
  • Figure 68: North America Market Attractiveness by Key Ingredients, 2025-2035
  • Figure 69: North America Market Attractiveness by Application Area, 2025-2035
  • Figure 70: North America Market Attractiveness by Channel, 2025-2035
  • Figure 71: North America Market Attractiveness by End User, 2025-2035
  • Figure 72: North America Market Attractiveness by Country, 2025-2035
  • Figure 73: Latin America Market Value (USD Million) by Product Type, 2025-2035
  • Figure 74: Latin America Market Value (USD Million) by Key Ingredients, 2025-2035
  • Figure 75: Latin America Market Value (USD Million) by Application Area, 2025-2035
  • Figure 76: Latin America Market Value (USD Million) by Channel, 2025-2035
  • Figure 77: Latin America Market Value (USD Million) by End User, 2025-2035
  • Figure 78: Latin America Market Value (USD Million) by Country, 2025-2035
  • Figure 79: Latin America Market Value (USD Million) Analysis by Country, 2020-2035
  • Figure 80: Latin America Market Volume (Units) Analysis by Country, 2020-2035
  • Figure 81: Latin America Market Value Share (%) and BPS Analysis by Country, 2025-2035
  • Figure 82: Latin America Market Y-o-Y Growth (%) Projections by Country, 2025-2035
  • Figure 83: Latin America Market Value (USD Million) Analysis by Product Type, 2020-2035
  • Figure 84: Latin America Market Volume (Units) Analysis by Product Type, 2020-2035
  • Figure 85: Latin America Market Value Share (%) and BPS Analysis by Product Type, 2025-2035
  • Figure 86: Latin America Market Y-o-Y Growth (%) Projections by Product Type, 2025-2035
  • Figure 87: Latin America Market Value (USD Million) Analysis by Key Ingredients, 2020-2035
  • Figure 88: Latin America Market Volume (Units) Analysis by Key Ingredients, 2020-2035
  • Figure 89: Latin America Market Value Share (%) and BPS Analysis by Key Ingredients, 2025-2035
  • Figure 90: Latin America Market Y-o-Y Growth (%) Projections by Key Ingredients, 2025-2035
  • Figure 91: Latin America Market Value (USD Million) Analysis by Application Area, 2020-2035
  • Figure 92: Latin America Market Volume (Units) Analysis by Application Area, 2020-2035
  • Figure 93: Latin America Market Value Share (%) and BPS Analysis by Application Area, 2025-2035
  • Figure 94: Latin America Market Y-o-Y Growth (%) Projections by Application Area, 2025-2035
  • Figure 95: Latin America Market Value (USD Million) Analysis by Channel, 2020-2035
  • Figure 96: Latin America Market Volume (Units) Analysis by Channel, 2020-2035
  • Figure 97: Latin America Market Value Share (%) and BPS Analysis by Channel, 2025-2035
  • Figure 98: Latin America Market Y-o-Y Growth (%) Projections by Channel, 2025-2035
  • Figure 99: Latin America Market Value (USD Million) Analysis by End User, 2020-2035
  • Figure 100: Latin America Market Volume (Units) Analysis by End User, 2020-2035
  • Figure 101: Latin America Market Value Share (%) and BPS Analysis by End User, 2025-2035
  • Figure 102: Latin America Market Y-o-Y Growth (%) Projections by End User, 2025-2035
  • Figure 103: Latin America Market Attractiveness by Product Type, 2025-2035
  • Figure 104: Latin America Market Attractiveness by Key Ingredients, 2025-2035
  • Figure 105: Latin America Market Attractiveness by Application Area, 2025-2035
  • Figure 106: Latin America Market Attractiveness by Channel, 2025-2035
  • Figure 107: Latin America Market Attractiveness by End User, 2025-2035
  • Figure 108: Latin America Market Attractiveness by Country, 2025-2035
  • Figure 109: Europe Market Value (USD Million) by Product Type, 2025-2035
  • Figure 110: Europe Market Value (USD Million) by Key Ingredients, 2025-2035
  • Figure 111: Europe Market Value (USD Million) by Application Area, 2025-2035
  • Figure 112: Europe Market Value (USD Million) by Channel, 2025-2035
  • Figure 113: Europe Market Value (USD Million) by End User, 2025-2035
  • Figure 114: Europe Market Value (USD Million) by Country, 2025-2035
  • Figure 115: Europe Market Value (USD Million) Analysis by Country, 2020-2035
  • Figure 116: Europe Market Volume (Units) Analysis by Country, 2020-2035
  • Figure 117: Europe Market Value Share (%) and BPS Analysis by Country, 2025-2035
  • Figure 118: Europe Market Y-o-Y Growth (%) Projections by Country, 2025-2035
  • Figure 119: Europe Market Value (USD Million) Analysis by Product Type, 2020-2035
  • Figure 120: Europe Market Volume (Units) Analysis by Product Type, 2020-2035
  • Figure 121: Europe Market Value Share (%) and BPS Analysis by Product Type, 2025-2035
  • Figure 122: Europe Market Y-o-Y Growth (%) Projections by Product Type, 2025-2035
  • Figure 123: Europe Market Value (USD Million) Analysis by Key Ingredients, 2020-2035
  • Figure 124: Europe Market Volume (Units) Analysis by Key Ingredients, 2020-2035
  • Figure 125: Europe Market Value Share (%) and BPS Analysis by Key Ingredients, 2025-2035
  • Figure 126: Europe Market Y-o-Y Growth (%) Projections by Key Ingredients, 2025-2035
  • Figure 127: Europe Market Value (USD Million) Analysis by Application Area, 2020-2035
  • Figure 128: Europe Market Volume (Units) Analysis by Application Area, 2020-2035
  • Figure 129: Europe Market Value Share (%) and BPS Analysis by Application Area, 2025-2035
  • Figure 130: Europe Market Y-o-Y Growth (%) Projections by Application Area, 2025-2035
  • Figure 131: Europe Market Value (USD Million) Analysis by Channel, 2020-2035
  • Figure 132: Europe Market Volume (Units) Analysis by Channel, 2020-2035
  • Figure 133: Europe Market Value Share (%) and BPS Analysis by Channel, 2025-2035
  • Figure 134: Europe Market Y-o-Y Growth (%) Projections by Channel, 2025-2035
  • Figure 135: Europe Market Value (USD Million) Analysis by End User, 2020-2035
  • Figure 136: Europe Market Volume (Units) Analysis by End User, 2020-2035
  • Figure 137: Europe Market Value Share (%) and BPS Analysis by End User, 2025-2035
  • Figure 138: Europe Market Y-o-Y Growth (%) Projections by End User, 2025-2035
  • Figure 139: Europe Market Attractiveness by Product Type, 2025-2035
  • Figure 140: Europe Market Attractiveness by Key Ingredients, 2025-2035
  • Figure 141: Europe Market Attractiveness by Application Area, 2025-2035
  • Figure 142: Europe Market Attractiveness by Channel, 2025-2035
  • Figure 143: Europe Market Attractiveness by End User, 2025-2035
  • Figure 144: Europe Market Attractiveness by Country, 2025-2035
  • Figure 145: East Asia Market Value (USD Million) by Product Type, 2025-2035
  • Figure 146: East Asia Market Value (USD Million) by Key Ingredients, 2025-2035
  • Figure 147: East Asia Market Value (USD Million) by Application Area, 2025-2035
  • Figure 148: East Asia Market Value (USD Million) by Channel, 2025-2035
  • Figure 149: East Asia Market Value (USD Million) by End User, 2025-2035
  • Figure 150: East Asia Market Value (USD Million) by Country, 2025-2035
  • Figure 151: East Asia Market Value (USD Million) Analysis by Country, 2020-2035
  • Figure 152: East Asia Market Volume (Units) Analysis by Country, 2020-2035
  • Figure 153: East Asia Market Value Share (%) and BPS Analysis by Country, 2025-2035
  • Figure 154: East Asia Market Y-o-Y Growth (%) Projections by Country, 2025-2035
  • Figure 155: East Asia Market Value (USD Million) Analysis by Product Type, 2020-2035
  • Figure 156: East Asia Market Volume (Units) Analysis by Product Type, 2020-2035
  • Figure 157: East Asia Market Value Share (%) and BPS Analysis by Product Type, 2025-2035
  • Figure 158: East Asia Market Y-o-Y Growth (%) Projections by Product Type, 2025-2035
  • Figure 159: East Asia Market Value (USD Million) Analysis by Key Ingredients, 2020-2035
  • Figure 160: East Asia Market Volume (Units) Analysis by Key Ingredients, 2020-2035
  • Figure 161: East Asia Market Value Share (%) and BPS Analysis by Key Ingredients, 2025-2035
  • Figure 162: East Asia Market Y-o-Y Growth (%) Projections by Key Ingredients, 2025-2035
  • Figure 163: East Asia Market Value (USD Million) Analysis by Application Area, 2020-2035
  • Figure 164: East Asia Market Volume (Units) Analysis by Application Area, 2020-2035
  • Figure 165: East Asia Market Value Share (%) and BPS Analysis by Application Area, 2025-2035
  • Figure 166: East Asia Market Y-o-Y Growth (%) Projections by Application Area, 2025-2035
  • Figure 167: East Asia Market Value (USD Million) Analysis by Channel, 2020-2035
  • Figure 168: East Asia Market Volume (Units) Analysis by Channel, 2020-2035
  • Figure 169: East Asia Market Value Share (%) and BPS Analysis by Channel, 2025-2035
  • Figure 170: East Asia Market Y-o-Y Growth (%) Projections by Channel, 2025-2035
  • Figure 171: East Asia Market Value (USD Million) Analysis by End User, 2020-2035
  • Figure 172: East Asia Market Volume (Units) Analysis by End User, 2020-2035
  • Figure 173: East Asia Market Value Share (%) and BPS Analysis by End User, 2025-2035
  • Figure 174: East Asia Market Y-o-Y Growth (%) Projections by End User, 2025-2035
  • Figure 175: East Asia Market Attractiveness by Product Type, 2025-2035
  • Figure 176: East Asia Market Attractiveness by Key Ingredients, 2025-2035
  • Figure 177: East Asia Market Attractiveness by Application Area, 2025-2035
  • Figure 178: East Asia Market Attractiveness by Channel, 2025-2035
  • Figure 179: East Asia Market Attractiveness by End User, 2025-2035
  • Figure 180: East Asia Market Attractiveness by Country, 2025-2035
  • Figure 181: South Asia & Pacific Market Value (USD Million) by Product Type, 2025-2035
  • Figure 182: South Asia & Pacific Market Value (USD Million) by Key Ingredients, 2025-2035
  • Figure 183: South Asia & Pacific Market Value (USD Million) by Application Area, 2025-2035
  • Figure 184: South Asia & Pacific Market Value (USD Million) by Channel, 2025-2035
  • Figure 185: South Asia & Pacific Market Value (USD Million) by End User, 2025-2035
  • Figure 186: South Asia & Pacific Market Value (USD Million) by Country, 2025-2035
  • Figure 187: South Asia & Pacific Market Value (USD Million) Analysis by Country, 2020-2035
  • Figure 188: South Asia & Pacific Market Volume (Units) Analysis by Country, 2020-2035
  • Figure 189: South Asia & Pacific Market Value Share (%) and BPS Analysis by Country, 2025-2035
  • Figure 190: South Asia & Pacific Market Y-o-Y Growth (%) Projections by Country, 2025-2035
  • Figure 191: South Asia & Pacific Market Value (USD Million) Analysis by Product Type, 2020-2035
  • Figure 192: South Asia & Pacific Market Volume (Units) Analysis by Product Type, 2020-2035
  • Figure 193: South Asia & Pacific Market Value Share (%) and BPS Analysis by Product Type, 2025-2035
  • Figure 194: South Asia & Pacific Market Y-o-Y Growth (%) Projections by Product Type, 2025-2035
  • Figure 195: South Asia & Pacific Market Value (USD Million) Analysis by Key Ingredients, 2020-2035
  • Figure 196: South Asia & Pacific Market Volume (Units) Analysis by Key Ingredients, 2020-2035
  • Figure 197: South Asia & Pacific Market Value Share (%) and BPS Analysis by Key Ingredients, 2025-2035
  • Figure 198: South Asia & Pacific Market Y-o-Y Growth (%) Projections by Key Ingredients, 2025-2035
  • Figure 199: South Asia & Pacific Market Value (USD Million) Analysis by Application Area, 2020-2035
  • Figure 200: South Asia & Pacific Market Volume (Units) Analysis by Application Area, 2020-2035
  • Figure 201: South Asia & Pacific Market Value Share (%) and BPS Analysis by Application Area, 2025-2035
  • Figure 202: South Asia & Pacific Market Y-o-Y Growth (%) Projections by Application Area, 2025-2035
  • Figure 203: South Asia & Pacific Market Value (USD Million) Analysis by Channel, 2020-2035
  • Figure 204: South Asia & Pacific Market Volume (Units) Analysis by Channel, 2020-2035
  • Figure 205: South Asia & Pacific Market Value Share (%) and BPS Analysis by Channel, 2025-2035
  • Figure 206: South Asia & Pacific Market Y-o-Y Growth (%) Projections by Channel, 2025-2035
  • Figure 207: South Asia & Pacific Market Value (USD Million) Analysis by End User, 2020-2035
  • Figure 208: South Asia & Pacific Market Volume (Units) Analysis by End User, 2020-2035
  • Figure 209: South Asia & Pacific Market Value Share (%) and BPS Analysis by End User, 2025-2035
  • Figure 210: South Asia & Pacific Market Y-o-Y Growth (%) Projections by End User, 2025-2035
  • Figure 211: South Asia & Pacific Market Attractiveness by Product Type, 2025-2035
  • Figure 212: South Asia & Pacific Market Attractiveness by Key Ingredients, 2025-2035
  • Figure 213: South Asia & Pacific Market Attractiveness by Application Area, 2025-2035
  • Figure 214: South Asia & Pacific Market Attractiveness by Channel, 2025-2035
  • Figure 215: South Asia & Pacific Market Attractiveness by End User, 2025-2035
  • Figure 216: South Asia & Pacific Market Attractiveness by Country, 2025-2035
  • Figure 217: Middle East and Africa Market Value (USD Million) by Product Type, 2025-2035
  • Figure 218: Middle East and Africa Market Value (USD Million) by Key Ingredients, 2025-2035
  • Figure 219: Middle East and Africa Market Value (USD Million) by Application Area, 2025-2035
  • Figure 220: Middle East and Africa Market Value (USD Million) by Channel, 2025-2035
  • Figure 221: Middle East and Africa Market Value (USD Million) by End User, 2025-2035
  • Figure 222: Middle East and Africa Market Value (USD Million) by Country, 2025-2035
  • Figure 223: Middle East and Africa Market Value (USD Million) Analysis by Country, 2020-2035
  • Figure 224: Middle East and Africa Market Volume (Units) Analysis by Country, 2020-2035
  • Figure 225: Middle East and Africa Market Value Share (%) and BPS Analysis by Country, 2025-2035
  • Figure 226: Middle East and Africa Market Y-o-Y Growth (%) Projections by Country, 2025-2035
  • Figure 227: Middle East and Africa Market Value (USD Million) Analysis by Product Type, 2020-2035
  • Figure 228: Middle East and Africa Market Volume (Units) Analysis by Product Type, 2020-2035
  • Figure 229: Middle East and Africa Market Value Share (%) and BPS Analysis by Product Type, 2025-2035
  • Figure 230: Middle East and Africa Market Y-o-Y Growth (%) Projections by Product Type, 2025-2035
  • Figure 231: Middle East and Africa Market Value (USD Million) Analysis by Key Ingredients, 2020-2035
  • Figure 232: Middle East and Africa Market Volume (Units) Analysis by Key Ingredients, 2020-2035
  • Figure 233: Middle East and Africa Market Value Share (%) and BPS Analysis by Key Ingredients, 2025-2035
  • Figure 234: Middle East and Africa Market Y-o-Y Growth (%) Projections by Key Ingredients, 2025-2035
  • Figure 235: Middle East and Africa Market Value (USD Million) Analysis by Application Area, 2020-2035
  • Figure 236: Middle East and Africa Market Volume (Units) Analysis by Application Area, 2020-2035
  • Figure 237: Middle East and Africa Market Value Share (%) and BPS Analysis by Application Area, 2025-2035
  • Figure 238: Middle East and Africa Market Y-o-Y Growth (%) Projections by Application Area, 2025-2035
  • Figure 239: Middle East and Africa Market Value (USD Million) Analysis by Channel, 2020-2035
  • Figure 240: Middle East and Africa Market Volume (Units) Analysis by Channel, 2020-2035
  • Figure 241: Middle East and Africa Market Value Share (%) and BPS Analysis by Channel, 2025-2035
  • Figure 242: Middle East and Africa Market Y-o-Y Growth (%) Projections by Channel, 2025-2035
  • Figure 243: Middle East and Africa Market Value (USD Million) Analysis by End User, 2020-2035
  • Figure 244: Middle East and Africa Market Volume (Units) Analysis by End User, 2020-2035
  • Figure 245: Middle East and Africa Market Value Share (%) and BPS Analysis by End User, 2025-2035
  • Figure 246: Middle East and Africa Market Y-o-Y Growth (%) Projections by End User, 2025-2035
  • Figure 247: Middle East and Africa Market Attractiveness by Product Type, 2025-2035
  • Figure 248: Middle East and Africa Market Attractiveness by Key Ingredients, 2025-2035
  • Figure 249: Middle East and Africa Market Attractiveness by Application Area, 2025-2035
  • Figure 250: Middle East and Africa Market Attractiveness by Channel, 2025-2035
  • Figure 251: Middle East and Africa Market Attractiveness by End User, 2025-2035
  • Figure 252: Middle East and Africa Market Attractiveness by Country, 2025-2035

Frequently Asked Questions

How big is the Depilatory Hair Removal Creams Market in 2025?

The global Depilatory Hair Removal Creams Market is estimated to be valued at USD 2,951.7 million in 2025.

What will be the size of Depilatory Hair Removal Creams Market in 2035?

The market size for the Depilatory Hair Removal Creams Market is projected to reach USD 6,254.3 million by 2035.

How much will be the Depilatory Hair Removal Creams Market growth between 2025 and 2035?

The Depilatory Hair Removal Creams Market is expected to grow at a 7.8% CAGR between 2025 and 2035.

What are the key product types in the Depilatory Hair Removal Creams Market?

The key product types in the Depilatory Hair Removal Creams Market are creams, lotions, foams/aerosols, and roll-on gels. Among these, creams hold the dominant share owing to their easy application, quick results, and compatibility with a wide range of skin types, including sensitive skin.

Which range segment to contribute significant share in the Depilatory Hair Removal Creams Market in 2025?

In terms of product type, the creams segment is projected to command a 47.2% share in the Depilatory Hair Removal Creams Market in 2025, driven by rising demand for pain-free, affordable, and dermatologically tested hair removal solutions.

Explore Similar Insights

Future Market Insights

Depilatory Hair Removal Creams Market

Chat With MaRIA

Chat With

MaRIA

Hi There, I am MaRIA, Your Market Research Intelligence Assistant. How may I help you?