
- Market Size (2026)
- USD 445.8 Mn
- Forecast (2036)
- USD 1045.7 Mn
- CAGR (2026 to 2036)
- 8.9%
How Big is the Donut Fillings Market in 2026?
The donut fillings market is estimated at USD 445.8 million in 2026.
The global donut fillings market was valued at USD 409.4 million in 2025 and is estimated to reach USD 445.8 million in 2026. The market is projected to reach USD 1,045.7 million by 2036, expanding at a compound annual growth rate (CAGR) of 8.9% between 2026 and 2036. Glazed rings accounted for the largest share of the Product Type breakdown, contributing 33.0% of total revenue in 2026. Demand is supported by fruit, cream and custard fillings that allow bakeries to extend their range from an established dough and frying process. Conditions in the largest donut chains are mixed. Krispy Kreme reported 2025 net revenue of USD 1,522.6 million, down 8.6%, while systemwide sales rose by 0.7% in constant currency to USD 2.0 billion. Ingredient costs are also changing. The United States Department of Agriculture (USDA) Economic Research Service forecasts that egg prices will fall by 29.4% in 2026 after rising by 21.9% in 2025, while sugar and sweets prices are expected to rise by 6.6%. Suppliers continue to invest in fillings. For instance, CSM Ingredients launched its Creami range of bakery and pastry fillings in May 2026.
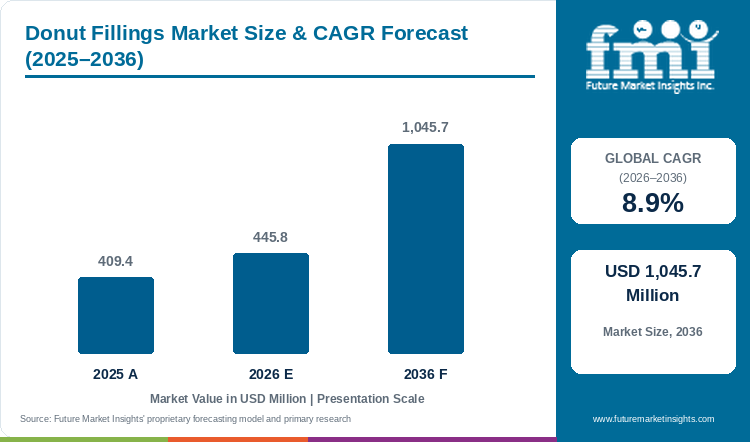
Table 1: Donut Fillings Market Size and Forecast (USD million), 2025 to 2036
| Market size and forecast | Value |
|---|---|
| 2025 market size | USD 409.4 million |
| Estimated market size in 2026 | USD 445.8 million |
| Projected market size by 2036 | USD 1,045.7 million |
| CAGR (2026-2036) | 8.9% |
| Added revenue, 2026 to 2036 | USD 599.9 million |
Key Market Trends & Insights
- By Product Type: The Glazed rings segment accounted for the largest share of the Product Type breakdown in 2026, representing 33.0% of total market revenue.
- By Form: Powder / dry bases held the leading market position with a share of 48.0% in 2026, with hydration and final cream preparation carried out at the bakery.
- By Application: Bread & rolls remained the largest application segment, accounting for 40.0% of the market in 2026.
Regional Highlights
- Fastest-growing country: The UAE is expected to record the highest growth rate among the eight profiled countries, with a projected CAGR of 10.0% between 2026 and 2036.
- Growth across other countries: Saudi Arabia is projected to expand at a CAGR of 9.7%, followed by South Korea at 9.4% and the USA at 9.1%. Japan is expected to register comparatively slower growth, with a CAGR of 7.8% during the forecast period.
The structure of donut retail is changing. Krispy Kreme reduced its global points of access by 2,363, or 13.5%, to 15,194 in 2025 through the closure of underperforming doors, and its adjusted EBITDA declined by 27.5% to USD 140.3 million following the termination of its business agreement with McDonald's USA. Organic revenue fell by only 1.3%, which indicates that demand at the remaining outlets held up. For filling suppliers, fewer but more productive outlets can concentrate orders on a smaller number of approved bakery fillings. Supplier capacity is also expanding. Puratos announced in February 2025 that its Buckingham site in the United Kingdom would consolidate filling production and increase capacity.
Raw material costs remain an important factor influencing filling prices. According to the USDA, retail egg prices rose by 21.9% in 2025, which increased the cost of custard and cream fillings, but are forecast to fall by 29.4% in 2026. In contrast, sugar and sweets prices are forecast to rise by 6.6%, while dairy prices are expected to increase by only 0.1%. Such changes affect the relative cost of cream, custard and fruit centres. New products are also widening the choice available to bakeries. CSM Ingredients' Creami range, launched in May 2026, offers filling textures and flavours for professional bakery, pastry and confectionery uses, although each texture creates different requirements at the injector.
Dawn's professional donut range includes fruit fillings and cream centres, illustrating the different profiles available for range development. Changes between these profiles also affect ingredient information. The US Food and Drug Administration's (FDA) January 2025 guidance addresses the declaration of major food allergens in covered foods, which makes the composition of each filling relevant to the finished-product label. Consistent composition reduces the need to reopen these decisions when a recipe moves to longer runs or additional outlets.
Table 2: Supporting Industry Indicators for the Donut Fillings Market, 2025 to 2026
| Indicator | Data point | Why it matters | Source |
|---|---|---|---|
| Chain revenue | Krispy Kreme reported 2025 net revenue of USD 1,522.6 million, down 8.6%, and organic revenue down 1.3%. | The results indicate demand conditions at the largest donut chain. | |
| Systemwide sales | Krispy Kreme systemwide sales reached USD 2.0 billion in 2025, up 0.7% in constant currency. | Systemwide sales reflect consumer spending on donuts across all outlets. | |
| Outlet network | Krispy Kreme points of access fell by 13.5% to 15,194 in 2025. | Fewer outlets can concentrate filling orders on approved products. | |
| Egg prices | US retail egg prices rose by 21.9% in 2025 and are forecast to fall by 29.4% in 2026. | Egg costs affect custard and cream filling prices. | |
| Sugar prices | US sugar and sweets prices are forecast to rise by 6.6% in 2026. | Sugar is a major component of fruit and cream fillings. | |
| Dairy prices | US dairy prices are forecast to rise by 0.1% in 2026. | Stable dairy costs support cream-based centres. | |
| Filling capacity | Puratos announced consolidated filling production and increased capacity at Buckingham in February 2025. | The project expands local supply for UK filling customers. | |
| Product launch | CSM Ingredients introduced Creami in May 2026 for bakery, pastry and confectionery professionals. | New textures and flavours expand the options for application trials. | |
| Allergen guidance | The FDA issued food-allergen labelling guidance in January 2025. | Filling composition determines the allergen information on finished donuts. | |
Demand Intensity Analysis
A comparison of FMI's market estimate with donut chain sales provides a measure of the importance of fillings. Krispy Kreme's systemwide sales reached USD 2.0 billion in 2025. FMI estimated the global donut fillings market at USD 409.4 million in 2025, which is equivalent to approximately 20.9% of the systemwide sales of a single leading chain. Since fillings are only one ingredient in a filled donut, and many donuts are sold unfilled, the comparison indicates that FMI's estimate covers a wide base of bakery customers beyond the major chains, including in-store bakeries and the use of donut fillings in other sweet goods.
Ingredient costs provide another reference point. US egg prices rose by 21.9% in 2025 and are forecast to fall by 29.4% in 2026, while sugar and sweets prices are forecast to rise by 6.6%. Overall US food prices rose by 2.9% in 2025 and are forecast to rise by 2.9% again in 2026. FMI's CAGR of 8.9% is approximately 6 percentage points higher than general food inflation, which implies that the forecast relies on growth in volume and premium fillings rather than on price increases alone.
A similar comparison can be made with outlet trends. Krispy Kreme's organic revenue fell by 1.3% in 2025 while its number of points of access declined by 13.5%, which suggests that sales per remaining outlet increased. If this pattern continues across the industry, demand for fillings may become more concentrated in high-volume production sites that require consistent injection performance.
Segment values show where demand is concentrated. Powder / dry represented USD 214.0 million in 2026, while Direct to industrial bakeries accounted for USD 245.2 million on the separate Sales Channel axis. Bread & rolls represented USD 178.3 million within the Application classification. FMI projects added market revenue of USD 599.9 million between 2026 and 2036, and the market is projected to reach 2.3 times its 2026 value by 2036.
Table 3: Demand Intensity Metrics for the Donut Fillings Market, 2025 Industry Data Against 2025 and 2026 Market Values
| Demand intensity metric | Value | Basis |
|---|---|---|
| FMI market value, 2025 | USD 409.4 million | FMI estimate of donut filling revenue. |
| Krispy Kreme systemwide sales, 2025 | USD 2.0 billion | Krispy Kreme full-year 2025 results. |
| FMI value as a share of Krispy Kreme systemwide sales | 20.9% | USD 409.4 million divided by USD 2.0 billion. |
| Change in Krispy Kreme points of access, 2025 | -13.5% | 15,194 against 17,557. |
| Krispy Kreme organic revenue change, 2025 | -1.3% | Krispy Kreme full-year 2025 results. |
| US egg price change, 2025 | +21.9% | USDA ERS. |
| US egg price forecast, 2026 | -29.4% | USDA ERS, September 2026. |
| US food price inflation, 2026 forecast | 2.9% | USDA ERS, all food. |
| FMI value CAGR, 2026 to 2036 | 8.9% | FMI market forecast. |
| Powder / dry revenue, 2026 | USD 214.0 million | 48.0% of the market. |
| Direct industrial bakery revenue, 2026 | USD 245.2 million | 55.0% of the market. |
| Added market revenue, 2026 to 2036 | USD 599.9 million | FMI forecast. |
| Market expansion multiple | 2.3 times | Projected 2036 market value relative to 2026. |
Analyst Perspective
"Donut chains are closing weaker outlets and pushing more volume through fewer sites, so filling suppliers will win on injection performance and cost per donut rather than on the number of flavours they offer."
- Nandini Roy Choudhury, Principal Analyst at Future Market Insights
How is the donut fillings market segmented?
The donut fillings market is segmented by product type, form, application, claim and sales channel. Product Type comprises Glazed rings, Filled donuts, Cake donuts and Premium & specialty. Form comprises Powder / dry, Liquid, Paste / semi-solid and Granules / pieces. Application comprises Bread & rolls, Cakes & muffins, Biscuits & cookies, Viennoiserie & pastry and Other bakery & snacks. Claim comprises Conventional, Clean label, Organic and Non-GMO / identity preserved. Sales Channel comprises Direct to industrial bakeries, Ingredient distributors, Foodservice & artisan supply and Online B2B.
Why do Glazed rings lead the Product Type category?
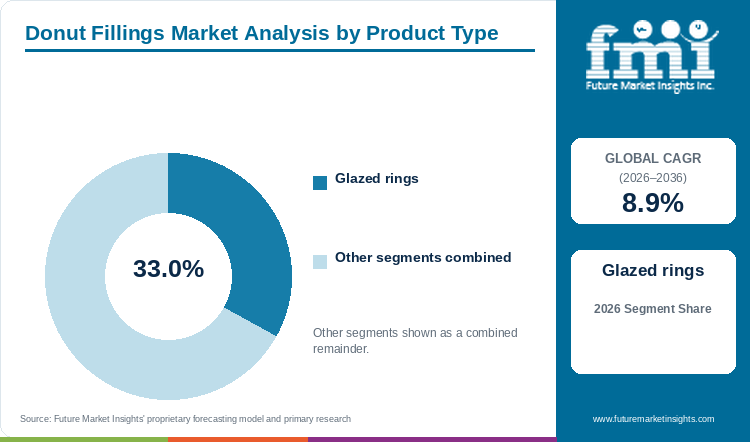
Glazed rings hold 33.0% of Product Type in 2026.
Glazed rings are a staple of donut ranges, and the segment generated approximately USD 147.1 million of filling revenue in 2026 through glazes, toppings and companion filled items made from the same dough. Acceptance depends on injection performance and the condition of the centre after packaging. Pressure during deposition can damage the dough, while excessive movement of the filling can affect presentation. Fruit particles add another specification, as their size must remain compatible with the nozzle. Once a preparation meets these requirements, changes to decoration or seasonal presentation can leave its formulation unchanged.
- Glazed rings hold 33.0% of Product Type in 2026.
- Filled companion items can share an established dough recipe while their centres vary.
What keeps Powder / dry ahead within Form?
Powder / dry represents 48.0% of Form in 2026.
Central plants with batch mixing capacity favour dry bases, which helps explain why the Powder / dry format generated approximately USD 214.0 million in 2026. These bases require water addition and controlled mixing before use, so the consistency of the prepared cream depends partly on the bakery's temperature and routine. Ready-to-use pastes shift that preparation to the supplier, changing the balance between ingredient cost and labour. The amount of unused cream also affects the comparison, as a batch must remain workable until injection is complete.
- Powder / dry represents 48.0% of Form in 2026.
- Hydration, mixing time and unused cream should be included when comparing dry and prepared formats.
How do Bread & rolls anchor the Application axis?
Bread & rolls hold 40.0% of Application in 2026.
Filling purchases extend well beyond donuts into sweet breads and rolls, which accounted for approximately USD 178.3 million in 2026. Oven exposure and post-fry injection place different demands on a preparation. A centre incorporated before baking encounters heat and dough expansion, whereas an injected donut cream enters after frying and cooling. Moisture movement affects both crumb and centre during storage. A grade used across compatible recipes can reduce the number of separate ingredients held in stock, provided its performance has been established in each product.
- Bread & rolls hold 40.0% of Application in 2026.
- A filling approved for post-fry injection still needs a separate trial before oven use.
Why is Conventional the leading Claim classification?
Conventional accounts for 47.0% of Claim in 2026.
Manufacturers of conventional recipes have considerable freedom to adjust sweetness and viscosity while keeping the filling economical, and Conventional products held 47.0% of the Claim segment in 2026. That freedom matters when a cream must inject smoothly and remain stable during storage. A clean label or certified version has to meet the same requirements with a narrower choice of ingredients. Milk, egg and nut ingredients need particular attention when fillings are changed, and the FDA's January 2025 guidance addresses the declaration of major food allergens in covered foods.
- Conventional accounts for 47.0% of Claim in 2026.
- Changing the centre can change the ingredient information needed for the finished donut.
Why does Direct to industrial bakeries dominate Sales Channel?
Direct to industrial bakeries holds 55.0% of Sales Channel in 2026.
Industrial bakeries need fillings matched to the pumps and injectors already on their lines, and direct supply generated approximately USD 245.2 million in 2026. Buying directly gives the production team access to the manufacturer while viscosity, pack format and deposit weight are agreed. A trial at normal speed can reveal problems that are easy to miss in a bench demonstration, and it should also cover packaging, where leakage may first become visible. Smaller accounts may prefer distributors for mixed ingredient orders.
- Direct to industrial bakeries holds 55.0% of Sales Channel in 2026.
- Pack recovery and flavour-change time affect the cost of running a filling.
What are the drivers, restraints and opportunities in the donut fillings market?
Range extensions create repeat filling orders, while volatile ingredient costs and injection requirements restrain switching, making prepared centres useful for a wider bakery programme.
Range extensions create repeat filling orders
Fruit and cream centres extend the range of donuts that can be produced from an established dough and frying process. Dawn's professional offering includes both categories, which supports range changes without a new base formulation. Once a recipe becomes a regular item, variations in viscosity or flavour affect a recurring production requirement rather than an isolated launch. Krispy Kreme's focus on fewer, higher-volume outlets in 2025 makes compatibility with existing bakery production equipment more important, as a filling that slows injection limits the benefit of the additional product.
Volatile ingredient costs and injection requirements restrain switching
Ingredient costs have been volatile. US egg prices rose by 21.9% in 2025 before a forecast decline of 29.4% in 2026, while sugar and sweets prices are forecast to rise by 6.6%. These swings complicate price agreements for custard, cream and fruit fillings. Technical requirements also restrict switching. A cream that resists nozzle flow can produce uneven deposits, while a softer preparation may leak during handling. Fruit inclusions must remain compatible with the nozzle. Ingredient changes add another requirement where they alter the finished product's allergen declaration under FDA guidance. The resulting qualification work can delay a switch to a new centre.
Prepared centres can simplify a wider bakery programme
Dry filling bases and prepared creams divide preparation work differently between the supplier and the bakery. Central mixing capacity supports the use of dry systems, whereas prepared creams remove hydration and mixing from the receiving site. CSM Ingredients' Creami range, launched in May 2026, adds professional textures and flavours to this choice, and Puratos' expanded Buckingham site increases local filling capacity in the UK. Development alongside compatible bakery mixes and concentrates can establish the relationship between dough and centre before a product enters regular production.
Which country CAGRs are profiled in the donut fillings market?
Table 4: Country growth outlook for the donut fillings market
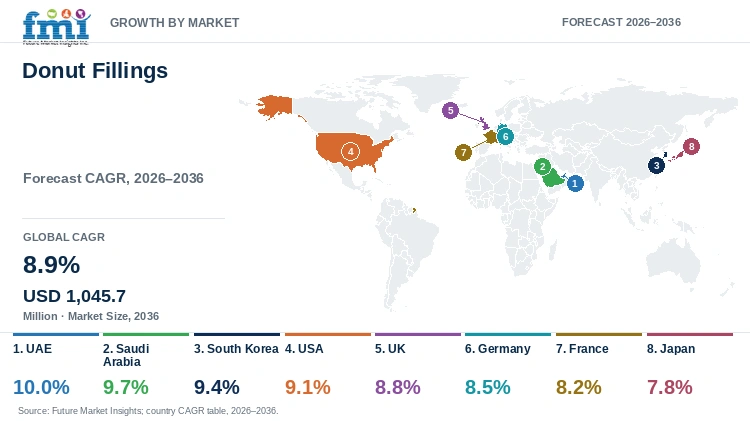
| Country | CAGR |
|---|---|
| UAE | 10.0% |
| Saudi Arabia | 9.7% |
| South Korea | 9.4% |
| USA | 9.1% |
| UK | 8.8% |
| Germany | 8.5% |
| France | 8.2% |
| Japan | 7.8% |
UAE
- The UAE is the fastest-growing market among the profiled countries, with a forecast CAGR of 10.0% from 2026 to 2036. Central production and outlet finishing create different pack and handling requirements in the country. Bulk supply must pump consistently through a central filling line, while smaller packs limit the material left open between short runs. At either scale, filling weight and texture through display determine whether a fruit or cream preparation suits the intended donut, and a stable core range reduces the number of preparation methods needed.
Saudi Arabia
- Saudi donut ranges can be extended around an established base recipe through fruit and cream centres. Saudi Arabia's market is forecast to grow at a CAGR of 9.7% from 2026 to 2036. Filling quantity and texture at the point of sale determine the specification, while compatibility with existing injectors affects suitability for regular output. Smaller distributor orders can support qualification before a grade enters a continuing schedule, and once the recipe is supplied across outlets, consistent composition becomes more important than the initial breadth of flavours.
South Korea
- With a forecast CAGR of 9.4% from 2026 to 2036, South Korea ranks third among the profiled countries. Filling selection in the country depends on the relationship between injection weight, dough texture and packaged presentation. A centre must deliver its intended flavour without excessive movement or leakage after filling. Comparing cream and fruit preparations in the same dough isolates these differences, and continuity of the selected grade then preserves texture and dosage through successive deliveries.
USA
- The United States is home to the largest donut chains. Krispy Kreme reported 2025 systemwide sales of USD 2.0 billion, while reducing its points of access by 13.5%. The USA market is forecast to grow at a CAGR of 9.1% from 2026 to 2036. Ingredient costs are shifting, with egg prices forecast to fall by 29.4% in 2026 after a 21.9% increase in 2025. Dawn's US donut range includes fruit fillings and cream centres. Composition also influences the finished-product declaration when a new centre introduces milk, nut or other allergens, as addressed by FDA guidance.
UK
- UK buyers gained a stronger local production option when Puratos announced in February 2025 that its Buckingham expansion would consolidate filling production and increase capacity. The UK market is forecast to grow at a CAGR of 8.8% from 2026 to 2036. Proximity is useful when a trial needs adjustment or an order changes, but the grade still has to deliver the right result in the donut. A small operator may prioritise convenient packs, while a larger plant needs a dependable injection specification across more products and shifts.
Germany
- Germany's market is projected to grow at a CAGR of 8.5% from 2026 to 2036. Leakage, portion weight and preparation labour determine the true cost of fillings in German bakery production. A loss during handling affects both the centre and the surrounding donut, while low flavour intensity may require a larger deposit. Dry bases also introduce mixing work that prepared creams transfer to the supplier, so assessment across a full batch captures costs that ingredient price alone does not show.
France
- In French donut ranges, fruit and cream fillings shape sweetness, texture and product identity, and the same ingredient is often considered for other pastry applications. France is forecast to grow at a CAGR of 8.2% for 2026 to 2036. Post-fry injection and oven exposure require separate performance assessment, including moisture movement during storage. For smaller accounts, pack quantities and delivery frequency affect the stock committed to a specialty centre.
Japan
- Japan is expected to register the slowest growth among the profiled countries, with a forecast CAGR of 7.8% from 2026 to 2036. Portion design determines the flavour intensity and injection weight required from Japanese donut centres, and the selected preparation must remain balanced with the dough through storage. Qualification therefore extends beyond a freshly filled sample to the condition of the packaged item. Imported grades also need ordering quantities compatible with launch and replenishment schedules.
Who are the notable companies in the donut fillings market?
Dawn Foods; Puratos; Bakels; IRCA Group; CSM Ingredients
Competition in donut fillings centres on how formulation interacts with the customer's equipment. Viscosity, particle size and deposit weight determine injection performance, while pack format affects handling and the quantity recovered during a run. Consolidation is also changing the supplier landscape, as Puratos agreed in March 2026 to acquire Dawn Foods, one of the profiled filling suppliers.
Dawn Foods, Puratos, Bakels, IRCA Group and CSM Ingredients offer combinations of fruit fillings, prepared creams and dry bases. Puratos has expanded its UK filling capacity, and CSM Ingredients launched its Creami range in May 2026. These products can be assessed within wider bakery ingredient purchasing, provided the required performance of the centre remains clear throughout the comparison.
Competitive Benchmarking: Donut Fillings Market
Table 5: Company capabilities in the donut fillings market
| Company | Relevant offering | Purchasing consideration |
|---|---|---|
| Dawn Foods | Fruit and cream fillings for donuts | Match filling to injection and display conditions |
| Puratos | Cremfil creams and Topfil fruit fillings | Select grade for the intended center texture |
| Bakels | Fruit fillings and pipable crèmes | Check pack size and working consistency |
| IRCA Group | SOVRANA custard-cream powder | Control preparation before filling |
| CSM Ingredients | Creami professional filling range | Evaluate the selected texture and application |
Key Developments in the Donut Fillings Market
- In February 2025, Puratos announced its Buckingham expansion, including consolidated filling production, increased filling capacity and added patisserie glaze capability.
- In February 2026, Krispy Kreme reported 2025 net revenue of USD 1,522.6 million and a 13.5% reduction in global points of access to 15,194.
- In May 2026, CSM Ingredients introduced Creami for bakery, pastry and confectionery professionals, adding a range of filling textures and flavours.
- In September 2026, the USDA forecast that US egg prices would fall by 29.4% in 2026, after rising by 21.9% in 2025.
Key Players in the Donut Fillings Market
- Dawn Foods
- Puratos
- Bakels
- IRCA Group
- CSM Ingredients
Donut Fillings Market - Report Scope
Table 6: Report scope for the donut fillings market
| Coverage field | Report scope |
|---|---|
| Market breakdown | Product Type; Form; Application; Claim; Sales Channel |
| Quantitative Units | USD Million |
| Market Definition | Revenue from fruit, custard, chocolate, nut and related filling ingredients sold into the listed bakery-program universe, including relevant pre- and post-bake uses. Excludes finished donut and other baked-product revenue, stand-alone glazes, dough mixes, non-filling decorations, unrelated dessert sauces and duplicate downstream resale value. |
| Regions Covered | North America; Latin America; Western Europe; Eastern Europe; East Asia; South Asia and Pacific; Middle East and Africa |
| Countries Covered | UAE; Saudi Arabia; South Korea; USA; UK; Germany; France; Japan |
| Key Companies Profiled | Dawn Foods; Puratos; Bakels; IRCA Group; CSM Ingredients |
| Forecast Period | 2026 to 2036 |
| Approach | Market assessment supported by official technical and regulatory publications, company product information and country operating conditions. |
Donut Fillings Market - Research Methodology
Table 7: Research approach for the donut fillings market
| Method | Approach |
|---|---|
| Market definition | The assessment separates qualifying ingredient revenue from finished bakery products and unrelated formulation inputs. |
| Secondary evidence | Government publications, regulatory material, technical literature and first-party product documentation establish the operating context. |
| Commercial assessment | Product performance, supply continuity and customer qualification requirements are considered within each segment and country profile. |
| Comparability | Market values, segment shares and country forecasts use the stated revenue boundary, units and forecast period. |
Donut Fillings Market by Segments
Product Type
- Glazed rings
- Filled donuts
- Cake donuts
- Premium & specialty
Form
- Powder / dry
- Liquid
- Paste / semi-solid
- Granules / pieces
Application
- Bread & rolls
- Cakes & muffins
- Biscuits & cookies
- Viennoiserie & pastry
- Other bakery & snacks
Claim
- Conventional
- Clean label
- Organic
- Non-GMO / identity preserved
Sales Channel
- Direct to industrial bakeries
- Ingredient distributors
- Foodservice & artisan supply
- Online B2B
Donut Fillings Market by Region
- North America
- United States
- Canada
- Latin America
- Brazil
- Mexico
- Argentina
- Chile
- Western Europe
- Germany
- France
- United Kingdom
- Italy
- Spain
- Benelux
- Nordics
- Eastern Europe
- Poland
- Czech Republic
- Romania
- Hungary
- East Asia
- China
- Japan
- South Korea
- South Asia and Pacific
- India
- ASEAN
- Australia and New Zealand
- Middle East and Africa
- GCC Countries
- South Africa
- Türkiye
- Israel
Research Sources and Bibliography
- [1] U.S. Food and Drug Administration. (2025, January 6). Frequently Asked Questions: Food Allergen Labeling Guidance for Industry.
- [2] Puratos UK. (2025, February 24). Puratos UK to expand Buckingham site to produce fillings, patisserie glazes and sourdough locally.
- [3] CSM Ingredients. (2026, May 12). CSM Ingredients launches Creami®, a comprehensive range of indulgent fillings.
- [4] Dawn Foods. (n.d.). Donuts: Wholesale donut fillings.
- [5] Krispy Kreme, Inc. (2026, February 26). Krispy Kreme reports fourth quarter and full year 2025 financial results demonstrating meaningful progress on turnaround.
- [6] USDA Economic Research Service. (2026, September 25). Food price outlook: Summary findings.
- [7] Food Ingredients First. (2026, March 12). Puratos strikes deal to acquire Dawn Foods in bakery industry shakeup.
Future Market Insights. (2026). Donut Fillings Market: Global Industry Analysis and Opportunity Assessment 2036.
This Report Answers
- How large is the donut fillings market in 2026 and what value is projected for 2036?
- Which bakery-industry pressures support demand for filling ingredients?
- Why do Glazed rings lead the Product Type program classification?
- What operational advantages keep Powder / dry first by Form?
- How do the eight profiled country CAGRs compare?
- Which profiled companies supply fruit, cream, chocolate and nut filling solutions?
Table of Content
- Key Takeaways
- Market Size and CAGR
- Top Growth Driver
- Fastest Growing Segment
- Leading Region
- Key Companies
- Emerging Opportunities
- Executive Summary
- Global Market Outlook
- Demand-side Trends
- Supply-side Trends
- Technology Roadmap Analysis
- Analysis and Recommendations
- Analyst Perspective (What is happening? Why now? What should investors know?)
- Key Questions Answered
- How large is the market?
- What is the CAGR?
- What are key trends?
- Which region dominates?
- Who are the leaders?
Read More...
- Market Overview
- Market Coverage / Taxonomy
- Market Definition / Scope / Limitations
- Research Methodology
- Chapter Orientation
- Analytical Lens and Working Hypotheses
- Market Structure, Signals, and Trend Drivers
- Benchmarking and Cross-market Comparability
- Market Sizing, Forecasting, and Opportunity Mapping
- Research Design and Evidence Framework
- Desk Research Programme (Secondary Evidence)
- Expert Input and Fieldwork (Primary Evidence)
- Tooling, Models, and Reference Databases
- Data Engineering and Model Build
- Quality Assurance and Audit Trail
- Market Background
- Market Dynamics (Drivers, Restraints, Opportunity, Trends)
- Scenario Forecast (Optimistic, Likely, Conservative)
- Impact Analysis
- AI Impact
- Sustainability Impact
- Regulatory Impact
- Technology Impact
- Consumer / Buyer Analysis
- Purchase Drivers
- Adoption Barriers
- Buyer Journey
- Opportunity Map Analysis
- Product Life Cycle Analysis
- Supply Chain Analysis
- Investment Feasibility Matrix
- Value Chain Analysis
- PESTLE and Porter's Analysis
- Regulatory Landscape
- Regional Parent Market Outlook
- Production and Consumption Statistics
- Import and Export Statistics
- Global Market Analysis and Forecast, 2021 to 2036
- Historical Market Size Value (USD Million) Analysis, 2021 to 2025
- Current and Future Market Size Value (USD Million) Projections, 2026 to 2036
- Y-o-Y Growth Trend Analysis
- Absolute $ Opportunity Analysis
- Global Market Pricing Analysis, 2021 to 2036
- Global Market Analysis and Forecast, By Product Type, 2021 to 2036
- Introduction / Key Findings
- Historical Market Size Value (USD Million) Analysis By Product Type, 2021 to 2025
- Current and Future Market Size Value (USD Million) Analysis and Forecast By Product Type, 2026 to 2036
- Glazed rings
- Filled donuts
- Cake donuts
- Premium & specialty
- Y-o-Y Growth Trend Analysis By Product Type, 2021 to 2025
- Absolute $ Opportunity Analysis By Product Type, 2026 to 2036
- Global Market Analysis and Forecast, By Form, 2021 to 2036
- Introduction / Key Findings
- Historical Market Size Value (USD Million) Analysis By Form, 2021 to 2025
- Current and Future Market Size Value (USD Million) Analysis and Forecast By Form, 2026 to 2036
- Powder / dry
- Liquid
- Paste / semi-solid
- Granules / pieces
- Y-o-Y Growth Trend Analysis By Form, 2021 to 2025
- Absolute $ Opportunity Analysis By Form, 2026 to 2036
- Global Market Analysis and Forecast, By Application, 2021 to 2036
- Introduction / Key Findings
- Historical Market Size Value (USD Million) Analysis By Application, 2021 to 2025
- Current and Future Market Size Value (USD Million) Analysis and Forecast By Application, 2026 to 2036
- Bread & rolls
- Cakes & muffins
- Biscuits & cookies
- Viennoiserie & pastry
- Other bakery & snacks
- Y-o-Y Growth Trend Analysis By Application, 2021 to 2025
- Absolute $ Opportunity Analysis By Application, 2026 to 2036
- Global Market Analysis and Forecast, By Claim, 2021 to 2036
- Introduction / Key Findings
- Historical Market Size Value (USD Million) Analysis By Claim, 2021 to 2025
- Current and Future Market Size Value (USD Million) Analysis and Forecast By Claim, 2026 to 2036
- Conventional
- Clean label
- Organic
- Non-GMO / identity preserved
- Y-o-Y Growth Trend Analysis By Claim, 2021 to 2025
- Absolute $ Opportunity Analysis By Claim, 2026 to 2036
- Global Market Analysis and Forecast, By Sales Channel, 2021 to 2036
- Introduction / Key Findings
- Historical Market Size Value (USD Million) Analysis By Sales Channel, 2021 to 2025
- Current and Future Market Size Value (USD Million) Analysis and Forecast By Sales Channel, 2026 to 2036
- Direct to industrial bakeries
- Ingredient distributors
- Foodservice & artisan supply
- Online B2B
- Y-o-Y Growth Trend Analysis By Sales Channel, 2021 to 2025
- Absolute $ Opportunity Analysis By Sales Channel, 2026 to 2036
- Global Market Analysis and Forecast, By Region, 2021 to 2036
- Introduction
- Historical Market Size Value (USD Million) Analysis By Region, 2021 to 2025
- Current Market Size Value (USD Million) Analysis and Forecast By Region, 2026 to 2036
- North America
- Latin America
- Western Europe
- Eastern Europe
- East Asia
- South Asia and Pacific
- Middle East and Africa
- Market Attractiveness Analysis By Region
- North America Market Analysis and Forecast, By Country, 2021 to 2036
- Historical Market Size Value (USD Million) Trend Analysis By Market Taxonomy, 2021 to 2025
- Market Size Value (USD Million) Forecast By Market Taxonomy, 2026 to 2036
- By Country
- United States
- Canada
- By Product Type
- By Form
- By Application
- By Claim
- By Sales Channel
- By Country
- Market Attractiveness Analysis
- By Country
- By Product Type
- By Form
- By Application
- By Claim
- By Sales Channel
- Key Takeaways
- Latin America Market Analysis and Forecast, By Country
- Historical Market Size Value (USD Million) Trend Analysis By Market Taxonomy, 2021 to 2025
- Market Size Value (USD Million) Forecast By Market Taxonomy, 2026 to 2036
- By Country
- Brazil
- Mexico
- Argentina
- Chile
- By Product Type
- By Form
- By Application
- By Claim
- By Sales Channel
- By Country
- Market Attractiveness Analysis
- By Country
- By Product Type
- By Form
- By Application
- By Claim
- By Sales Channel
- Key Takeaways
- Western Europe Market Analysis and Forecast, By Country
- Historical Market Size Value (USD Million) Trend Analysis By Market Taxonomy, 2021 to 2025
- Market Size Value (USD Million) Forecast By Market Taxonomy, 2026 to 2036
- By Country
- Germany
- France
- United Kingdom
- Italy
- Spain
- Benelux
- Nordics
- By Product Type
- By Form
- By Application
- By Claim
- By Sales Channel
- By Country
- Market Attractiveness Analysis
- By Country
- By Product Type
- By Form
- By Application
- By Claim
- By Sales Channel
- Key Takeaways
- Eastern Europe Market Analysis and Forecast, By Country
- Historical Market Size Value (USD Million) Trend Analysis By Market Taxonomy, 2021 to 2025
- Market Size Value (USD Million) Forecast By Market Taxonomy, 2026 to 2036
- By Country
- Poland
- Czech Republic
- Romania
- Hungary
- By Product Type
- By Form
- By Application
- By Claim
- By Sales Channel
- By Country
- Market Attractiveness Analysis
- By Country
- By Product Type
- By Form
- By Application
- By Claim
- By Sales Channel
- Key Takeaways
- East Asia Market Analysis and Forecast, By Country
- Historical Market Size Value (USD Million) Trend Analysis By Market Taxonomy, 2021 to 2025
- Market Size Value (USD Million) Forecast By Market Taxonomy, 2026 to 2036
- By Country
- China
- Japan
- South Korea
- By Product Type
- By Form
- By Application
- By Claim
- By Sales Channel
- By Country
- Market Attractiveness Analysis
- By Country
- By Product Type
- By Form
- By Application
- By Claim
- By Sales Channel
- Key Takeaways
- South Asia and Pacific Market Analysis and Forecast, By Country
- Historical Market Size Value (USD Million) Trend Analysis By Market Taxonomy, 2021 to 2025
- Market Size Value (USD Million) Forecast By Market Taxonomy, 2026 to 2036
- By Country
- India
- ASEAN
- Australia and New Zealand
- By Product Type
- By Form
- By Application
- By Claim
- By Sales Channel
- By Country
- Market Attractiveness Analysis
- By Country
- By Product Type
- By Form
- By Application
- By Claim
- By Sales Channel
- Key Takeaways
- Middle East and Africa Market Analysis and Forecast, By Country
- Historical Market Size Value (USD Million) Trend Analysis By Market Taxonomy, 2021 to 2025
- Market Size Value (USD Million) Forecast By Market Taxonomy, 2026 to 2036
- By Country
- GCC Countries
- South Africa
- Türkiye
- Israel
- By Product Type
- By Form
- By Application
- By Claim
- By Sales Channel
- By Country
- Market Attractiveness Analysis
- By Country
- By Product Type
- By Form
- By Application
- By Claim
- By Sales Channel
- Key Takeaways
- Key Countries Market Analysis
- United States
- Pricing Analysis
- Market Share Analysis, 2025
- By Product Type
- By Form
- By Application
- By Claim
- By Sales Channel
- Canada
- Pricing Analysis
- Market Share Analysis, 2025
- By Product Type
- By Form
- By Application
- By Claim
- By Sales Channel
- Mexico
- Pricing Analysis
- Market Share Analysis, 2025
- By Product Type
- By Form
- By Application
- By Claim
- By Sales Channel
- Brazil
- Pricing Analysis
- Market Share Analysis, 2025
- By Product Type
- By Form
- By Application
- By Claim
- By Sales Channel
- Chile
- Pricing Analysis
- Market Share Analysis, 2025
- By Product Type
- By Form
- By Application
- By Claim
- By Sales Channel
- Germany
- Pricing Analysis
- Market Share Analysis, 2025
- By Product Type
- By Form
- By Application
- By Claim
- By Sales Channel
- United Kingdom
- Pricing Analysis
- Market Share Analysis, 2025
- By Product Type
- By Form
- By Application
- By Claim
- By Sales Channel
- Italy
- Pricing Analysis
- Market Share Analysis, 2025
- By Product Type
- By Form
- By Application
- By Claim
- By Sales Channel
- Spain
- Pricing Analysis
- Market Share Analysis, 2025
- By Product Type
- By Form
- By Application
- By Claim
- By Sales Channel
- France
- Pricing Analysis
- Market Share Analysis, 2025
- By Product Type
- By Form
- By Application
- By Claim
- By Sales Channel
- India
- Pricing Analysis
- Market Share Analysis, 2025
- By Product Type
- By Form
- By Application
- By Claim
- By Sales Channel
- ASEAN
- Pricing Analysis
- Market Share Analysis, 2025
- By Product Type
- By Form
- By Application
- By Claim
- By Sales Channel
- Australia and New Zealand
- Pricing Analysis
- Market Share Analysis, 2025
- By Product Type
- By Form
- By Application
- By Claim
- By Sales Channel
- China
- Pricing Analysis
- Market Share Analysis, 2025
- By Product Type
- By Form
- By Application
- By Claim
- By Sales Channel
- Japan
- Pricing Analysis
- Market Share Analysis, 2025
- By Product Type
- By Form
- By Application
- By Claim
- By Sales Channel
- South Korea
- Pricing Analysis
- Market Share Analysis, 2025
- By Product Type
- By Form
- By Application
- By Claim
- By Sales Channel
- Poland
- Pricing Analysis
- Market Share Analysis, 2025
- By Product Type
- By Form
- By Application
- By Claim
- By Sales Channel
- Hungary
- Pricing Analysis
- Market Share Analysis, 2025
- By Product Type
- By Form
- By Application
- By Claim
- By Sales Channel
- Türkiye
- Pricing Analysis
- Market Share Analysis, 2025
- By Product Type
- By Form
- By Application
- By Claim
- By Sales Channel
- South Africa
- Pricing Analysis
- Market Share Analysis, 2025
- By Product Type
- By Form
- By Application
- By Claim
- By Sales Channel
- UAE
- Pricing Analysis
- Market Share Analysis, 2025
- By Product Type
- By Form
- By Application
- By Claim
- By Sales Channel
- Saudi Arabia
- Pricing Analysis
- Market Share Analysis, 2025
- By Product Type
- By Form
- By Application
- By Claim
- By Sales Channel
- United States
- Market Structure Analysis
- Competition Dashboard
- Competition Benchmarking
- Market Share Analysis of Top Players
- By Regional
- By Product Type
- By Form
- By Application
- By Claim
- By Sales Channel
- Emerging Startups
- Innovation Benchmarking
- Competition Analysis
- Competition Deep Dive
- Dawn Foods
- Overview
- Product Portfolio
- Profitability by Market Segments
- Sales Footprint
- Strategy Overview
- Marketing Strategy
- Product Strategy
- Channel Strategy
- Puratos
- Bakels
- IRCA Group
- CSM Ingredients
- Dawn Foods
- Case Studies
- Success Stories
- Recent Developments
- Competition Deep Dive
- Assumptions & Acronyms Used
List of Tables
- Table 1: Global Market Value (USD Million) Forecast by Region, 2021 to 2036
- Table 2: Global Market Value (USD Million) Forecast by Product Type, 2021 to 2036
- Table 3: Global Market Value (USD Million) Forecast by Form, 2021 to 2036
- Table 4: Global Market Value (USD Million) Forecast by Application, 2021 to 2036
- Table 5: Global Market Value (USD Million) Forecast by Claim, 2021 to 2036
- Table 6: Global Market Value (USD Million) Forecast by Sales Channel, 2021 to 2036
- Table 7: North America Market Value (USD Million) Forecast by Country, 2021 to 2036
- Table 8: North America Market Value (USD Million) Forecast by Product Type, 2021 to 2036
- Table 9: North America Market Value (USD Million) Forecast by Form, 2021 to 2036
- Table 10: North America Market Value (USD Million) Forecast by Application, 2021 to 2036
- Table 11: North America Market Value (USD Million) Forecast by Claim, 2021 to 2036
- Table 12: North America Market Value (USD Million) Forecast by Sales Channel, 2021 to 2036
- Table 13: Latin America Market Value (USD Million) Forecast by Country, 2021 to 2036
- Table 14: Latin America Market Value (USD Million) Forecast by Product Type, 2021 to 2036
- Table 15: Latin America Market Value (USD Million) Forecast by Form, 2021 to 2036
- Table 16: Latin America Market Value (USD Million) Forecast by Application, 2021 to 2036
- Table 17: Latin America Market Value (USD Million) Forecast by Claim, 2021 to 2036
- Table 18: Latin America Market Value (USD Million) Forecast by Sales Channel, 2021 to 2036
- Table 19: Western Europe Market Value (USD Million) Forecast by Country, 2021 to 2036
- Table 20: Western Europe Market Value (USD Million) Forecast by Product Type, 2021 to 2036
- Table 21: Western Europe Market Value (USD Million) Forecast by Form, 2021 to 2036
- Table 22: Western Europe Market Value (USD Million) Forecast by Application, 2021 to 2036
- Table 23: Western Europe Market Value (USD Million) Forecast by Claim, 2021 to 2036
- Table 24: Western Europe Market Value (USD Million) Forecast by Sales Channel, 2021 to 2036
- Table 25: Eastern Europe Market Value (USD Million) Forecast by Country, 2021 to 2036
- Table 26: Eastern Europe Market Value (USD Million) Forecast by Product Type, 2021 to 2036
- Table 27: Eastern Europe Market Value (USD Million) Forecast by Form, 2021 to 2036
- Table 28: Eastern Europe Market Value (USD Million) Forecast by Application, 2021 to 2036
- Table 29: Eastern Europe Market Value (USD Million) Forecast by Claim, 2021 to 2036
- Table 30: Eastern Europe Market Value (USD Million) Forecast by Sales Channel, 2021 to 2036
- Table 31: East Asia Market Value (USD Million) Forecast by Country, 2021 to 2036
- Table 32: East Asia Market Value (USD Million) Forecast by Product Type, 2021 to 2036
- Table 33: East Asia Market Value (USD Million) Forecast by Form, 2021 to 2036
- Table 34: East Asia Market Value (USD Million) Forecast by Application, 2021 to 2036
- Table 35: East Asia Market Value (USD Million) Forecast by Claim, 2021 to 2036
- Table 36: East Asia Market Value (USD Million) Forecast by Sales Channel, 2021 to 2036
- Table 37: South Asia and Pacific Market Value (USD Million) Forecast by Country, 2021 to 2036
- Table 38: South Asia and Pacific Market Value (USD Million) Forecast by Product Type, 2021 to 2036
- Table 39: South Asia and Pacific Market Value (USD Million) Forecast by Form, 2021 to 2036
- Table 40: South Asia and Pacific Market Value (USD Million) Forecast by Application, 2021 to 2036
- Table 41: South Asia and Pacific Market Value (USD Million) Forecast by Claim, 2021 to 2036
- Table 42: South Asia and Pacific Market Value (USD Million) Forecast by Sales Channel, 2021 to 2036
- Table 43: Middle East and Africa Market Value (USD Million) Forecast by Country, 2021 to 2036
- Table 44: Middle East and Africa Market Value (USD Million) Forecast by Product Type, 2021 to 2036
- Table 45: Middle East and Africa Market Value (USD Million) Forecast by Form, 2021 to 2036
- Table 46: Middle East and Africa Market Value (USD Million) Forecast by Application, 2021 to 2036
- Table 47: Middle East and Africa Market Value (USD Million) Forecast by Claim, 2021 to 2036
- Table 48: Middle East and Africa Market Value (USD Million) Forecast by Sales Channel, 2021 to 2036
List of Figures
- Figure 1: Global Market Pricing Analysis
- Figure 2: Global Market Value (USD Million) Forecast 2021-2036
- Figure 3: Global Market Value Share and BPS Analysis by Product Type, 2026 and 2036
- Figure 4: Global Market Y-o-Y Growth Comparison by Product Type, 2026-2036
- Figure 5: Global Market Attractiveness Analysis by Product Type
- Figure 6: Global Market Value Share and BPS Analysis by Form, 2026 and 2036
- Figure 7: Global Market Y-o-Y Growth Comparison by Form, 2026-2036
- Figure 8: Global Market Attractiveness Analysis by Form
- Figure 9: Global Market Value Share and BPS Analysis by Application, 2026 and 2036
- Figure 10: Global Market Y-o-Y Growth Comparison by Application, 2026-2036
- Figure 11: Global Market Attractiveness Analysis by Application
- Figure 12: Global Market Value Share and BPS Analysis by Claim, 2026 and 2036
- Figure 13: Global Market Y-o-Y Growth Comparison by Claim, 2026-2036
- Figure 14: Global Market Attractiveness Analysis by Claim
- Figure 15: Global Market Value Share and BPS Analysis by Sales Channel, 2026 and 2036
- Figure 16: Global Market Y-o-Y Growth Comparison by Sales Channel, 2026-2036
- Figure 17: Global Market Attractiveness Analysis by Sales Channel
- Figure 18: Global Market Value (USD Million) Share and BPS Analysis by Region, 2026 and 2036
- Figure 19: Global Market Y-o-Y Growth Comparison by Region, 2026-2036
- Figure 20: Global Market Attractiveness Analysis by Region
- Figure 21: North America Market Incremental Dollar Opportunity, 2026-2036
- Figure 22: Latin America Market Incremental Dollar Opportunity, 2026-2036
- Figure 23: Western Europe Market Incremental Dollar Opportunity, 2026-2036
- Figure 24: Eastern Europe Market Incremental Dollar Opportunity, 2026-2036
- Figure 25: East Asia Market Incremental Dollar Opportunity, 2026-2036
- Figure 26: South Asia and Pacific Market Incremental Dollar Opportunity, 2026-2036
- Figure 27: Middle East and Africa Market Incremental Dollar Opportunity, 2026-2036
- Figure 28: North America Market Value Share and BPS Analysis by Country, 2026 and 2036
- Figure 29: North America Market Value Share and BPS Analysis by Product Type, 2026 and 2036
- Figure 30: North America Market Y-o-Y Growth Comparison by Product Type, 2026-2036
- Figure 31: North America Market Attractiveness Analysis by Product Type
- Figure 32: North America Market Value Share and BPS Analysis by Form, 2026 and 2036
- Figure 33: North America Market Y-o-Y Growth Comparison by Form, 2026-2036
- Figure 34: North America Market Attractiveness Analysis by Form
- Figure 35: North America Market Value Share and BPS Analysis by Application, 2026 and 2036
- Figure 36: North America Market Y-o-Y Growth Comparison by Application, 2026-2036
- Figure 37: North America Market Attractiveness Analysis by Application
- Figure 38: North America Market Value Share and BPS Analysis by Claim, 2026 and 2036
- Figure 39: North America Market Y-o-Y Growth Comparison by Claim, 2026-2036
- Figure 40: North America Market Attractiveness Analysis by Claim
- Figure 41: North America Market Value Share and BPS Analysis by Sales Channel, 2026 and 2036
- Figure 42: North America Market Y-o-Y Growth Comparison by Sales Channel, 2026-2036
- Figure 43: North America Market Attractiveness Analysis by Sales Channel
- Figure 44: Latin America Market Value Share and BPS Analysis by Country, 2026 and 2036
- Figure 45: Latin America Market Value Share and BPS Analysis by Product Type, 2026 and 2036
- Figure 46: Latin America Market Y-o-Y Growth Comparison by Product Type, 2026-2036
- Figure 47: Latin America Market Attractiveness Analysis by Product Type
- Figure 48: Latin America Market Value Share and BPS Analysis by Form, 2026 and 2036
- Figure 49: Latin America Market Y-o-Y Growth Comparison by Form, 2026-2036
- Figure 50: Latin America Market Attractiveness Analysis by Form
- Figure 51: Latin America Market Value Share and BPS Analysis by Application, 2026 and 2036
- Figure 52: Latin America Market Y-o-Y Growth Comparison by Application, 2026-2036
- Figure 53: Latin America Market Attractiveness Analysis by Application
- Figure 54: Latin America Market Value Share and BPS Analysis by Claim, 2026 and 2036
- Figure 55: Latin America Market Y-o-Y Growth Comparison by Claim, 2026-2036
- Figure 56: Latin America Market Attractiveness Analysis by Claim
- Figure 57: Latin America Market Value Share and BPS Analysis by Sales Channel, 2026 and 2036
- Figure 58: Latin America Market Y-o-Y Growth Comparison by Sales Channel, 2026-2036
- Figure 59: Latin America Market Attractiveness Analysis by Sales Channel
- Figure 60: Western Europe Market Value Share and BPS Analysis by Country, 2026 and 2036
- Figure 61: Western Europe Market Value Share and BPS Analysis by Product Type, 2026 and 2036
- Figure 62: Western Europe Market Y-o-Y Growth Comparison by Product Type, 2026-2036
- Figure 63: Western Europe Market Attractiveness Analysis by Product Type
- Figure 64: Western Europe Market Value Share and BPS Analysis by Form, 2026 and 2036
- Figure 65: Western Europe Market Y-o-Y Growth Comparison by Form, 2026-2036
- Figure 66: Western Europe Market Attractiveness Analysis by Form
- Figure 67: Western Europe Market Value Share and BPS Analysis by Application, 2026 and 2036
- Figure 68: Western Europe Market Y-o-Y Growth Comparison by Application, 2026-2036
- Figure 69: Western Europe Market Attractiveness Analysis by Application
- Figure 70: Western Europe Market Value Share and BPS Analysis by Claim, 2026 and 2036
- Figure 71: Western Europe Market Y-o-Y Growth Comparison by Claim, 2026-2036
- Figure 72: Western Europe Market Attractiveness Analysis by Claim
- Figure 73: Western Europe Market Value Share and BPS Analysis by Sales Channel, 2026 and 2036
- Figure 74: Western Europe Market Y-o-Y Growth Comparison by Sales Channel, 2026-2036
- Figure 75: Western Europe Market Attractiveness Analysis by Sales Channel
- Figure 76: Eastern Europe Market Value Share and BPS Analysis by Country, 2026 and 2036
- Figure 77: Eastern Europe Market Value Share and BPS Analysis by Product Type, 2026 and 2036
- Figure 78: Eastern Europe Market Y-o-Y Growth Comparison by Product Type, 2026-2036
- Figure 79: Eastern Europe Market Attractiveness Analysis by Product Type
- Figure 80: Eastern Europe Market Value Share and BPS Analysis by Form, 2026 and 2036
- Figure 81: Eastern Europe Market Y-o-Y Growth Comparison by Form, 2026-2036
- Figure 82: Eastern Europe Market Attractiveness Analysis by Form
- Figure 83: Eastern Europe Market Value Share and BPS Analysis by Application, 2026 and 2036
- Figure 84: Eastern Europe Market Y-o-Y Growth Comparison by Application, 2026-2036
- Figure 85: Eastern Europe Market Attractiveness Analysis by Application
- Figure 86: Eastern Europe Market Value Share and BPS Analysis by Claim, 2026 and 2036
- Figure 87: Eastern Europe Market Y-o-Y Growth Comparison by Claim, 2026-2036
- Figure 88: Eastern Europe Market Attractiveness Analysis by Claim
- Figure 89: Eastern Europe Market Value Share and BPS Analysis by Sales Channel, 2026 and 2036
- Figure 90: Eastern Europe Market Y-o-Y Growth Comparison by Sales Channel, 2026-2036
- Figure 91: Eastern Europe Market Attractiveness Analysis by Sales Channel
- Figure 92: East Asia Market Value Share and BPS Analysis by Country, 2026 and 2036
- Figure 93: East Asia Market Value Share and BPS Analysis by Product Type, 2026 and 2036
- Figure 94: East Asia Market Y-o-Y Growth Comparison by Product Type, 2026-2036
- Figure 95: East Asia Market Attractiveness Analysis by Product Type
- Figure 96: East Asia Market Value Share and BPS Analysis by Form, 2026 and 2036
- Figure 97: East Asia Market Y-o-Y Growth Comparison by Form, 2026-2036
- Figure 98: East Asia Market Attractiveness Analysis by Form
- Figure 99: East Asia Market Value Share and BPS Analysis by Application, 2026 and 2036
- Figure 100: East Asia Market Y-o-Y Growth Comparison by Application, 2026-2036
- Figure 101: East Asia Market Attractiveness Analysis by Application
- Figure 102: East Asia Market Value Share and BPS Analysis by Claim, 2026 and 2036
- Figure 103: East Asia Market Y-o-Y Growth Comparison by Claim, 2026-2036
- Figure 104: East Asia Market Attractiveness Analysis by Claim
- Figure 105: East Asia Market Value Share and BPS Analysis by Sales Channel, 2026 and 2036
- Figure 106: East Asia Market Y-o-Y Growth Comparison by Sales Channel, 2026-2036
- Figure 107: East Asia Market Attractiveness Analysis by Sales Channel
- Figure 108: South Asia and Pacific Market Value Share and BPS Analysis by Country, 2026 and 2036
- Figure 109: South Asia and Pacific Market Value Share and BPS Analysis by Product Type, 2026 and 2036
- Figure 110: South Asia and Pacific Market Y-o-Y Growth Comparison by Product Type, 2026-2036
- Figure 111: South Asia and Pacific Market Attractiveness Analysis by Product Type
- Figure 112: South Asia and Pacific Market Value Share and BPS Analysis by Form, 2026 and 2036
- Figure 113: South Asia and Pacific Market Y-o-Y Growth Comparison by Form, 2026-2036
- Figure 114: South Asia and Pacific Market Attractiveness Analysis by Form
- Figure 115: South Asia and Pacific Market Value Share and BPS Analysis by Application, 2026 and 2036
- Figure 116: South Asia and Pacific Market Y-o-Y Growth Comparison by Application, 2026-2036
- Figure 117: South Asia and Pacific Market Attractiveness Analysis by Application
- Figure 118: South Asia and Pacific Market Value Share and BPS Analysis by Claim, 2026 and 2036
- Figure 119: South Asia and Pacific Market Y-o-Y Growth Comparison by Claim, 2026-2036
- Figure 120: South Asia and Pacific Market Attractiveness Analysis by Claim
- Figure 121: South Asia and Pacific Market Value Share and BPS Analysis by Sales Channel, 2026 and 2036
- Figure 122: South Asia and Pacific Market Y-o-Y Growth Comparison by Sales Channel, 2026-2036
- Figure 123: South Asia and Pacific Market Attractiveness Analysis by Sales Channel
- Figure 124: Middle East and Africa Market Value Share and BPS Analysis by Country, 2026 and 2036
- Figure 125: Middle East and Africa Market Value Share and BPS Analysis by Product Type, 2026 and 2036
- Figure 126: Middle East and Africa Market Y-o-Y Growth Comparison by Product Type, 2026-2036
- Figure 127: Middle East and Africa Market Attractiveness Analysis by Product Type
- Figure 128: Middle East and Africa Market Value Share and BPS Analysis by Form, 2026 and 2036
- Figure 129: Middle East and Africa Market Y-o-Y Growth Comparison by Form, 2026-2036
- Figure 130: Middle East and Africa Market Attractiveness Analysis by Form
- Figure 131: Middle East and Africa Market Value Share and BPS Analysis by Application, 2026 and 2036
- Figure 132: Middle East and Africa Market Y-o-Y Growth Comparison by Application, 2026-2036
- Figure 133: Middle East and Africa Market Attractiveness Analysis by Application
- Figure 134: Middle East and Africa Market Value Share and BPS Analysis by Claim, 2026 and 2036
- Figure 135: Middle East and Africa Market Y-o-Y Growth Comparison by Claim, 2026-2036
- Figure 136: Middle East and Africa Market Attractiveness Analysis by Claim
- Figure 137: Middle East and Africa Market Value Share and BPS Analysis by Sales Channel, 2026 and 2036
- Figure 138: Middle East and Africa Market Y-o-Y Growth Comparison by Sales Channel, 2026-2036
- Figure 139: Middle East and Africa Market Attractiveness Analysis by Sales Channel
- Figure 140: Global Market - Tier Structure Analysis
- Figure 141: Global Market - Company Share Analysis
Frequently Asked Questions
How big is the donut fillings market in 2026, and what is forecast for 2036?
The market is valued at USD 445.8 million in 2026 and is projected to reach USD 1,045.7 million by 2036. These values cover filling ingredients rather than finished bakery sales.
What is the donut fillings market CAGR from 2026 to 2036?
The market is projected to grow at a CAGR of 8.9% from 2026 to 2036, which is well above forecast general food inflation of 2.9% in the United States.
Which Product Type segment leads the donut fillings market?
Glazed rings lead Product Type with 33.0% in 2026.
Which Form segment leads the donut fillings market?
Powder / dry leads with 48.0% in 2026, although operators must still confirm the viscosity of the mixed product before use on a filling line.
Which profiled countries show the highest CAGR?
The UAE leads at 10.0%, followed by Saudi Arabia at 9.7% and South Korea at 9.4% from 2026 to 2036. These are growth rates rather than rankings by market size.
Which companies are active in the donut fillings market?
The report profiles Dawn Foods, Puratos, Bakels, IRCA Group and CSM Ingredients.
Preview the report firsthand - request a free sample
Get SampleGet the brochure for pricing and purchase details.
Get PDF
