Methodology

Driving Test Simulator Market Forecast and Outlook (2025-2035)

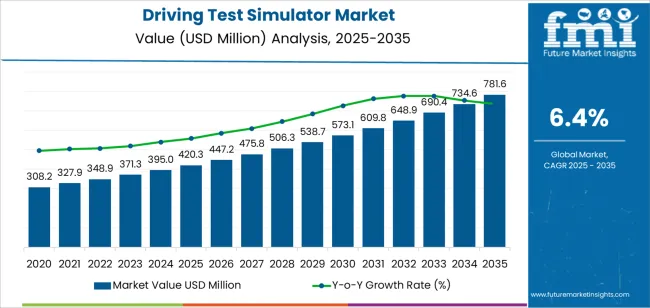
The driving test simulator market is forecast to grow from USD 420.3 million in 2025 to USD 781.6 million by 2035, at a CAGR of 6.4%, driven by rising institutional demand for standardized, safe, and repeatable driver-assessment environments. Regional dynamics shape most of the decade’s expansion, with Asia Pacific establishing a dominant position due to intensive licensing activity, rapid urban traffic growth, and government-backed investments in digital driver-training ecosystems. China leads with an 8.6% CAGR as provincial licensing authorities integrate Subject 2 and Subject 3 simulators into large-scale training networks. Training centers rely on motion-enabled platforms, multi-scenario modules, and EV-driving simulations aligned with the country’s expanding new-energy vehicle footprint. India is growing at an 8.0% CAGR, driven by modernizing state licensing workflows, mandatory simulator-based hazard-perception modules, and rising fleet-training needs across the logistics and ride-hailing sectors.

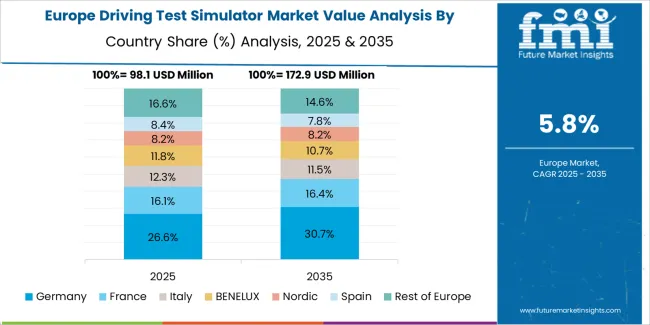
Europe maintains steady growth anchored by Germany at 7.4%, where regulated training structures, ADAS-enabled modules, and integration of high-precision simulators into vocational transport programs strengthen procurement. The UK advances at 5.4%, with simulators used widely for hazard-perception training and standardized driving-school curricula. North America remains a high-value market, led by the United States at 6.1%, where commercial fleets, emergency response units, and research institutions adopt simulation technologies for risk reduction, weather modeling, and distracted-driving assessment. Brazil anchors Latin America with a 6.7% CAGR, supported by expanding logistics networks and the modernization of driving-school infrastructure. Japan grows at 4.8%, emphasizing compact, high-precision simulators tailored to dense urban environments and safety-focused driver education. Across all regions, procurement is driven by structured training mandates, digitalization of licensing systems, and the shift toward motion-integrated, AI-assisted evaluation tools that support consistent driver competency across varied regulatory environments.
Quick Stats for Driving Test Simulator Market

  • Driving Test Simulator Market Value (2025): USD 420.3 million
  • Driving Test Simulator Market Forecast Value (2035): USD 781.6 million
  • Driving Test Simulator Market Forecast CAGR: 6.4%
  • Leading Type in Driving Test Simulator Market: Subject 2 Special Plane
  • Key Growth Regions in Driving Test Simulator Market: Asia Pacific, Europe, North America
  • Top Players in Driving Test Simulator Market: Wuhan LinControl, Anhui Sanlian Applied Traffic Technologies, Yaxin Technology, Xuanbo Software, iFlytek, Chuangfang Technology, Beike Tianhui, Shandong Longchuang Electronic Technology, Bangtai Softcom (Beijing) Technology

Driving Test Simulator Market Market Value Analysis

The Subject 2 special plane category represents the leading product segment due to its alignment with structured driving test modules and its suitability for repetitive maneuver training. These systems provide realistic cockpit layouts, multi-axis motion platforms, and detailed road-scenario simulations that replicate standardized test environments. Continuous improvements in sensor accuracy, visual rendering, and AI-based performance assessment are enhancing training realism and enabling more precise skill evaluation.

Asia Pacific leads market expansion, supported by high licensing volumes and increasing investment in digital training infrastructure across China and India. Europe and North America maintain steady demand through established driver training institutions and modernization of testing frameworks. Key companies include Wuhan LinControl, Anhui Sanlian Applied Traffic Technologies, Yaxin Technology, Xuanbo Software, iFlytek, and Chuangfang Technology, focusing on immersive simulation design, assessment automation, and system reliability.

What is the Growth Forecast for the Driving Test Simulator Market through 2035?

Year-on-year growth analysis indicates a stable upward pattern supported by continued investment in road-safety training, driver-assessment standards, and simulation-based instruction. Between 2025 and 2028, YoY growth is expected to remain between 6.2% and 6.6% as licensing authorities and training institutes adopt simulators to standardize testing and reduce on-road training risks. Expansion of commercial driving schools and fleet-training programs will reinforce early annual gains.

Between 2029 and 2032, YoY growth may show modest variation linked to procurement cycles, infrastructure budgets, and digitization initiatives across transport agencies. Increased use of simulators for commercial-vehicle, emergency-response, and autonomous-driving training will support consistent annual demand during this period. From 2033 to 2035, YoY growth is likely to stabilize near 6.4% as adoption matures in developed regions and replacement demand becomes more prominent. Improved software realism, motion-platform integration, and data-driven evaluation tools will sustain procurement. The YoY pattern reflects predictable expansion anchored in regulatory alignment, safety requirements, and structured driver-training practices.

Driving Test Simulator Market Key Takeaways

Metric Value
Market Value (2025) USD 420.3 million
Market Forecast Value (2035) USD 781.6 million
Forecast CAGR (2025-2035) 6.4%

Why is the Driving Test Simulator Market Growing?

The driving test simulator market is growing because licensing authorities, training centres and educational institutions need safer and more controlled methods to evaluate driving skills. Simulators allow structured training in varied traffic, weather and road conditions without exposing learners to real world risks. Rising vehicle numbers and dense urban traffic make it harder to conduct consistent on road tests, which increases the value of simulation based assessment. Improvements in display technology, motion systems and behavioural analytics enhance the realism and reliability of simulator based training.

Demand also increases as governments adopt digital learning tools and standardised evaluation frameworks for learner drivers. Constraints include higher system cost compared with conventional training, the need for technical maintenance and the challenge of aligning simulator results with real road performance. Some regions may also face limited regulatory acceptance or insufficient infrastructure for large scale deployment.

Which Product Type and Application Segments Lead the Driving Test Simulator Market?

The driving test simulator market is segmented by product type and application. By product type, the market includes Subject 2 special plane, Subject 3 road test machine, and others. Based on application, it is categorized into driving test, corporate training, and others. Regionally, the market is divided into Asia Pacific, Europe, North America, and other key regions.
By Product Type, the Subject 2 Special Plane Segment Accounts for the Largest Market Share

Driving Test Simulator Market Analysis By Product Type

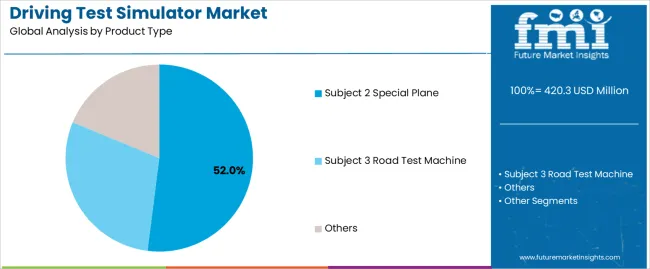
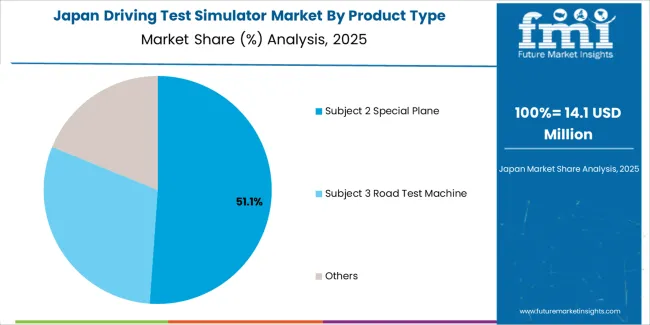
The Subject 2 special plane segment represents the leading category in the driving test simulator market, accounting for an estimated 52.0% of total market share in 2025. Subject 2 simulators replicate closed-course driving tasks, including vehicle control, parking, slope starts, and obstacle navigation. These simulators are widely adopted by driving schools and testing centers due to standardized assessment requirements and the need for controlled, repeatable training environments.

The Subject 3 road test machine segment follows with an estimated 33.0%, supporting simulated on-road driving conditions, real-traffic scenarios, and hazard perception training. The others category, representing roughly 15.0%, includes advanced simulators for high-fidelity training, VR-based platforms, and customized systems for specialized instruction.

Key factors supporting the Subject 2 special plane segment include:
  • High demand for standardized simulators aligned with formal driving test curricula.
  • Increased adoption by driving schools for skill assessment and pre-test preparation.
  • Suitability for repetitive training under controlled conditions.
  • Enhanced safety by reducing on-road training risks for novice drivers.

By Application, the Driving Test Segment Represents the Dominant Market Category

Driving Test Simulator Market Analysis By Application

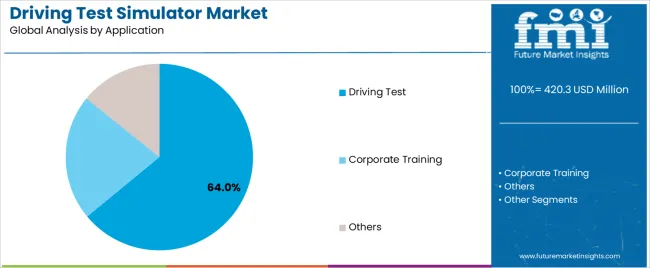
The driving test segment accounts for approximately 64.0% of the market in 2025. Testing centers use simulators to evaluate driver competency before on-road assessment, reducing operational risk and improving testing consistency. These simulators help assess decision-making, vehicle control, and response to predefined scenarios.

The corporate training segment, representing an estimated 27.0%, includes fleet training, logistics driver orientation, and safety compliance programs used by transport, delivery, and industrial firms. The others category, at about 9.0%, covers educational institutions and research applications.

Primary dynamics driving demand from the driving test segment include:

  • Standardization of pre-test evaluation processes using simulator-based assessment.
  • Increased candidate throughput in testing centers through automated evaluation tools.
  • Demand for safer, structured driver training environments.
  • Integration of simulation into regional driving certification frameworks.

What are the Drivers, Restraints, and Key Trends of the Driving Test Simulator Market?

Increasing demand for standardized driver training, growth in road safety initiatives, and adoption of simulation-based learning are driving market growth.

The driving test simulator market is expanding as governments, licensing authorities, and training academies seek reliable tools to evaluate driver competence under controlled conditions. Rising road accident rates encourage institutions to adopt simulators that expose learners to hazardous scenarios without real-world risk. Training centers use simulators to teach defensive driving, traffic-rule compliance, and emergency handling in a cost-efficient setting. Commercial fleet operators rely on simulation-based programs to reduce accident-related expenditure and improve driver readiness. Technological improvements in motion platforms, high-resolution displays, and vehicle dynamics modeling enhance training realism and strengthen adoption across driving schools and vocational institutes.

High equipment cost, limited infrastructure in developing regions, and variability in simulation fidelity are restraining adoption.

Driving test simulators require large capital investment for hardware, software licensing, and periodic system upgrades, which limits use in small institutions with minimal training budgets. Developing regions may lack the infrastructure needed to support advanced simulator systems, including dedicated training rooms, reliable power supplies, and maintenance personnel. Differences in simulation fidelity, such as vehicle handling accuracy or road-condition realism, can affect training outcomes and reduce user confidence. Some regulators remain cautious about substituting on-road evaluations with fully simulated assessments, which slows integration into formal licensing frameworks.

Growth in cloud-connected training platforms, increased use of AI-driven performance analytics, and rising adoption in commercial fleet training programs are shaping industry trends.

Manufacturers are offering simulators equipped with cloud-based performance tracking, remote instructor dashboards, and automated testing modules to support standardized training. AI-driven analytics help assess reaction times, rule violations, hazard perception, and decision-making patterns, enabling data-supported driver evaluation. Commercial fleets in logistics, public transport, and emergency services are investing in simulator-based training to improve safety records and meet regulatory requirements. Compact and modular simulators designed for smaller facilities are gaining traction, expanding accessibility across regional training centers.

Analysis of the Driving Test Simulator Market by Key Country

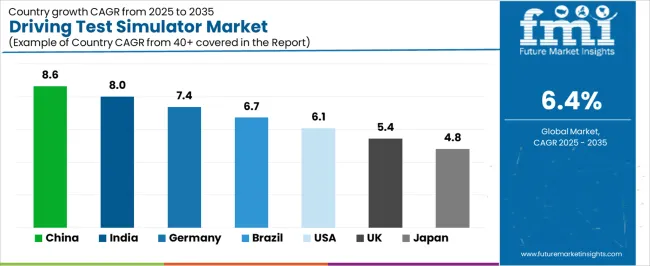
The global driving test simulator market is expanding through 2035, supported by stronger road-safety initiatives, broader use of simulation-based driver training, and increased integration of advanced vehicle-control modules in training systems. China leads with a 8.6% CAGR, followed by India (8.0%) and Germany (7.4%). Brazil grows at 6.7%, the United States at 6.1%, the United Kingdom at 5.4%, and Japan at 4.8%. Adoption is influenced by driver-licensing modernization, professional-training programs, fleet-safety initiatives, and growing use of VR- and motion-integrated simulators.
Driving Test Simulator Market Cagr Analysis By Country

Country CAGR (%)
China 8.6
India 8.0
Germany 7.4
Brazil 6.7
USA 6.1
UK 5.4
Japan 4.8

How is China leading the Driving Test Simulator Market?

China’s market grows at 8.6% CAGR, supported by rapid expansion of driver-training centers, stricter road-safety regulations, and increased use of simulation systems for standardized driving assessments. Training institutes integrate simulators equipped with multiple driving scenarios, vehicle-control analytics, and urban-traffic simulation modules designed for dense metropolitan environments. Manufacturers offer motion-platform simulators and high-resolution visual systems used for licensing preparation and fleet-training programs. Growth in new-energy vehicles increases demand for simulators featuring EV-specific driving behaviors and regenerative-braking models. Broader advancement in automotive-technology education also supports procurement across technical universities and vocational centers.

Key Market Factors:

  • Strong adoption across driver-training centers and licensing authorities.
  • Increased use of simulators aligned with road-safety regulations.
  • Expansion of EV-training modules and advanced vehicle-control analytics.
  • Broad integration in vocational and automotive-technology institutions.

How is India advancing the Driving Test Simulator Market?

India’s market grows at 8.0% CAGR, driven by modernization of driver-licensing processes, growing demand for standardized testing environments, and increased focus on structured driver-training programs. Driving simulators are used for skill assessment, hazard-perception practice, and basic-vehicle-control training across transport institutes. State authorities adopt simulation platforms to reduce manual-test variability and improve test accuracy. Training operators use simulators that include regional-road conditions, night-driving modules, and highway-response simulations. Growth in fleet-driver training for logistics and ride-hailing services strengthens market development. Broader investments in transport-safety programs reinforce long-term adoption.

Market Development Factors:
  • Rising demand for standardized license-test environments.
  • Increased adoption by transport institutes and training schools.
  • Strong usage in fleet-driver development programs.
  • Growth in hazard-perception and regional-driving simulation modules.

How is Germany advancing the Driving Test Simulator Market?

Driving Test Simulator Market Europe Country Market Share Analysis, 2025 & 2035

Germany’s market grows at 7.4% CAGR, supported by regulated training frameworks, high engineering standards, and consistent integration of simulation systems into professional-driving programs. Driver-training institutes use simulators for maneuver practice, reaction-time assessment, and vehicle-dynamics demonstration involving braking, acceleration, and steering analysis. Automotive-training centers incorporate simulators aligned with advanced-driver-assistance-system (ADAS) scenarios, allowing trainees to practice risk-avoidance and system-interaction tasks. Engineering schools use high-fidelity simulators for human-factors studies and vehicle-testing research. Continuous focus on safety compliance and skill-based licensing reinforces recurring procurement.

Key Market Characteristics:

  • Strong demand for ADAS-enabled simulation modules.
  • Broad adoption in regulated professional-driving and training centers.
  • Integration of high-precision vehicle-dynamics simulation.
  • Use across research institutes conducting driver-behavior studies.

How is Brazil developing the Driving Test Simulator Market?

Brazil’s market grows at 6.7% CAGR, driven by modernization of driver-training centers, increased focus on road-safety programs, and broader adoption of simulators in licensing environments. Training facilities use simulators for basic skill development, hazard-recognition practice, and night-driving exercises. Growth in logistics and delivery services increases demand for fleet-driver training systems incorporating urban-traffic and heavy-vehicle simulation modules. Local distributors supply entry-level and mid-range simulators suited to national licensing requirements. Broader investments in structured transport-training programs support annual demand.

Market Development Factors:
  • Increased use in standardized driver-training and licensing workflows.
  • Adoption in fleet-driver programs for logistics and delivery sectors.
  • Growth in simulators offering traffic-dense scenario training.
  • Wider distributor networks supplying modular training systems.

How is the United States progressing in the Driving Test Simulator Market?

Driving Test Simulator Market Country Value Analysis

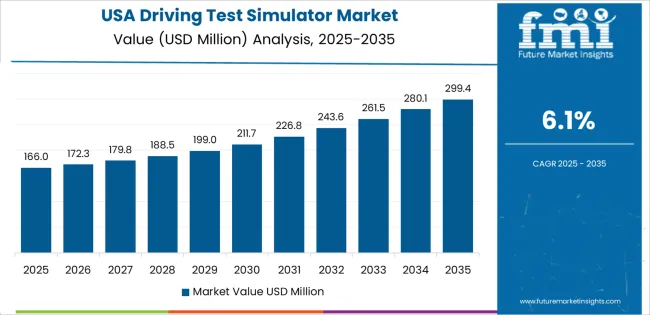
The United States grows at 6.1% CAGR, supported by extensive use of simulation in professional-driver development, commercial-fleet safety programs, and advanced transport-training institutions. Simulators are used for skill evaluation, distracted-driving assessment, and winter-condition training. Commercial fleets adopt simulators for compliance training and risk-mitigation programs. Academic and research institutions integrate high-fidelity simulators for driver-behavior analysis and advanced vehicle-interaction studies. Safety-focused training organizations increasingly deploy VR-based and motion-integrated simulators to strengthen training consistency.

Key Market Factors:

  • Strong demand from commercial-fleet safety and compliance programs.
  • Adoption of motion-platform and VR-integrated driving simulators.
  • Broad use in research centers studying driver behavior and vehicle interaction.
  • Growing focus on standardized training for high-risk scenarios.

How is the United Kingdom developing the Driving Test Simulator Market?

The United Kingdom’s market grows at 5.4% CAGR, supported by structured driver-testing processes, rising interest in hazard-perception training, and broader adoption of simulation systems in driving schools. Simulators include modules that replicate regional traffic conditions, adverse weather, and multi-lane driving. Authorities and private institutes use simulators to enhance test readiness and reduce training variability. Programs emphasizing safe-driving behavior and advanced road-scenario training increase demand for modular simulation platforms.

Market Development Factors:
  • Increased adoption for hazard-perception and skill-evaluation training.
  • Use in driving schools for regional-condition simulation.
  • Growing interest in structured scenario-based training.
  • Demand for multi-module simulators supporting licensing preparation.

How is Japan maintaining the Driving Test Simulator Market?

Driving Test Simulator Market Japan Market Share Analysis By Product Type

Japan’s market grows at 4.8% CAGR, supported by established driving-school systems, strong focus on safety training, and consistent use of simulators for risk-awareness and complex-traffic scenario practice. Japanese driving centers deploy simulators for lane-merging, urban-navigation, and emergency-response training aligned with national safety guidelines. Compact training facilities rely on high-precision systems equipped with traffic-signal interaction modules and controlled-handling scenarios. Broader automotive-technology education and senior-driver safety programs also contribute to stable demand.

Key Market Characteristics:
  • Increased use in structured safety and emergency-response training.
  • Strong adoption in compact driving-school facilities.
  • Integration of high-precision urban-scenario simulation modules.
  • Growing demand from senior-driver and automotive-technology programs.

What is the competitive landscape of the Driving Test Simulator Market?

Driving Test Simulator Market Analysis By Company

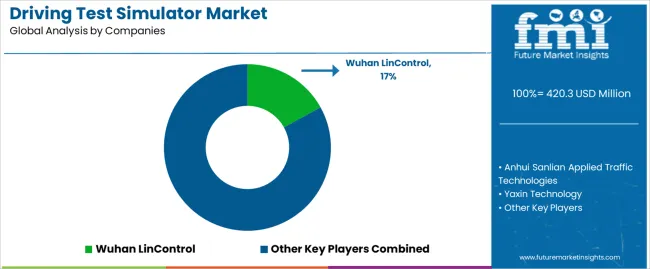
The driving test simulator market is moderately fragmented, with about a dozen manufacturers supplying simulation systems for driver training centers, licensing authorities, and vocational institutions. Wuhan LinControl leads the market with an estimated 17.0% global share, supported by its established simulator platforms, stable hardware software integration, and strong presence in provincial driving schools. Its position is reinforced by consistent scenario modelling and reliable performance in standardized testing environments.

Anhui Sanlian Applied Traffic Technologies, Yaxin Technology, Xuanbo Software, and iFlytek follow as major competitors, offering simulators designed for licensing examinations, hazard perception modules, and AI-enhanced training analytics. Their competitive strengths include robust motion platforms, localized traffic rule databases, and compatibility with national testing standards. Chuangfang Technology, Beike Tianhui, and Shandong Longchuang Electronic Technology maintain mid-tier positions with cost-efficient systems tailored to commercial driving centers and vocational schools.

Manufacturers such as Bangtai Softcom (Beijing) Technology, Envision Intelligent Technology, Duolun Technology, and Esmap expand regional availability through flexible simulator configurations, modular software upgrades, and support for multi-vehicle categories including motorcycles, passenger cars, and commercial trucks.

Competition centers on simulation accuracy, hardware durability, scenario realism, examination compliance, and system scalability. Market growth is driven by increased digitalization of driver training, adoption of standardized simulator-based assessment, and rising demand for cost-effective, repeatable, and regulation-aligned training systems across urban and regional licensing centers.

Key Players in the Driving Test Simulator Market

  • Wuhan LinControl
  • Anhui Sanlian Applied Traffic Technologies
  • Yaxin Technology
  • Xuanbo Software
  • iFlytek
  • Chuangfang Technology
  • Beike Tianhui
  • Shandong Longchuang Electronic Technology
  • Bangtai Softcom (Beijing) Technology
  • Envision Intelligent Technology
  • Duolun Technology
  • Esmap

Scope of the Report

Items Values
Quantitative Units USD million
Product Type Subject 2 Special Plane, Subject 3 Road Test Machine, Others
Application Driving Test, Corporate Training, Others
Regions Covered Asia Pacific, Europe, North America, Latin America, Middle East & Africa
Countries Covered India, China, USA, Germany, South Korea, Japan, Italy, and 40+ countries
Key Companies Profiled Wuhan LinControl, Anhui Sanlian Applied Traffic Technologies, Yaxin Technology, Xuanbo Software, iFlytek, Chuangfang Technology, Beike Tianhui, Shandong Longchuang Electronic Technology, Bangtai Softcom (Beijing) Technology, Envision Intelligent Technology, Duolun Technology, Esmap
Additional Attributes Dollar sales by product type and application categories; regional adoption trends across Asia Pacific, Europe, and North America; competitive landscape of driving simulation technology developers; advancements in immersive road-testing systems, AI-driven training assessment, and VR-based simulation; integration with driving sc

Driving Test Simulator Market by Segment

Product Type:

  • Subject 2 Special Plane
  • Subject 3 Road Test Machine
  • Others

Application:

  • Driving Test
  • Corporate Training
  • Others

Region:

  • Asia Pacific
    • China
    • Japan
    • South Korea
    • India
    • Australia & New Zealand
    • ASEAN
    • Rest of Asia Pacific
  • Europe
    • Germany
    • United Kingdom
    • France
    • Italy
    • Spain
    • Nordic
    • BENELUX
    • Rest of Europe
  • North America
    • United States
    • Canada
    • Mexico
  • Latin America
    • Brazil
    • Chile
    • Rest of Latin America
  • Middle East & Africa
    • Kingdom of Saudi Arabia
    • Other GCC Countries
    • Turkey
    • South Africa
    • Other African Union
    • Rest of Middle East & Africa

Frequently Asked Questions

How big is the driving test simulator market in 2025?

The global driving test simulator market is estimated to be valued at USD 420.3 million in 2025.

What will be the size of driving test simulator market in 2035?

The market size for the driving test simulator market is projected to reach USD 781.6 million by 2035.

How much will be the driving test simulator market growth between 2025 and 2035?

The driving test simulator market is expected to grow at a 6.4% CAGR between 2025 and 2035.

What are the key product types in the driving test simulator market?

The key product types in driving test simulator market are subject 2 special plane, subject 3 road test machine and others.

Which application segment to contribute significant share in the driving test simulator market in 2025?

In terms of application, driving test segment to command 64.0% share in the driving test simulator market in 2025.

Table of Content

  1. Executive Summary
    • Global Market Outlook
    • Demand to side Trends
    • Supply to side Trends
    • Technology Roadmap Analysis
    • Analysis and Recommendations
  2. Market Overview
    • Market Coverage / Taxonomy
    • Market Definition / Scope / Limitations
  3. Market Background
    • Market Dynamics
      • Drivers
      • Restraints
      • Opportunity
      • Trends
    • Scenario Forecast
      • Demand in Optimistic Scenario
      • Demand in Likely Scenario
      • Demand in Conservative Scenario
    • Opportunity Map Analysis
    • Product Life Cycle Analysis
    • Supply Chain Analysis
    • Investment Feasibility Matrix
    • Value Chain Analysis
    • PESTLE and Porter’s Analysis
    • Regulatory Landscape
    • Regional Parent Market Outlook
    • Production and Consumption Statistics
    • Import and Export Statistics
  4. Global Market Analysis 2020 to 2024 and Forecast, 2025 to 2035
    • Historical Market Size Value (USD Million) Analysis, 2020 to 2024
    • Current and Future Market Size Value (USD Million) Projections, 2025 to 2035
      • Y to o to Y Growth Trend Analysis
      • Absolute $ Opportunity Analysis
  5. Global Market Pricing Analysis 2020 to 2024 and Forecast 2025 to 2035
  6. Global Market Analysis 2020 to 2024 and Forecast 2025 to 2035, By Product Type
    • Introduction / Key Findings
    • Historical Market Size Value (USD Million) Analysis By Product Type , 2020 to 2024
    • Current and Future Market Size Value (USD Million) Analysis and Forecast By Product Type , 2025 to 2035
      • Subject 2 Special Plane
      • Subject 3 Road Test Machine
      • Others
    • Y to o to Y Growth Trend Analysis By Product Type , 2020 to 2024
    • Absolute $ Opportunity Analysis By Product Type , 2025 to 2035
  7. Global Market Analysis 2020 to 2024 and Forecast 2025 to 2035, By Application
    • Introduction / Key Findings
    • Historical Market Size Value (USD Million) Analysis By Application, 2020 to 2024
    • Current and Future Market Size Value (USD Million) Analysis and Forecast By Application, 2025 to 2035
      • Driving Test
      • Corporate Training
      • Others
    • Y to o to Y Growth Trend Analysis By Application, 2020 to 2024
    • Absolute $ Opportunity Analysis By Application, 2025 to 2035
  8. Global Market Analysis 2020 to 2024 and Forecast 2025 to 2035, By Region
    • Introduction
    • Historical Market Size Value (USD Million) Analysis By Region, 2020 to 2024
    • Current Market Size Value (USD Million) Analysis and Forecast By Region, 2025 to 2035
      • North America
      • Latin America
      • Western Europe
      • Eastern Europe
      • East Asia
      • South Asia and Pacific
      • Middle East & Africa
    • Market Attractiveness Analysis By Region
  9. North America Market Analysis 2020 to 2024 and Forecast 2025 to 2035, By Country
    • Historical Market Size Value (USD Million) Trend Analysis By Market Taxonomy, 2020 to 2024
    • Market Size Value (USD Million) Forecast By Market Taxonomy, 2025 to 2035
      • By Country
        • USA
        • Canada
        • Mexico
      • By Product Type
      • By Application
    • Market Attractiveness Analysis
      • By Country
      • By Product Type
      • By Application
    • Key Takeaways
  10. Latin America Market Analysis 2020 to 2024 and Forecast 2025 to 2035, By Country
    • Historical Market Size Value (USD Million) Trend Analysis By Market Taxonomy, 2020 to 2024
    • Market Size Value (USD Million) Forecast By Market Taxonomy, 2025 to 2035
      • By Country
        • Brazil
        • Chile
        • Rest of Latin America
      • By Product Type
      • By Application
    • Market Attractiveness Analysis
      • By Country
      • By Product Type
      • By Application
    • Key Takeaways
  11. Western Europe Market Analysis 2020 to 2024 and Forecast 2025 to 2035, By Country
    • Historical Market Size Value (USD Million) Trend Analysis By Market Taxonomy, 2020 to 2024
    • Market Size Value (USD Million) Forecast By Market Taxonomy, 2025 to 2035
      • By Country
        • Germany
        • UK
        • Italy
        • Spain
        • France
        • Nordic
        • BENELUX
        • Rest of Western Europe
      • By Product Type
      • By Application
    • Market Attractiveness Analysis
      • By Country
      • By Product Type
      • By Application
    • Key Takeaways
  12. Eastern Europe Market Analysis 2020 to 2024 and Forecast 2025 to 2035, By Country
    • Historical Market Size Value (USD Million) Trend Analysis By Market Taxonomy, 2020 to 2024
    • Market Size Value (USD Million) Forecast By Market Taxonomy, 2025 to 2035
      • By Country
        • Russia
        • Poland
        • Hungary
        • Balkan & Baltic
        • Rest of Eastern Europe
      • By Product Type
      • By Application
    • Market Attractiveness Analysis
      • By Country
      • By Product Type
      • By Application
    • Key Takeaways
  13. East Asia Market Analysis 2020 to 2024 and Forecast 2025 to 2035, By Country
    • Historical Market Size Value (USD Million) Trend Analysis By Market Taxonomy, 2020 to 2024
    • Market Size Value (USD Million) Forecast By Market Taxonomy, 2025 to 2035
      • By Country
        • China
        • Japan
        • South Korea
      • By Product Type
      • By Application
    • Market Attractiveness Analysis
      • By Country
      • By Product Type
      • By Application
    • Key Takeaways
  14. South Asia and Pacific Market Analysis 2020 to 2024 and Forecast 2025 to 2035, By Country
    • Historical Market Size Value (USD Million) Trend Analysis By Market Taxonomy, 2020 to 2024
    • Market Size Value (USD Million) Forecast By Market Taxonomy, 2025 to 2035
      • By Country
        • India
        • ASEAN
        • Australia & New Zealand
        • Rest of South Asia and Pacific
      • By Product Type
      • By Application
    • Market Attractiveness Analysis
      • By Country
      • By Product Type
      • By Application
    • Key Takeaways
  15. Middle East & Africa Market Analysis 2020 to 2024 and Forecast 2025 to 2035, By Country
    • Historical Market Size Value (USD Million) Trend Analysis By Market Taxonomy, 2020 to 2024
    • Market Size Value (USD Million) Forecast By Market Taxonomy, 2025 to 2035
      • By Country
        • Kingdom of Saudi Arabia
        • Other GCC Countries
        • Turkiye
        • South Africa
        • Other African Union
        • Rest of Middle East & Africa
      • By Product Type
      • By Application
    • Market Attractiveness Analysis
      • By Country
      • By Product Type
      • By Application
    • Key Takeaways
  16. Key Countries Market Analysis
    • USA
      • Pricing Analysis
      • Market Share Analysis, 2024
        • By Product Type
        • By Application
    • Canada
      • Pricing Analysis
      • Market Share Analysis, 2024
        • By Product Type
        • By Application
    • Mexico
      • Pricing Analysis
      • Market Share Analysis, 2024
        • By Product Type
        • By Application
    • Brazil
      • Pricing Analysis
      • Market Share Analysis, 2024
        • By Product Type
        • By Application
    • Chile
      • Pricing Analysis
      • Market Share Analysis, 2024
        • By Product Type
        • By Application
    • Germany
      • Pricing Analysis
      • Market Share Analysis, 2024
        • By Product Type
        • By Application
    • UK
      • Pricing Analysis
      • Market Share Analysis, 2024
        • By Product Type
        • By Application
    • Italy
      • Pricing Analysis
      • Market Share Analysis, 2024
        • By Product Type
        • By Application
    • Spain
      • Pricing Analysis
      • Market Share Analysis, 2024
        • By Product Type
        • By Application
    • France
      • Pricing Analysis
      • Market Share Analysis, 2024
        • By Product Type
        • By Application
    • India
      • Pricing Analysis
      • Market Share Analysis, 2024
        • By Product Type
        • By Application
    • ASEAN
      • Pricing Analysis
      • Market Share Analysis, 2024
        • By Product Type
        • By Application
    • Australia & New Zealand
      • Pricing Analysis
      • Market Share Analysis, 2024
        • By Product Type
        • By Application
    • China
      • Pricing Analysis
      • Market Share Analysis, 2024
        • By Product Type
        • By Application
    • Japan
      • Pricing Analysis
      • Market Share Analysis, 2024
        • By Product Type
        • By Application
    • South Korea
      • Pricing Analysis
      • Market Share Analysis, 2024
        • By Product Type
        • By Application
    • Russia
      • Pricing Analysis
      • Market Share Analysis, 2024
        • By Product Type
        • By Application
    • Poland
      • Pricing Analysis
      • Market Share Analysis, 2024
        • By Product Type
        • By Application
    • Hungary
      • Pricing Analysis
      • Market Share Analysis, 2024
        • By Product Type
        • By Application
    • Kingdom of Saudi Arabia
      • Pricing Analysis
      • Market Share Analysis, 2024
        • By Product Type
        • By Application
    • Turkiye
      • Pricing Analysis
      • Market Share Analysis, 2024
        • By Product Type
        • By Application
    • South Africa
      • Pricing Analysis
      • Market Share Analysis, 2024
        • By Product Type
        • By Application
  17. Market Structure Analysis
    • Competition Dashboard
    • Competition Benchmarking
    • Market Share Analysis of Top Players
      • By Regional
      • By Product Type
      • By Application
  18. Competition Analysis
    • Competition Deep Dive
      • Wuhan LinControl
        • Overview
        • Product Portfolio
        • Profitability by Market Segments (Product/Age /Sales Channel/Region)
        • Sales Footprint
        • Strategy Overview
          • Marketing Strategy
          • Product Strategy
          • Channel Strategy
      • Anhui Sanlian Applied Traffic Technologies
      • Yaxin Technology
      • Xuanbo Software
      • iFlytek
      • Chuangfang Technology
      • Beike Tianhui
      • Shandong Longchuang Electronic Technology
      • Bangtai Softcom (Beijing) Technology
      • Envision Intelligent Technology
      • Duolun Technology
      • Esmap
  19. Assumptions & Acronyms Used
  20. Research Methodology

List of Tables

  • Table 1: Global Market Value (USD Million) Forecast by Region, 2020 to 2035
  • Table 2: Global Market Value (USD Million) Forecast by Product Type , 2020 to 2035
  • Table 3: Global Market Value (USD Million) Forecast by Application, 2020 to 2035
  • Table 4: North America Market Value (USD Million) Forecast by Country, 2020 to 2035
  • Table 5: North America Market Value (USD Million) Forecast by Product Type , 2020 to 2035
  • Table 6: North America Market Value (USD Million) Forecast by Application, 2020 to 2035
  • Table 7: Latin America Market Value (USD Million) Forecast by Country, 2020 to 2035
  • Table 8: Latin America Market Value (USD Million) Forecast by Product Type , 2020 to 2035
  • Table 9: Latin America Market Value (USD Million) Forecast by Application, 2020 to 2035
  • Table 10: Western Europe Market Value (USD Million) Forecast by Country, 2020 to 2035
  • Table 11: Western Europe Market Value (USD Million) Forecast by Product Type , 2020 to 2035
  • Table 12: Western Europe Market Value (USD Million) Forecast by Application, 2020 to 2035
  • Table 13: Eastern Europe Market Value (USD Million) Forecast by Country, 2020 to 2035
  • Table 14: Eastern Europe Market Value (USD Million) Forecast by Product Type , 2020 to 2035
  • Table 15: Eastern Europe Market Value (USD Million) Forecast by Application, 2020 to 2035
  • Table 16: East Asia Market Value (USD Million) Forecast by Country, 2020 to 2035
  • Table 17: East Asia Market Value (USD Million) Forecast by Product Type , 2020 to 2035
  • Table 18: East Asia Market Value (USD Million) Forecast by Application, 2020 to 2035
  • Table 19: South Asia and Pacific Market Value (USD Million) Forecast by Country, 2020 to 2035
  • Table 20: South Asia and Pacific Market Value (USD Million) Forecast by Product Type , 2020 to 2035
  • Table 21: South Asia and Pacific Market Value (USD Million) Forecast by Application, 2020 to 2035
  • Table 22: Middle East & Africa Market Value (USD Million) Forecast by Country, 2020 to 2035
  • Table 23: Middle East & Africa Market Value (USD Million) Forecast by Product Type , 2020 to 2035
  • Table 24: Middle East & Africa Market Value (USD Million) Forecast by Application, 2020 to 2035

List of Figures

  • Figure 1: Global Market Pricing Analysis
  • Figure 2: Global Market Value (USD Million) Forecast 2020-2035
  • Figure 3: Global Market Value Share and BPS Analysis by Product Type , 2025 and 2035
  • Figure 4: Global Market Y-o-Y Growth Comparison by Product Type , 2025-2035
  • Figure 5: Global Market Attractiveness Analysis by Product Type
  • Figure 6: Global Market Value Share and BPS Analysis by Application, 2025 and 2035
  • Figure 7: Global Market Y-o-Y Growth Comparison by Application, 2025-2035
  • Figure 8: Global Market Attractiveness Analysis by Application
  • Figure 9: Global Market Value (USD Million) Share and BPS Analysis by Region, 2025 and 2035
  • Figure 10: Global Market Y-o-Y Growth Comparison by Region, 2025-2035
  • Figure 11: Global Market Attractiveness Analysis by Region
  • Figure 12: North America Market Incremental Dollar Opportunity, 2025-2035
  • Figure 13: Latin America Market Incremental Dollar Opportunity, 2025-2035
  • Figure 14: Western Europe Market Incremental Dollar Opportunity, 2025-2035
  • Figure 15: Eastern Europe Market Incremental Dollar Opportunity, 2025-2035
  • Figure 16: East Asia Market Incremental Dollar Opportunity, 2025-2035
  • Figure 17: South Asia and Pacific Market Incremental Dollar Opportunity, 2025-2035
  • Figure 18: Middle East & Africa Market Incremental Dollar Opportunity, 2025-2035
  • Figure 19: North America Market Value Share and BPS Analysis by Country, 2025 and 2035
  • Figure 20: North America Market Value Share and BPS Analysis by Product Type , 2025 and 2035
  • Figure 21: North America Market Y-o-Y Growth Comparison by Product Type , 2025-2035
  • Figure 22: North America Market Attractiveness Analysis by Product Type
  • Figure 23: North America Market Value Share and BPS Analysis by Application, 2025 and 2035
  • Figure 24: North America Market Y-o-Y Growth Comparison by Application, 2025-2035
  • Figure 25: North America Market Attractiveness Analysis by Application
  • Figure 26: Latin America Market Value Share and BPS Analysis by Country, 2025 and 2035
  • Figure 27: Latin America Market Value Share and BPS Analysis by Product Type , 2025 and 2035
  • Figure 28: Latin America Market Y-o-Y Growth Comparison by Product Type , 2025-2035
  • Figure 29: Latin America Market Attractiveness Analysis by Product Type
  • Figure 30: Latin America Market Value Share and BPS Analysis by Application, 2025 and 2035
  • Figure 31: Latin America Market Y-o-Y Growth Comparison by Application, 2025-2035
  • Figure 32: Latin America Market Attractiveness Analysis by Application
  • Figure 33: Western Europe Market Value Share and BPS Analysis by Country, 2025 and 2035
  • Figure 34: Western Europe Market Value Share and BPS Analysis by Product Type , 2025 and 2035
  • Figure 35: Western Europe Market Y-o-Y Growth Comparison by Product Type , 2025-2035
  • Figure 36: Western Europe Market Attractiveness Analysis by Product Type
  • Figure 37: Western Europe Market Value Share and BPS Analysis by Application, 2025 and 2035
  • Figure 38: Western Europe Market Y-o-Y Growth Comparison by Application, 2025-2035
  • Figure 39: Western Europe Market Attractiveness Analysis by Application
  • Figure 40: Eastern Europe Market Value Share and BPS Analysis by Country, 2025 and 2035
  • Figure 41: Eastern Europe Market Value Share and BPS Analysis by Product Type , 2025 and 2035
  • Figure 42: Eastern Europe Market Y-o-Y Growth Comparison by Product Type , 2025-2035
  • Figure 43: Eastern Europe Market Attractiveness Analysis by Product Type
  • Figure 44: Eastern Europe Market Value Share and BPS Analysis by Application, 2025 and 2035
  • Figure 45: Eastern Europe Market Y-o-Y Growth Comparison by Application, 2025-2035
  • Figure 46: Eastern Europe Market Attractiveness Analysis by Application
  • Figure 47: East Asia Market Value Share and BPS Analysis by Country, 2025 and 2035
  • Figure 48: East Asia Market Value Share and BPS Analysis by Product Type , 2025 and 2035
  • Figure 49: East Asia Market Y-o-Y Growth Comparison by Product Type , 2025-2035
  • Figure 50: East Asia Market Attractiveness Analysis by Product Type
  • Figure 51: East Asia Market Value Share and BPS Analysis by Application, 2025 and 2035
  • Figure 52: East Asia Market Y-o-Y Growth Comparison by Application, 2025-2035
  • Figure 53: East Asia Market Attractiveness Analysis by Application
  • Figure 54: South Asia and Pacific Market Value Share and BPS Analysis by Country, 2025 and 2035
  • Figure 55: South Asia and Pacific Market Value Share and BPS Analysis by Product Type , 2025 and 2035
  • Figure 56: South Asia and Pacific Market Y-o-Y Growth Comparison by Product Type , 2025-2035
  • Figure 57: South Asia and Pacific Market Attractiveness Analysis by Product Type
  • Figure 58: South Asia and Pacific Market Value Share and BPS Analysis by Application, 2025 and 2035
  • Figure 59: South Asia and Pacific Market Y-o-Y Growth Comparison by Application, 2025-2035
  • Figure 60: South Asia and Pacific Market Attractiveness Analysis by Application
  • Figure 61: Middle East & Africa Market Value Share and BPS Analysis by Country, 2025 and 2035
  • Figure 62: Middle East & Africa Market Value Share and BPS Analysis by Product Type , 2025 and 2035
  • Figure 63: Middle East & Africa Market Y-o-Y Growth Comparison by Product Type , 2025-2035
  • Figure 64: Middle East & Africa Market Attractiveness Analysis by Product Type
  • Figure 65: Middle East & Africa Market Value Share and BPS Analysis by Application, 2025 and 2035
  • Figure 66: Middle East & Africa Market Y-o-Y Growth Comparison by Application, 2025-2035
  • Figure 67: Middle East & Africa Market Attractiveness Analysis by Application
  • Figure 68: Global Market - Tier Structure Analysis
  • Figure 69: Global Market - Company Share Analysis
Dashboard
Dashboard
Dashboard
Dashboard
Dashboard
Dashboard

Our Research Products

Full Research Suite

The "Full Research Suite" delivers actionable market intel, deep dives on markets or technologies, so clients act faster, cut risk, and unlock growth.

Competitor Leaderboard Report

The Leaderboard benchmarks and ranks top vendors, classifying them as Established Leaders, Leading Challengers, or Disruptors & Challengers.

Future Leaders Index

Locates where complements amplify value and substitutes erode it, forecasting net impact by horizon

Market Data & Forecasts

We deliver granular, decision-grade intel: market sizing, 5-year forecasts, pricing, adoption, usage, revenue, and operational KPIs—plus competitor tracking, regulation, and value chains—across 60 countries broadly.

Market Focus Report

Spot the shifts before they hit your P&L. We track inflection points, adoption curves, pricing moves, and ecosystem plays to show where demand is heading, why it is changing, and what to do next across high-growth markets and disruptive tech

Survey Report

Real-time reads of user behavior. We track shifting priorities, perceptions of today’s and next-gen services, and provider experience, then pace how fast tech moves from trial to adoption, blending buyer, consumer, and channel inputs with social signals (#WhySwitch, #UX).

Bespoke Reports

Partner with our analyst team to build a custom report designed around your business priorities. From analysing market trends to assessing competitors or crafting bespoke datasets, we tailor insights to your needs.

Supplier Intelligence

Discovery & Profiling

Capacity & Footprint

Performance & Risk

Compliance & Governance

Commercial Readiness

Who Supplies Whom

Scorecards & Shortlists

Playbooks & Docs

Category Intelligence

Definition & Scope

Demand & Use Cases

Cost Drivers

Market Structure

Supply Chain Map

Trade & Policy

Operating Norms

Deliverables

Buyer Intelligence

Account Basics

Spend & Scope

Procurement Model

Vendor Requirements

Terms & Policies

Entry Strategy

Pain Points & Triggers

Outputs

Pricing Analysis

Benchmarks

Trends

Should-Cost

Indexation

Landed Cost

Commercial Terms

Deliverables

Brand Analysis

Positioning & Value Prop

Share & Presence

Customer Evidence

Go-to-Market

Digital & Reputation

Compliance & Trust

KPIs & Gaps

Outputs

Full Research Suite comprises of:

Market outlook & trends analysis

Market outlook & trends analysis

Interviews & case studies

Interviews & case studies

Strategic recommendations

Strategic recommendations

Vendor profiles & capabilities analysis

Vendor profiles & capabilities analysis

5-year forecasts

5-year forecasts

8 regions and 60+ country-level data splits

8 regions and 60+ country-level data splits

Market segment data splits

Market segment data splits

12 months of continuous data updates

12 months of continuous data updates

DELIVERED AS:

PDF EXCEL ONLINE

Full Research Suite


$5000

$7500

$10000

Buy Report Now
Similar Industry Reports

Similar Industry Reports

Driving Protection Gear Market

Driving Protection Gear Market Analysis by Product, Material, Vehicle, Consumer Group, Distribution Channel and Region 2025 to 2035

Driving Helmet Market

Driving Helmet Market

Driving Armor Market

Driving Armor Market

Driving Simulator Market

Driving Simulator Market

Pile Driving Machine Market

Pile Driving Machine Market Size and Share Forecast Outlook 2025 to 2035

AI-Based Driving Systems (L2 to L5) Market

AI-Based Driving Systems (L2 to L5) Market Analysis - Size, Share, and Forecast Outlook 2025 to 2035

Autonomous Driving Virtual Simulation Platform Market

Autonomous Driving Virtual Simulation Platform Market Forecast and Outlook 2025 to 2035

Autonomous Driving Simulation Tester Market

Autonomous Driving Simulation Tester Market Size and Share Forecast Outlook 2025 to 2035

Intelligent Driving Technology Solution Market

Intelligent Driving Technology Solution Market Size and Share Forecast Outlook 2025 to 2035

Test and Measurement Equipment Market

Test and Measurement Equipment Market Size and Share Forecast Outlook 2025 to 2035

Testosterone Test Market

Testosterone Test Market Size and Share Forecast Outlook 2025 to 2035

Test rig Market
Test rig Market

Test rig Market Size and Share Forecast Outlook 2025 to 2035

Test and Measurement Sensors Market

Test and Measurement Sensors Market Size and Share Forecast Outlook 2025 to 2035

Testing, Inspection & Certification Market

Testing, Inspection & Certification Market Growth – Trends & Forecast 2025 to 2035

Testosterone Booster Market

Testosterone Booster Industry Analysis by Component, Source, Distribution Channels and Regions 2025 to 2035

Testosterone Injectable Market

Testosterone Injectable Market

Test Tube Market
Test Tube Market

Test Tube Market

Testliner Market
Testliner Market

Testliner Market

Testicular Cancer Treatment Market

Testicular Cancer Treatment Market

Intestinal Health Pet Dietary Supplement Market

Intestinal Health Pet Dietary Supplement Market Size and Share Forecast Outlook 2025 to 2035

Future Market Insights

Driving Test Simulator Market

Chat With MaRIA

Chat With

MaRIA

Hi There, I am MaRIA, Your Market Research Intelligence Assistant. How may I help you?