

- Market Size (2026)
- USD 2.8 Bn
- Forecast (2036)
- USD 7.5 Bn
- CAGR (2026 to 2036)
- 10.4%
E-Axle Power Cable and Connector Systems Market Size, Forecast, and Outlook By FMI
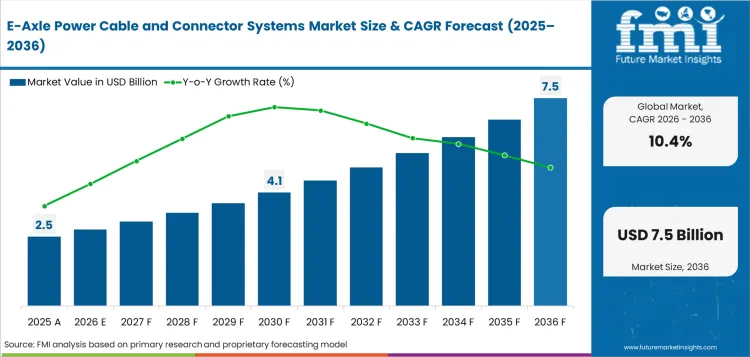
E-axle power cable and connector systems market was valued at USD 2.5 billion in 2025 and is expected to reach USD 2.8 billion in 2026. Demand is forecast to reach USD 7.5 billion by 2036 at 10.4% CAGR during the assessment period.
Summary of the E-Axle Power Cable and Connector Systems Market
- Demand and Growth Drivers
- EV platform expansion is raising the need for safe power routing between battery packs and e-axle units. Automakers need cable assemblies that handle current and heat inside tight vehicle layouts.
- Higher voltage systems are making shielding and sealing more important. Connector designs must protect power flow near underbody areas and compact drive units.
- Electric commercial vehicles are influencing demand for tougher cable systems. These vehicles need connectors that can handle vibration and longer operating hours.
- Product and Segment View
- High-voltage cables are likely to stay important because e-axle systems need shielded power paths between inverters and drive units.
- Power connectors are gaining use as automakers move toward modular e-drive layouts. Sealed connector designs help vehicle plants assemble systems with fewer safety risks.
- Copper conductors are expected to lead because they offer stable current handling and reliable termination quality for high-load e-axle cables.
- Geography and Competitive Outlook
- China is likely to stay a key market as large EV production keeps demand steady for drivetrain cable programs.
- India is expected to move ahead faster as local EV assembly increases demand for high-voltage cable systems.
- Suppliers who can provide sealed connectors and tested cable assemblies are likely to gain stronger positions. Automakers need partners who can support safety checks before vehicle launch.
- Analyst Opinion
- Nikhil Kaitwade, Principal Consultant at FMI says, “E-axle power cable selection is now a drivetrain reliability decision. Automakers need cable systems that keep current stable and control heat. Clear vehicle-level validation will guide supplier choice. Suppliers able to deliver sealed connectors and repeatable harness assembly will be preferred in new EV platforms.”
- E-Axle Power Cable and Connector Systems Market Value Analysis
- The e-axle power cable and connector systems market is becoming a key part of EV drivetrain reliability.
- Demand is supported by the need for safe power flow between battery packs and compact e-axle units.
- Sealed connectors are gaining value because underbody power routes face heat, vibration and water exposure.
- Suppliers can gain traction by offering tested cable assemblies that help automakers reduce failure risk before vehicle launch.
Key Takeaways, Market Size, and Forecast
- E-axle power cable and connector systems market stood at USD 2.5 billion in 2025.
- By 2036, industry revenue is forecast to reach USD 7.5 billion.
- Market value is expected to advance at 10.4% CAGR during the same period.
- Market revenue is predicted to add USD 4.7 billion in incremental opportunity over 2026 to 2036.
- Battery electric vehicles are likely to account for 62.0% of vehicle type demand in 2026.
- OEM fitment is anticipated to represent 88.0% of sales channel demand in 2026.
- India at 13.5% CAGR and China at 12.4% CAGR are expected to hold lucrative growth prospects during the forecast period.
E-axle power cable and connector systems are becoming more critical as EV platforms place higher current near compact drive units. In December 2024, NHTSA finalized FMVSS No. 305a for electric powertrain safety with compliance dates running from December 2025 to September 2028. The rule makes shock protection and isolation evidence more important for high-voltage cable routing near the drive unit. In August 2024, Amphenol PCD introduced its EXCEL|MATE HVSL Series with 1 to 6 positions and rated current from 20A to 450A. The range helps harness suppliers serve battery-to-e-motor links across different EV platforms with fewer unique connector designs. In December 2024, patent publication WO2024248919A1 described a high-voltage connector shield with cable restraint placed at least eight centimeters from the connector. The design points to growing focus on vibration control and heat protection around e-axle interfaces. Suppliers that combine rated connectors and better strain relief are likely to observe stronger acceptance in OEM programs.
E-Axle Power Cable and Connector Systems Market Definition
E-axle power cable and connector systems cover high-voltage cables and sealed power connectors used in electric drivetrain routing. These systems carry traction power between battery packs, inverters and compact e-axle drive units.
E-Axle Power Cable and Connector Systems Market Inclusions
Scope includes shielded high-voltage cables and power connectors. Terminals and seals are included for e-axle power routes. High-voltage interlock loop leads are included for safety monitoring. Key stakeholders include EV manufacturers and tier-one wiring suppliers. Connector makers and e-drive integrators support validation and supply.
E-Axle Power Cable and Connector Systems Market Exclusions
Scope excludes charging station cables and low-voltage signal harnesses unless sold as part of an e-axle power routing package. Battery cell tabs and busbars are excluded unless supplied with the e-axle cable and connector set. General infotainment wiring is excluded from the scope.
E-Axle Power Cable and Connector Systems Market Research Methodology
- Primary Research: Analysts reviewed EV wiring suppliers and connector producers across major automotive countries to understand product depth and supply readiness.
- Desk Research: Public EV sales data and government policy documents were reviewed to check how vehicle electrification supports demand.
- Market Sizing and Forecasting: Market size was calculated using EV production volumes and e-axle fitment rates across key vehicle programs.
- Data Validation: Forecast checks compared electric vehicle sales with high-voltage wiring adoption. Supplier product coverage was reviewed to confirm market relevance.
Why is the E-Axle Power Cable and Connector Systems Market Growing?
- EV platform volumes are raising demand for validated high-voltage power routes between battery packs and e-axle drive units.
- Higher current loads are increasing the need for cable shielding and secure connector locking designs.
- Commercial electric vehicles are extending demand into heavier cable assemblies due to longer operating hours and vibration stress.
Power routing demand is rising as EV sales move from early launches into wider vehicle lineups. IEA reported that electric car sales rose by more than 20.0% year over year in 2025 and reached 21.0 million units. This scale changes supplier planning because cable design and connector approval must be ready before vehicle launch.
High-voltage cable design is moving closer to drivetrain engineering as more power is packed into compact e-axle housings. Molex stated in May 2024 that its MX-DaSH connector system can reduce packaging needs by up to 30.0% in selected configurations. This supports compact routing near drivetrain modules and electric vehicle battery connector interfaces. Suppliers who can prove sealing and shielding quality will have a better chance to sustain in the market.
Market Segmentation Analysis
- In 2026, high-voltage cables are expected to account for 41.0% share.
- 400V systems are likely to represent 56.0% of voltage class demand in 2026.
- Battery electric vehicles are anticipated to account for 62.0% share in 2026.
- For OEM fitment, 88.0% share is forecast in 2026.
- In 2026, copper conductors are expected to hold 72.0% share.
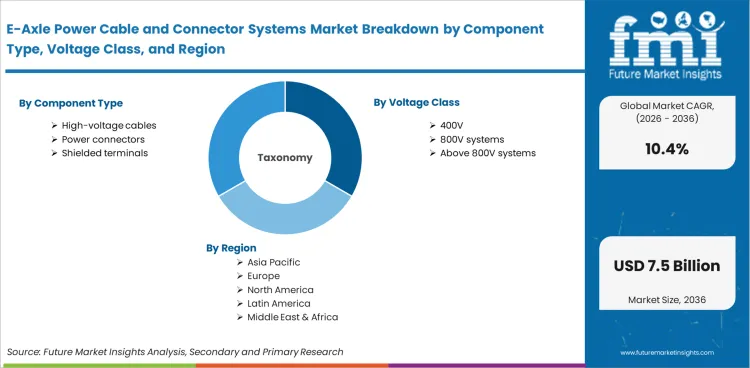
The market for e-axle power cable and connector systems is divided into groups based on component type, voltage class, vehicle type, sales channel, and conductor material. Component type covers high-voltage cables, power connectors, shielded terminals, and HVIL leads. Voltage class includes 400V systems, 800V systems, and above 800V systems. Vehicle type includes battery electric vehicles, plug-in hybrids, and electric commercial vehicles. Sales channel covers OEM fitment and service replacement. Conductor material includes copper conductors, aluminum conductors, and mixed conductors.
Insights into E-Axle Power Cable and Connector Systems Market by Component Type
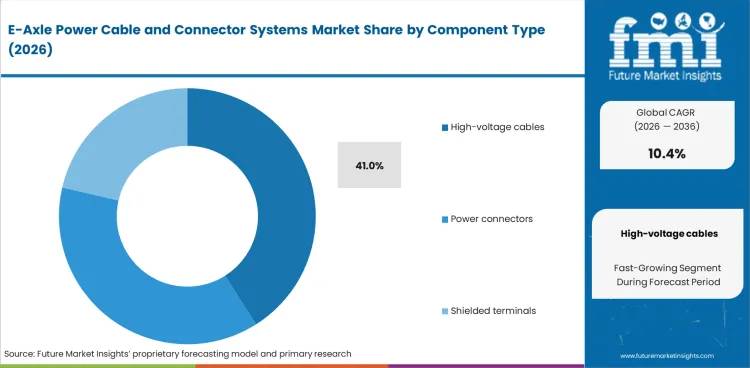
- High-voltage cables are expected to account for 41.0% share in 2026. E-axle systems need shielded cable paths that can carry high current near compact drive units.
- Power connectors are gaining attention because modular e-drive units need sealed interfaces at vehicle plants. Secure connector designs help protect power flow during assembly and daily vehicle use.
Insights into E-Axle Power Cable and Connector Systems Market by Voltage Class
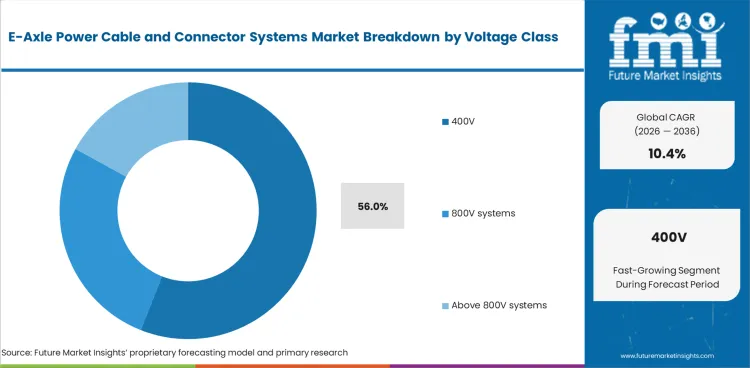
- In 2026, 400V systems are anticipated to represent 56.0% share. Many mass EV platforms continue to use proven battery and inverter layouts.
- 800V systems are likely to increase demand as fast charging places more pressure on insulation quality. Higher voltage platforms need cable systems that manage heat with stable power transfer.
Insights into E-Axle Power Cable and Connector Systems Market by Vehicle Type
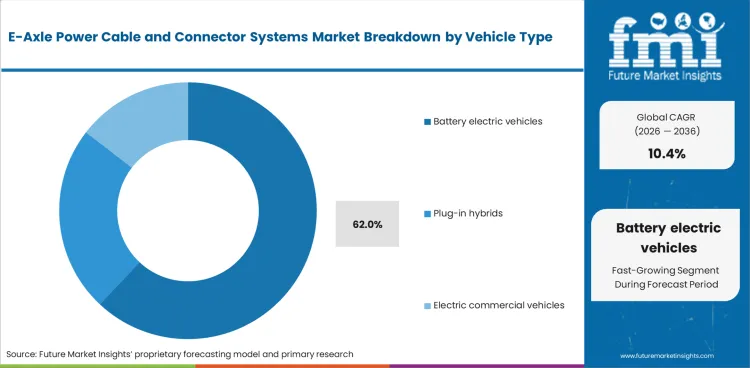
- Battery electric vehicles are forecast to account for 62.0% share during the same period. Full electric platforms need dedicated power routes from the battery pack to the e-axle.
- Electric commercial vehicles need tougher cable systems because longer operating hours create heat and vibration stress. Better sealing helps protect cable connections during heavy daily use.
Insights into E-Axle Power Cable and Connector Systems Market by Sales Channel
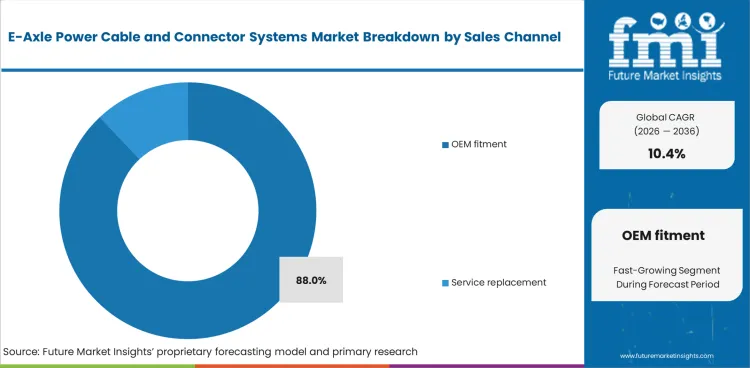
- OEM fitment is forecast to hold 88.0% share in 2026. Cable routing and connector access must be approved before vehicle safety checks are completed.
- Service replacement demand is likely to increase as EV fleets age. Repairs will need trained staff because high-voltage cable work requires safe isolation checks.
Insights into E-Axle Power Cable and Connector Systems Market by Conductor Material
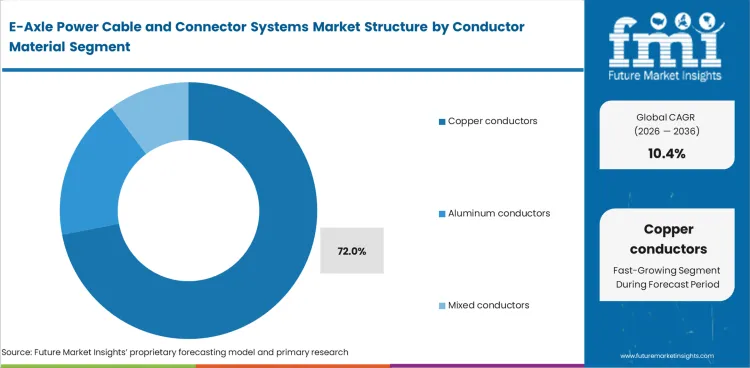
- Copper conductors are anticipated to account for 72.0% share in 2026. Copper supports steady current handling and reliable termination quality in e-axle cables.
- Aluminum conductors can support weight reduction in selected EV platforms. Adoption will depend on joining quality and long-term durability in high-load drive paths.
E-Axle Power Cable and Connector Systems Market Drivers, Restraints, and Opportunities
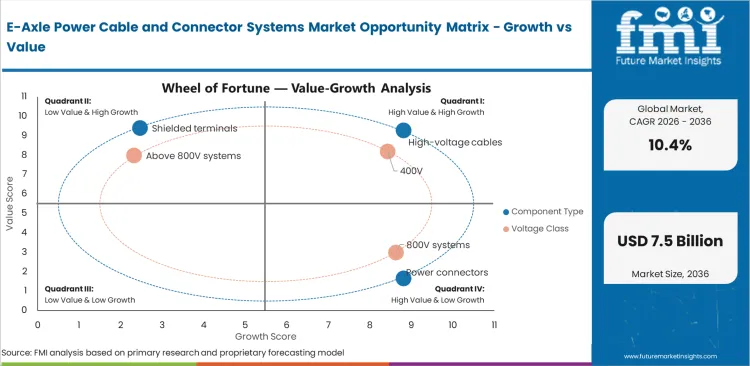
- Compact e-axle packaging is increasing demand for short and heat-resistant power cable routes.
- High-voltage validation cost can slow supplier entry because connectors must pass vibration and sealing checks.
- 800V drivetrain programs create opportunities for suppliers with deeper insulation design and e-axle routing support.
Compact E-Drive Packaging
E-axle integration places the motor and inverter close to the axle. This creates tight space for cable routing. Power cables must bend safely and maintain shielding near switching electronics. Compact connector housings and repeatable cable termination support safer e-axle power routing.
Qualification Cost Barrier
Connector and cable suppliers face long approval cycles before they can secure vehicle programs. Automakers need proof that high-voltage connectors can handle sealing and vibration checks. Smaller suppliers need test data because e-axle power paths operate under heat and underbody exposure.
800V Platform OpportunityHigher-voltage EV platforms create better value for cable specialists. Faster charging raises the need for stronger insulation and stable terminal heat control. E-axle inverter systems need matched power interfaces that work safely in compact layouts. Connector makers can gain more value when they support validated power routing design.
Analysis of E-Axle Power Cable and Connector Systems Market by Key Countries
.webp "Top Country Growth Comparison E Axle Power Cable And Connector Systems Market Cagr (2026 2036)")
| Country | CAGR |
|---|---|
| United States | 9.6% |
| China | 12.4% |
| India | 13.5% |
| Germany | 8.4% |
| Japan | 7.8% |
| South Korea | 9.2% |
| United Kingdom | 8.7% |
Source: Future Market Insights, 2026.
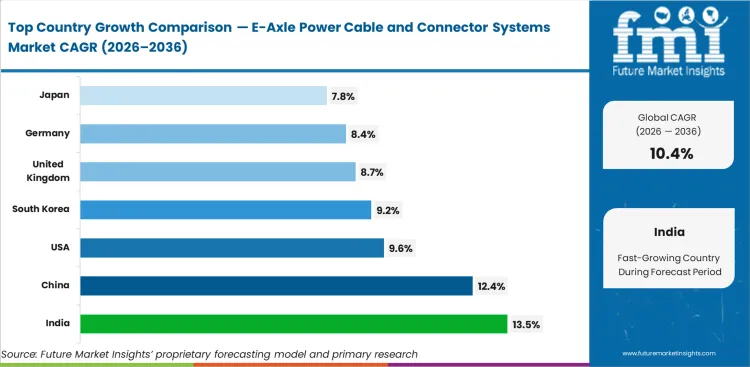
E-Axle Power Cable and Connector Systems Market CAGR Analysis by Country
- India is projected to expand at 13.5% CAGR through 2036 as local EV assembly increases demand for high-voltage cable systems.
- China is forecast to register 12.4% CAGR between 2026 and 2036 with large EV production keeping cable and connector programs tied to frequent model launches.
- The United States market is expected to record 9.6% CAGR during the forecast period as domestic EV assembly supports demand for validated connector systems.
- Adoption in South Korea is anticipated to move ahead at 9.2% CAGR during the same period as auto parts suppliers support high-voltage component demand.
- The industry outlook in the United Kingdom points to 8.7% CAGR through 2036 led by zero-emission vehicle rules keeping OEM sourcing focused on e-drive wiring readiness.
- Germany is likely to post 8.4% CAGR by 2036 as premium EV platforms require compact routing and stricter safety checks.
- Japan is forecast to rise at 7.8% CAGR by 2036 with electrified vehicle target supporting proven cable and connector designs.
- Global e-axle power cable and connector systems demand is forecast to advance at 10.4% CAGR during the forecast period.
Demand Outlook for E-Axle Power Cable and Connector Systems Market in the United States
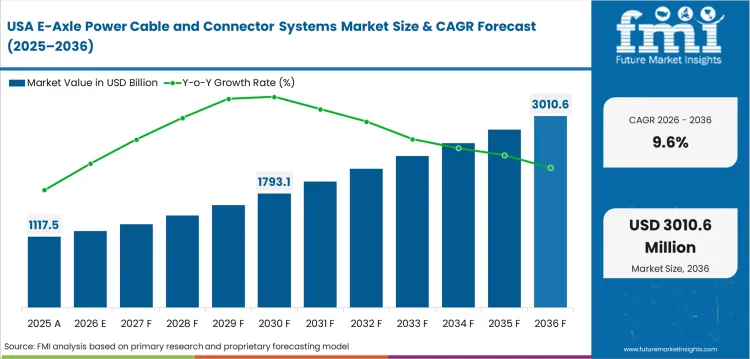
The United States market is forecast to move at 9.6% CAGR through 2036. Domestic EV assembly keeps demand active for tested power cable systems. Vehicle teams need safe routes between battery packs and compact drive units before launch. Argonne reported about 1.5 million plug-in EV sales in 2025, which supports a growing installed base of vehicles requiring high‑voltage cable and connector systems.
- Local battery investment supports nearby sourcing for high-voltage cable assemblies.
- Commercial fleet electrification raises demand for stronger connector locks.
- Cable routing checks help reduce safety risks before production starts.
Sales Analysis of E-Axle Power Cable and Connector Systems Market in China
China is the main volume center for e-axle cable demand. Official data from China reported 16.626 million new energy vehicle production units and 16.49 million new energy vehicle sales in 2025. This scale supports a 12.4% CAGR forecast through 2036 because suppliers receive repeat platform work from frequent EV launches. Cost pressure stays high, so process control is important for cable cutting and crimping.
- Mass EV production supports repeat cable assembly orders.
- Domestic e-drive supply favors connector makers that support quick design checks.
- Compact EV platforms need cable systems that protect power flow near signal paths.
Demand Outlook for E-Axle Power Cable and Connector Systems Market in India
India is likely to advance at 13.5% CAGR through 2036. Local EV manufacturing is moving deeper into high-voltage parts and wiring systems. Invest India says domestic EV production now spans battery packs and wiring harnesses, with drivetrain parts gaining local depth which creates space for local cable assemblies that reduce import dependence.
- Local harness assembly supports price-sensitive EV platforms.
- HVIL wiring components gain value as safer circuit checks become common.
- Electric three-wheelers need sealed connectors that can handle rough road use.
Opportunity Analysis of E-Axle Power Cable and Connector Systems Market in Germany
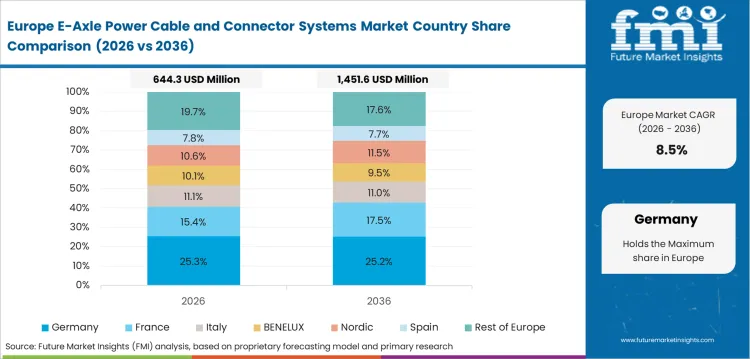
Germany is important for premium EV programs and strict engineering checks. ACEA data showed German battery electric car registrations rose 43.2% in 2025. Germany is likely to post 8.4% CAGR in the market by 2036 as high-performance EV platforms need compact power routing. Suppliers with tested insulation quality can support higher-voltage vehicle programs.
- Premium EV platforms need compact connector layouts.
- Supplier approval depends on sealing and thermal cycling proof.
- Material records help cable makers meet safety checks.
Sales Analysis of E-Axle Power Cable and Connector Systems Market in Japan
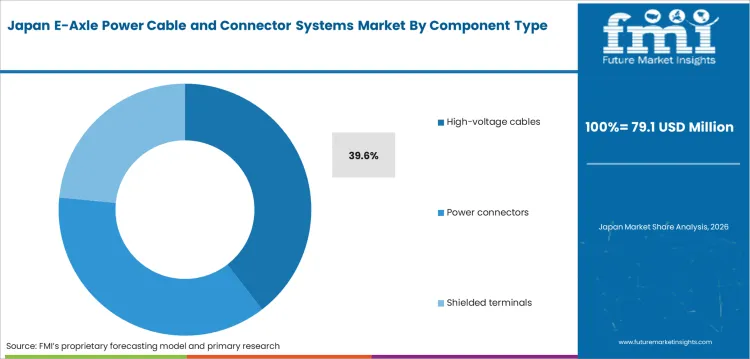
E-axle power cable and connector systems industry in Japan is shaped by careful validation and long platform approval cycles. The country aims for all new passenger vehicle sales to be electrified by 2035. Cable suppliers need stable quality records because Japanese OEMs prefer proven designs. Japan is forecast to move at 7.8% CAGR through 2036. Long approval cycles make tested cable quality important.
- Hybrid and EV programs need safe power transfer.
- Compact car platforms need lighter connector layouts with reliable sealing.
- Signal protection gains value near high-voltage power paths.
Future Outlook for E-Axle Power Cable and Connector Systems Market in South Korea
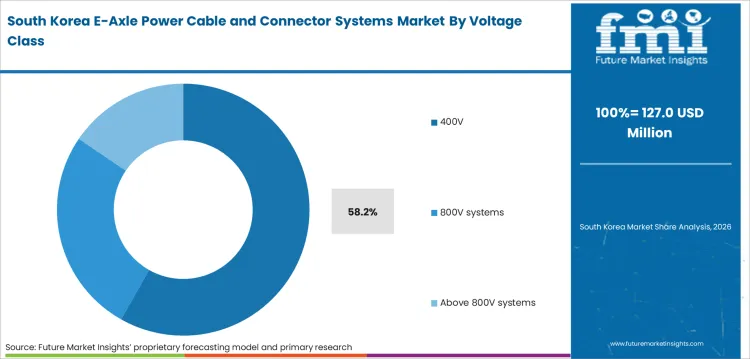
South Korea combines EV export supply with auto parts strength. The industry is expected to grow at 9.2% CAGR forecast through 2036 reflects demand for validated high-voltage components. Official South Korean policy communication for 2026 points to higher mobility finance and passenger EV subsidy support, keeping local suppliers focused on export-ready connector quality.
- Battery and vehicle export depth supports validated cable assemblies.
- Auto parts suppliers need local testing capability.
- Durable connector systems support EV platforms built for overseas markets.
Future Outlook for E-Axle Power Cable and Connector Systems Market in the United Kingdom
The United Kingdom market points to 8.7% CAGR through 2036. Zero-emission vehicle rules are shaping demand for safer EV power routing. GOV.UK data showed 473,000 zero-emission cars were registered for the first time in 2025 which supports demand for cable systems that meet platform-level safety needs.
- Fleet and van electrification raises demand for sealed connectors.
- Engineering service providers can support cable routing checks.
- Qualification work gains value as zero-emission vehicle volumes rise.
Competitive Landscape and Strategic Positioning
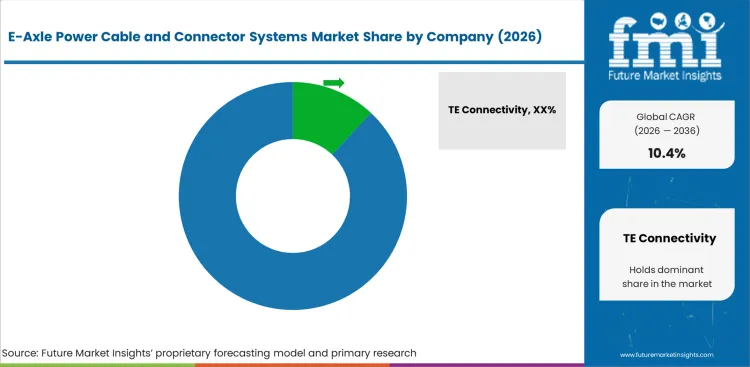
- Competition is centered on validated high-voltage cable assemblies and sealed power connector design.
- Cable suppliers compete through shielding quality and repeatable crimping.
- Connector specialists are anticipated to focus on adding power transfer with safety interlock support in their products.
- Entry barriers are high because automotive programs need qualification data and controlled termination processes.
Competition in the e‑axle power cable and connector systems market is centered on validated high‑voltage cable assemblies, sealed connector performance, and platform‑level engineering support. Suppliers compete primarily on their ability to meet automotive qualification standards for heat, vibration, and sealing, while supporting OEMs with reliable integration into compact e‑drive architectures.
Companies such as Aptiv are reshaping its electrical distribution focus. In January 2025, the company announced a plan to separate its Electrical Distribution Systems business. This move can influence e-axle cable assembly sourcing because automakers need suppliers with clear strength in vehicle wiring and high-voltage distribution. Suppliers without proven test data face a tougher entry to market. E-axle cable and connector systems must support heat control and sealing quality before automakers approve them for platform use.
Key Companies in the E-Axle Power Cable and Connector Systems Market
- High-Voltage Cable Specialists: Leoni AG and Yazaki Corporation compete through cable assembly scale. Sumitomo Electric Industries adds insulation know-how and high-voltage routing experience.
- Connector and Interface Suppliers: TE Connectivity and Amphenol Corporation hold positions through sealed connector design. Rosenberger Group adds HVIL interfaces and high-current terminal systems.
- Electrical Distribution Integrators: Aptiv competes through vehicle architecture knowledge and platform-level wiring integration.
Competitive Benchmarking: E-Axle Power Cable and Connector Systems Market
| Company | High-Voltage Cable Depth | Sealed Connector Breadth | E-Drive Validation Support | Geographic Footprint |
|---|---|---|---|---|
| TE Connectivity | High | High | High | Global with North American and European strength |
| Aptiv | High | Medium | High | Global with electrical distribution scale |
| Yazaki Corporation | High | Medium | Medium | Global with Asian strength |
| Sumitomo Electric Industries | High | Medium | Medium | Asia centered with global programs |
| Leoni AG | High | Medium | Medium | Europe centered with global wiring programs |
| Amphenol Corporation | Medium | High | Medium | Global industrial and automotive reach |
| Rosenberger Group | Medium | High | Medium | Europe centered with high-voltage connector depth |
Source: Future Market Insights competitive analysis, 2026.
Key Developments in E-Axle Power Cable and Connector Systems Market
- In October 2025, TE Connectivity launched an inside-device connectivity portfolio for automotive ECUs.
- In December 2025, Amphenol Industrial Operations introduced the TS1 Series high-voltage high-current power connector.
Key Players in the E-Axle Power Cable and Connector Systems Market
Major Global Players
- TE Connectivity
- Aptiv
- Yazaki Corporation
- Sumitomo Electric Industries
- Leoni AG
Specialist and Regional Players
- Amphenol Corporation
- Rosenberger Group
- Molex
- Huber+Suhner
Report Scope and Coverage
| Parameter | Details |
|---|---|
| Quantitative Units | USD 2.8 billion to USD 7.5 billion at 10.4% CAGR |
| Market Definition | High-voltage cable and connector systems used for e-axle traction power routing |
| Regions Covered | North America, Latin America, Western Europe, Eastern Europe, East Asia, South Asia and Pacific, Middle East and Africa |
| Countries Covered | United States, China, India, Germany, Japan, South Korea, United Kingdom and more than thirty countries |
| Key Companies Profiled | TE Connectivity, Aptiv, Yazaki Corporation, Sumitomo Electric Industries, Leoni AG, Amphenol Corporation, Rosenberger Group |
| Forecast Period | 2026 to 2036 |
| Approach | Hybrid bottom-up and top-down methodology using EV volumes, e-axle fitment and supplier activity |
Source: Future Market Insights, 2026.
E-Axle Power Cable and Connector Systems Market Breakdown by Component Type, Voltage Class, Vehicle Type, Sales Channel, Conductor Material, and Region
E-Axle Power Cable and Connector Systems Market Segmented by Component Type
- High-voltage cables
- Power connectors
- Shielded terminals
- HVIL leads
E-Axle Power Cable and Connector Systems Market Segmented by Voltage Class
- 400V systems
- 800V systems
- Above 800V systems
E-Axle Power Cable and Connector Systems Market Segmented by Vehicle Type
- Battery electric vehicles
- Plug-in hybrids
- Electric commercial vehicles
E-Axle Power Cable and Connector Systems Market Segmented by Sales Channel
- OEM fitment
- Service replacement
E-Axle Power Cable and Connector Systems Market Segmented by Conductor Material
- Copper conductors
- Aluminum conductors
- Mixed conductors
E-Axle Power Cable and Connector Systems Market by Region
- North America
- United States
- Canada
- Mexico
- Latin America
- Brazil
- Chile
- Rest of Latin America
- Western Europe
- Germany
- United Kingdom
- Italy
- Spain
- France
- Nordic
- BENELUX
- Rest of Western Europe
- Eastern Europe
- Poland
- Hungary
- Balkan and Baltic
- Rest of Eastern Europe
- East Asia
- China
- Japan
- South Korea
- South Asia and Pacific
- India
- ASEAN
- Australia and New Zealand
- Rest of South Asia and Pacific
- Middle East and Africa
- Kingdom of Saudi Arabia
- Other GCC Countries
- Turkiye
- South Africa
- Rest of Middle East and Africa
Research Sources and Bibliography
- National Highway Traffic Safety Administration. (2024, December 20). Federal motor vehicle safety standards; FMVSS No. 305a electric-powered vehicles: Electric powertrain integrity. Federal Register.
- Amphenol PCD Shenzhen. (2024, August 30). EXCEL|MATE HVSL Series product introduction. Amphenol PCD Shenzhen.
- Google Patents. (2024, December 5). High voltage connector thermal crash and vibration shield (WO2024248919A1). Google Patents.
- International Energy Agency. (2026). Technology: Electric vehicles. International Energy Agency.
- State Council of the People’s Republic of China. (2026, January 14). China’s auto output, sales reach new highs in 2025. State Council of the People’s Republic of China.
- Molex. (2024, May 7). Molex combines high-speed data, signal and power in MX-DaSH Data-Signal Hybrid Connector Portfolio to optimize next-gen automotive architectures. Molex.
- Argonne National Laboratory. (2026, May 15). Light duty electric drive vehicles monthly sales updates. Argonne National Laboratory.
- Invest India. (2025, December 12). Inside India’s EV manufacturing ecosystem: Key investment trends, government policies, and market outlook. Invest India.
- European Automobile Manufacturers’ Association. (2026, January 27). New car registrations: +1.8% in 2025; battery-electric 17.4% market share. ACEA.
- Agency for Natural Resources and Energy, Ministry of Economy, Trade and Industry. (2024, June 24). Subsidies upgraded for the purchase of clean energy vehicles: Consider purchasing clean energy vehicles by taking advantage of subsidies. Ministry of Economy, Trade and Industry.
- Department for Transport. (2026, April 29). Vehicle licensing statistics, United Kingdom: 2025. GOV.UK.
- Office for Government Policy Coordination. (2025, November 14). K-mobility innovation: More than KRW 15 trillion in policy finance to be supplied next year. Korea.kr.
- Aptiv. (2025, January 22). Aptiv announces intention to separate its Electrical Distribution Systems business. Aptiv.
- TE Connectivity. (2025, October 2). TE Connectivity launches new product portfolio for automotive ECUs to accelerate SDV and E/E architectural transformation. TE Connectivity.
- Amphenol Industrial Operations. (2025, December 17). TS1 Series | high voltage high current power connector. Amphenol Industrial Operations.
This Report Answers
- What is the current value of the e-axle power cable and connector systems market?
- What value is the industry expected to reach by 2036?
- Which component type is anticipated to hold the leading share in 2026?
- Why does OEM fitment represent a high share of sales channel demand?
- Which countries are forecast to move ahead faster during the assessment period?
- How do 400V and 800V platforms affect cable and connector requirements?
- Which companies compete in high-voltage e-axle cable and connector systems?
- How do shielding, sealing and HVIL requirements shape supplier selection?
- What method is used to size and forecast the market?
Frequently Asked Questions
What was the value of the e-axle power cable and connector systems market in 2025?
The market was valued at USD 2.5 billion in 2025, based on EV volumes and average high-voltage cable assembly content.
What is the expected market value by 2036?
Demand is expected to reach USD 7.5 billion by 2036 as EV platform volumes and high-voltage drivetrain content increase.
What CAGR is expected from 2026 to 2036?
The market is forecast to expand at 10.4% CAGR during the assessment period due to EV powertrain localization and higher voltage architectures.
Which component type is expected to hold a leading share?
High-voltage cables are anticipated to hold 41.0% share in 2026 as every e-axle needs shielded power transfer between inverter and drive unit.
Which voltage class has broader adoption in 2026?
400V systems are expected to account for 56.0% share in 2026 as many mass EV platforms use established battery and inverter layouts.
Why does OEM fitment hold a high share?
OEM fitment is anticipated to represent 88.0% share in 2026 as cable routing and connector placement must be approved before platform launch.
Which country is expected to move ahead faster?
India is likely to expand at 13.5% CAGR through 2036 as EV incentives and local assembly programs deepen demand for high-voltage cable systems.
Which companies are covered in the competitive analysis?
TE Connectivity, Aptiv, Yazaki Corporation, Sumitomo Electric Industries, Leoni AG, Amphenol Corporation and Rosenberger Group are covered as active suppliers.
How does the report define the market?
The report covers high-voltage cable and connector systems used for e-axle traction power routing in electric vehicles and plug-in hybrid platforms.
How does the report handle regional demand?
The study reviews North America, Europe, East Asia and South Asia through country-level EV activity and platform localization needs.
Preview the report firsthand - request a free sample
Get SampleGet the brochure for pricing and purchase details.
Get PDFTable of Content
- Key Takeaways
- Market Size and CAGR
- Top Growth Driver
- Fastest Growing Segment
- Leading Region
- Key Companies
- Emerging Opportunities
- Executive Summary
- Global Market Outlook
- Demand-side Trends
- Supply-side Trends
- Technology Roadmap Analysis
- Analysis and Recommendations
- Analyst Perspective (What is happening? Why now? What should investors know?)
- Key Questions Answered
- How large is the market?
- What is the CAGR?
- What are key trends?
- Which region dominates?
- Who are the leaders?
- Market Overview
- Market Coverage / Taxonomy
- Market Definition / Scope / Limitations
- Research Methodology
- Chapter Orientation
- Analytical Lens and Working Hypotheses
- Market Structure, Signals, and Trend Drivers
- Benchmarking and Cross-market Comparability
- Market Sizing, Forecasting, and Opportunity Mapping
- Research Design and Evidence Framework
- Desk Research Programme (Secondary Evidence)
- Expert Input and Fieldwork (Primary Evidence)
- Tooling, Models, and Reference Databases
- Data Engineering and Model Build
- Quality Assurance and Audit Trail
- Market Background
- Market Dynamics (Drivers, Restraints, Opportunity, Trends)
- Scenario Forecast (Optimistic, Likely, Conservative)
- Impact Analysis
- AI Impact
- Sustainability Impact
- Regulatory Impact
- Technology Impact
- Consumer / Buyer Analysis
- Purchase Drivers
- Adoption Barriers
- Buyer Journey
- Opportunity Map Analysis
- Product Life Cycle Analysis
- Supply Chain Analysis
- Investment Feasibility Matrix
- Value Chain Analysis
- PESTLE and Porter's Analysis
- Regulatory Landscape
- Regional Parent Market Outlook
- Production and Consumption Statistics
- Import and Export Statistics
- Global Market Analysis and Forecast, 2021 to 2036
- Historical Market Size Value (USD Billion) & Volume (Unit) Analysis, 2021 to 2025
- Current and Future Market Size Value (USD Billion) & Volume (Unit) Projections, 2026 to 2036
- Y-o-Y Growth Trend Analysis
- Absolute $ Opportunity Analysis
- Global Market Pricing Analysis, 2021 to 2036
- Global Market Analysis and Forecast, By Component Type, 2021 to 2036
- Introduction / Key Findings
- Historical Market Size Value (USD Billion) & Volume (Unit) Analysis By Component Type, 2021 to 2025
- Current and Future Market Size Value (USD Billion) & Volume (Unit) Analysis and Forecast By Component Type, 2026 to 2036
- High-voltage cables
- Power connectors
- Shielded terminals
- HVIL leads
- High-voltage cables
- Y-o-Y Growth Trend Analysis By Component Type, 2021 to 2025
- Absolute $ Opportunity Analysis By Component Type, 2026 to 2036
- Global Market Analysis and Forecast, By Voltage Class, 2021 to 2036
- Introduction / Key Findings
- Historical Market Size Value (USD Billion) & Volume (Unit) Analysis By Voltage Class, 2021 to 2025
- Current and Future Market Size Value (USD Billion) & Volume (Unit) Analysis and Forecast By Voltage Class, 2026 to 2036
- 400V systems
- 800V systems
- Above 800V systems
- 400V systems
- Y-o-Y Growth Trend Analysis By Voltage Class, 2021 to 2025
- Absolute $ Opportunity Analysis By Voltage Class, 2026 to 2036
- Global Market Analysis and Forecast, By Vehicle Type, 2021 to 2036
- Introduction / Key Findings
- Historical Market Size Value (USD Billion) & Volume (Unit) Analysis By Vehicle Type, 2021 to 2025
- Current and Future Market Size Value (USD Billion) & Volume (Unit) Analysis and Forecast By Vehicle Type, 2026 to 2036
- Battery electric vehicles
- Plug-in hybrids
- Electric commercial vehicles
- Battery electric vehicles
- Y-o-Y Growth Trend Analysis By Vehicle Type, 2021 to 2025
- Absolute $ Opportunity Analysis By Vehicle Type, 2026 to 2036
- Global Market Analysis and Forecast, By Sales Channel, 2021 to 2036
- Introduction / Key Findings
- Historical Market Size Value (USD Billion) & Volume (Unit) Analysis By Sales Channel, 2021 to 2025
- Current and Future Market Size Value (USD Billion) & Volume (Unit) Analysis and Forecast By Sales Channel, 2026 to 2036
- OEM fitment
- Service replacement
- OEM fitment
- Y-o-Y Growth Trend Analysis By Sales Channel, 2021 to 2025
- Absolute $ Opportunity Analysis By Sales Channel, 2026 to 2036
- Global Market Analysis and Forecast, By Conductor Material, 2021 to 2036
- Introduction / Key Findings
- Historical Market Size Value (USD Billion) & Volume (Unit) Analysis By Conductor Material, 2021 to 2025
- Current and Future Market Size Value (USD Billion) & Volume (Unit) Analysis and Forecast By Conductor Material, 2026 to 2036
- Copper conductors
- Aluminum conductors
- Mixed conductors
- Copper conductors
- Y-o-Y Growth Trend Analysis By Conductor Material, 2021 to 2025
- Absolute $ Opportunity Analysis By Conductor Material, 2026 to 2036
- Global Market Analysis and Forecast, By Region, 2021 to 2036
- Introduction
- Historical Market Size Value (USD Billion) & Volume (Unit) Analysis By Region, 2021 to 2025
- Current Market Size Value (USD Billion) & Volume (Unit) Analysis and Forecast By Region, 2026 to 2036
- North America
- Latin America
- Western Europe
- Eastern Europe
- East Asia
- South Asia and Pacific
- Middle East & Africa
- Market Attractiveness Analysis By Region
- North America Market Analysis and Forecast, By Country, 2021 to 2036
- Historical Market Size Value (USD Billion) & Volume (Unit) Trend Analysis By Market Taxonomy, 2021 to 2025
- Market Size Value (USD Billion) & Volume (Unit) Forecast By Market Taxonomy, 2026 to 2036
- By Country
- USA
- Canada
- Mexico
- By Component Type
- By Voltage Class
- By Vehicle Type
- By Sales Channel
- By Conductor Material
- By Country
- Market Attractiveness Analysis
- By Country
- By Component Type
- By Voltage Class
- By Vehicle Type
- By Sales Channel
- By Conductor Material
- Key Takeaways
- Latin America Market Analysis and Forecast, By Country
- Historical Market Size Value (USD Billion) & Volume (Unit) Trend Analysis By Market Taxonomy, 2021 to 2025
- Market Size Value (USD Billion) & Volume (Unit) Forecast By Market Taxonomy, 2026 to 2036
- By Country
- Brazil
- Chile
- Rest of Latin America
- By Component Type
- By Voltage Class
- By Vehicle Type
- By Sales Channel
- By Conductor Material
- By Country
- Market Attractiveness Analysis
- By Country
- By Component Type
- By Voltage Class
- By Vehicle Type
- By Sales Channel
- By Conductor Material
- Key Takeaways
- Western Europe Market Analysis and Forecast, By Country
- Historical Market Size Value (USD Billion) & Volume (Unit) Trend Analysis By Market Taxonomy, 2021 to 2025
- Market Size Value (USD Billion) & Volume (Unit) Forecast By Market Taxonomy, 2026 to 2036
- By Country
- Germany
- UK
- Italy
- Spain
- France
- Nordic
- BENELUX
- Rest of Western Europe
- By Component Type
- By Voltage Class
- By Vehicle Type
- By Sales Channel
- By Conductor Material
- By Country
- Market Attractiveness Analysis
- By Country
- By Component Type
- By Voltage Class
- By Vehicle Type
- By Sales Channel
- By Conductor Material
- Key Takeaways
- Eastern Europe Market Analysis and Forecast, By Country
- Historical Market Size Value (USD Billion) & Volume (Unit) Trend Analysis By Market Taxonomy, 2021 to 2025
- Market Size Value (USD Billion) & Volume (Unit) Forecast By Market Taxonomy, 2026 to 2036
- By Country
- Russia
- Poland
- Hungary
- Balkan & Baltic
- Rest of Eastern Europe
- By Component Type
- By Voltage Class
- By Vehicle Type
- By Sales Channel
- By Conductor Material
- By Country
- Market Attractiveness Analysis
- By Country
- By Component Type
- By Voltage Class
- By Vehicle Type
- By Sales Channel
- By Conductor Material
- Key Takeaways
- East Asia Market Analysis and Forecast, By Country
- Historical Market Size Value (USD Billion) & Volume (Unit) Trend Analysis By Market Taxonomy, 2021 to 2025
- Market Size Value (USD Billion) & Volume (Unit) Forecast By Market Taxonomy, 2026 to 2036
- By Country
- China
- Japan
- South Korea
- By Component Type
- By Voltage Class
- By Vehicle Type
- By Sales Channel
- By Conductor Material
- By Country
- Market Attractiveness Analysis
- By Country
- By Component Type
- By Voltage Class
- By Vehicle Type
- By Sales Channel
- By Conductor Material
- Key Takeaways
- South Asia and Pacific Market Analysis and Forecast, By Country
- Historical Market Size Value (USD Billion) & Volume (Unit) Trend Analysis By Market Taxonomy, 2021 to 2025
- Market Size Value (USD Billion) & Volume (Unit) Forecast By Market Taxonomy, 2026 to 2036
- By Country
- India
- ASEAN
- Australia & New Zealand
- Rest of South Asia and Pacific
- By Component Type
- By Voltage Class
- By Vehicle Type
- By Sales Channel
- By Conductor Material
- By Country
- Market Attractiveness Analysis
- By Country
- By Component Type
- By Voltage Class
- By Vehicle Type
- By Sales Channel
- By Conductor Material
- Key Takeaways
- Middle East & Africa Market Analysis and Forecast, By Country
- Historical Market Size Value (USD Billion) & Volume (Unit) Trend Analysis By Market Taxonomy, 2021 to 2025
- Market Size Value (USD Billion) & Volume (Unit) Forecast By Market Taxonomy, 2026 to 2036
- By Country
- Kingdom of Saudi Arabia
- Other GCC Countries
- Türkiye
- South Africa
- Other African Union
- Rest of Middle East & Africa
- By Component Type
- By Voltage Class
- By Vehicle Type
- By Sales Channel
- By Conductor Material
- By Country
- Market Attractiveness Analysis
- By Country
- By Component Type
- By Voltage Class
- By Vehicle Type
- By Sales Channel
- By Conductor Material
- Key Takeaways
- Key Countries Market Analysis
- USA
- Pricing Analysis
- Market Share Analysis, 2025
- By Component Type
- By Voltage Class
- By Vehicle Type
- By Sales Channel
- By Conductor Material
- Canada
- Pricing Analysis
- Market Share Analysis, 2025
- By Component Type
- By Voltage Class
- By Vehicle Type
- By Sales Channel
- By Conductor Material
- Mexico
- Pricing Analysis
- Market Share Analysis, 2025
- By Component Type
- By Voltage Class
- By Vehicle Type
- By Sales Channel
- By Conductor Material
- Brazil
- Pricing Analysis
- Market Share Analysis, 2025
- By Component Type
- By Voltage Class
- By Vehicle Type
- By Sales Channel
- By Conductor Material
- Chile
- Pricing Analysis
- Market Share Analysis, 2025
- By Component Type
- By Voltage Class
- By Vehicle Type
- By Sales Channel
- By Conductor Material
- Germany
- Pricing Analysis
- Market Share Analysis, 2025
- By Component Type
- By Voltage Class
- By Vehicle Type
- By Sales Channel
- By Conductor Material
- UK
- Pricing Analysis
- Market Share Analysis, 2025
- By Component Type
- By Voltage Class
- By Vehicle Type
- By Sales Channel
- By Conductor Material
- Italy
- Pricing Analysis
- Market Share Analysis, 2025
- By Component Type
- By Voltage Class
- By Vehicle Type
- By Sales Channel
- By Conductor Material
- Spain
- Pricing Analysis
- Market Share Analysis, 2025
- By Component Type
- By Voltage Class
- By Vehicle Type
- By Sales Channel
- By Conductor Material
- France
- Pricing Analysis
- Market Share Analysis, 2025
- By Component Type
- By Voltage Class
- By Vehicle Type
- By Sales Channel
- By Conductor Material
- India
- Pricing Analysis
- Market Share Analysis, 2025
- By Component Type
- By Voltage Class
- By Vehicle Type
- By Sales Channel
- By Conductor Material
- ASEAN
- Pricing Analysis
- Market Share Analysis, 2025
- By Component Type
- By Voltage Class
- By Vehicle Type
- By Sales Channel
- By Conductor Material
- Australia & New Zealand
- Pricing Analysis
- Market Share Analysis, 2025
- By Component Type
- By Voltage Class
- By Vehicle Type
- By Sales Channel
- By Conductor Material
- China
- Pricing Analysis
- Market Share Analysis, 2025
- By Component Type
- By Voltage Class
- By Vehicle Type
- By Sales Channel
- By Conductor Material
- Japan
- Pricing Analysis
- Market Share Analysis, 2025
- By Component Type
- By Voltage Class
- By Vehicle Type
- By Sales Channel
- By Conductor Material
- South Korea
- Pricing Analysis
- Market Share Analysis, 2025
- By Component Type
- By Voltage Class
- By Vehicle Type
- By Sales Channel
- By Conductor Material
- Russia
- Pricing Analysis
- Market Share Analysis, 2025
- By Component Type
- By Voltage Class
- By Vehicle Type
- By Sales Channel
- By Conductor Material
- Poland
- Pricing Analysis
- Market Share Analysis, 2025
- By Component Type
- By Voltage Class
- By Vehicle Type
- By Sales Channel
- By Conductor Material
- Hungary
- Pricing Analysis
- Market Share Analysis, 2025
- By Component Type
- By Voltage Class
- By Vehicle Type
- By Sales Channel
- By Conductor Material
- Kingdom of Saudi Arabia
- Pricing Analysis
- Market Share Analysis, 2025
- By Component Type
- By Voltage Class
- By Vehicle Type
- By Sales Channel
- By Conductor Material
- Türkiye
- Pricing Analysis
- Market Share Analysis, 2025
- By Component Type
- By Voltage Class
- By Vehicle Type
- By Sales Channel
- By Conductor Material
- South Africa
- Pricing Analysis
- Market Share Analysis, 2025
- By Component Type
- By Voltage Class
- By Vehicle Type
- By Sales Channel
- By Conductor Material
- USA
- Market Structure Analysis
- Competition Dashboard
- Competition Benchmarking
- Market Share Analysis of Top Players
- By Regional
- By Component Type
- By Voltage Class
- By Vehicle Type
- By Sales Channel
- By Conductor Material
- Emerging Startups
- Innovation Benchmarking
- Competition Analysis
- Competition Deep Dive
- TE Connectivity
- Overview
- Product Portfolio
- Profitability by Market Segments (Product/Region/Sales Channel)
- Sales Footprint
- Strategy Overview
- Marketing Strategy
- Product Strategy
- Channel Strategy
- Aptiv
- Yazaki Corporation
- Sumitomo Electric Industries
- Leoni AG
- Amphenol Corporation
- Rosenberger Group
- Molex
- Huber+Suhner
- TE Connectivity
- Case Studies
- Success Stories
- Recent Developments
- Competition Deep Dive
- Assumptions & Acronyms Used


