

- Market Size (2026)
- USD 2860.6 Mn
- Forecast (2036)
- USD 5841.2 Mn
- CAGR (2026 to 2036)
- 7.4%
How big is the Electronic Chart Safety System Market in 2026?
USD 2,860.6 million in 2026 and USD 5,841.2 million by 2036 at a 7.4% CAGR.
The electronic chart safety system demand is shifting from chart display hardware toward bridge workflow control. Shipowners assess route planning and officer workload during navigation system selection. International Hydrographic Organization reported that Phase 1 S-100 product specifications entered into force in January 2026, covering S-101 electronic navigational charts and S-128 catalogue information.
S-100 transition planning adds another demand layer for ECDIS and chart service suppliers. Bridge teams need systems supporting current S-57 use while preparing for richer S-100 chart layers. ClassNK guidance states that ECDIS installed after 1 January 2029 must comply with MSC.530(106) Rev. 1 and IEC 61174 Edition 5.0, signaling a defined retrofit and system-readiness window.
Buyers compare electronic chart safety systems through route appraisal tools and service continuity. Coast Guard guidance issued in August 2025 clarified 3 equivalencies covering electronic charts and ENC-derived paper charts, giving domestic operators clearer inspection support for electronic chart use. Commercial decisions therefore rest on proof that bridge systems can manage compliance and voyage evidence together.
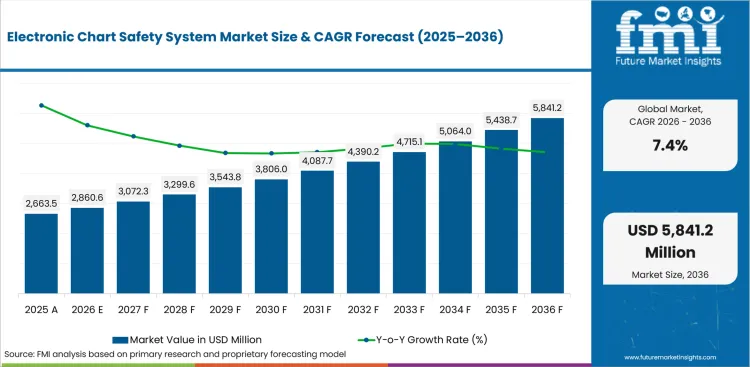
| Metric | Value |
|---|---|
| 2025 Market Size | USD 2,663.5 million |
| 2026 Market Size | USD 2,860.6 million |
| 2036 Market Size | USD 5,841.2 million |
| Forecast CAGR (2026-2036) | 7.4% |
| Vessel Type Focus | Commercial Ships |
| Commercial Ships Share (2026) | 62.0% |
| System Type Focus | ECDIS |
| ECDIS Share (2026) | 46.5% |
| Deployment Focus | Retrofit / Upgrade |
| Retrofit / Upgrade Share (2026) | 44.0% |
| Fastest-growing Country | China |
| China CAGR by 2036 | 8.5% |
Summary of the Electronic Chart Safety System Market
| Market Signal | Commercial Impact |
|---|---|
| Demand and Growth Drivers | Demand for electronic chart safety systems is increasing as vessel operators prepare bridge systems for S-100 data and route planning evidence.
|
| Product and Segment View | Segment demand is led by commercial ships and ECDIS systems requiring approved navigation performance and reliable chart service support.
|
| Geography and Growth Outlook | Regional demand is strongest across countries with port cargo activity and hydrographic transition planning.
|
| Competitive Landscape | Competition focuses on ECDIS approval and integration with bridge navigation systems.
|
| Analyst Perspective | Electronic chart safety systems are becoming a bridge workflow layer as vessel owners connect ECDIS and inspection evidence.
- Nikhil Kaitwade, Principal Consultant for Automotive at Future Market Insights |
How is the electronic chart safety system market segmented?
The electronic chart safety system industry is segmented by system type, vessel type, function, deployment, sales channel and region.
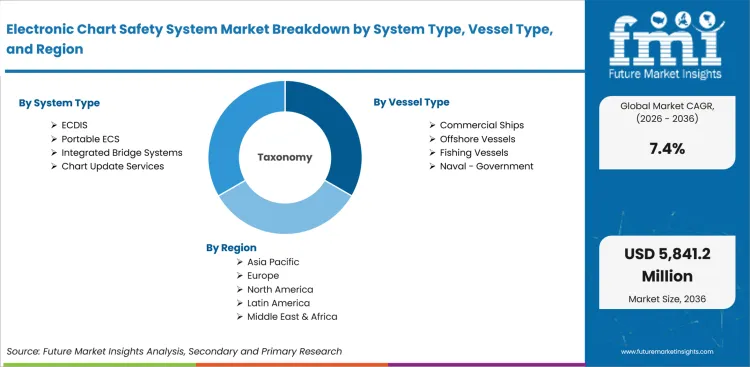
The electronic chart safety system market is segmented by system type, vessel type, function, deployment, sales channel and region. By system type, coverage includes ECDIS, Portable ECS, Integrated Bridge Systems and Chart Update Services. By vessel type, coverage includes Commercial Ships, Offshore Vessels, Fishing Vessels and Naval / Government. By function, coverage includes Route Planning, Collision / Grounding Avoidance, Regulatory Compliance and Fleet Monitoring. By deployment, coverage includes Newbuild, Retrofit / Upgrade and Subscription / Updates. By sales channel, coverage includes Direct OEM, Marine Electronics Dealers and Service Providers, with regional coverage across North America, Latin America, Western Europe, Eastern Europe, East Asia, South Asia and Pacific and Middle East and Africa.
Why does ECDIS lead within the system type segment?
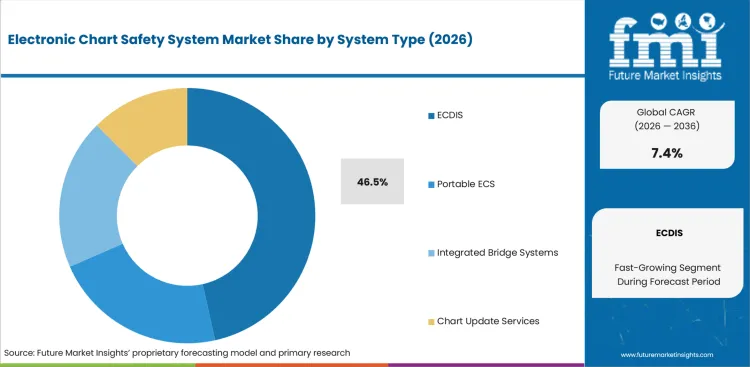
ECDIS leads through official ENC use and bridge compliance records. Commercial vessels use ECDIS for voyage appraisal and inspection proof. Raymarine Commercial reported that Pathfinder ECDIS is designed for commercial vessels over 3,000 gross tons and international passenger vessels over 500 gross tons, showing how vessel-class rules shape system design.
- ECDIS is expected to account for 46.5% share in 2026, backed by SOLAS-linked chart carriage and official ENC use. Buyers prefer approved systems that support route planning and backup rules without adding inspection uncertainty.
- Portable ECS remains useful for domestic vessels and smaller operators. ECDIS gains selection attention once fleet managers compare chart service links and officer training records during vessel audits.
What supports demand for commercial ships applications?
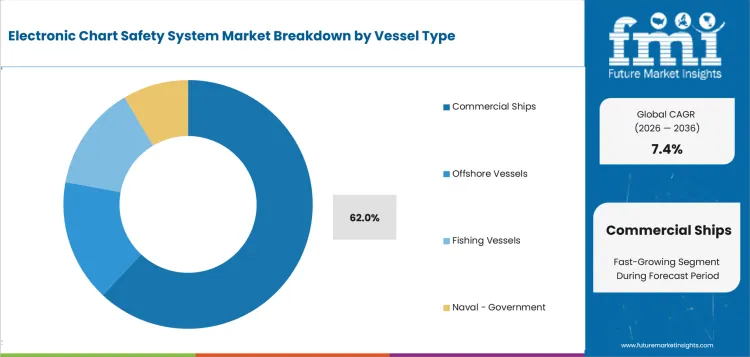
Commercial ships create the main demand pool for electronic chart safety systems. Merchant vessels need dependable route planning and compliance evidence across international operations. UNCTAD reported stating the world fleet reached 112,501 vessels and 2.44 billion dwt at the start of 2025, creating a large installed base for compliant bridge equipment.
- Commercial ships are anticipated to represent 62.0% share in 2026, led by merchant operators needing ECDIS and route appraisal support. Supplier approval improves once systems reduce crew workload and service interruptions.
- Offshore vessels need strong route planning and chart reliability around project sites. Commercial ships lead demand since global trading fleets operate under tighter inspection and chart carriage expectations.
How do route planning systems shape the function segment?
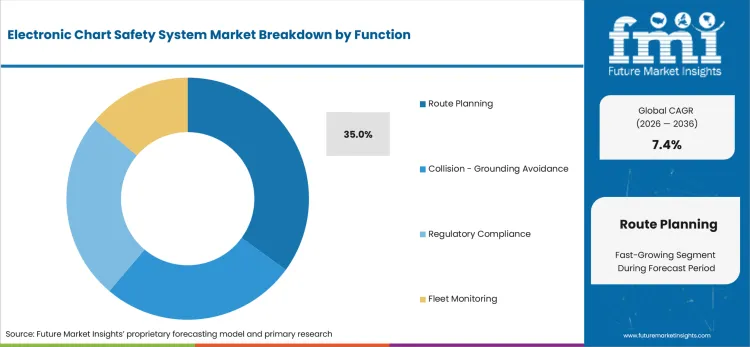
Route planning demand reflects a move from chart display toward navigational decision support. International Hydrographic Organization reported in March 2026 that S-100 connects charts and catalogues inside one navigation environment. Bridge teams therefore assess how systems manage chart layers before departure and during passage.
- Route planning is projected to represent 35.0% share in 2026, supported by officers using ECDIS for appraisal and passage plan checks. Better systems connect route safety checks with ENC updates before departure.
- Collision / grounding avoidance remains a key safety use. Route planning gains first selection attention since voyage preparation produces inspection records before vessel movement begins.
What market factors influence the retrofit / upgrade deployment route?
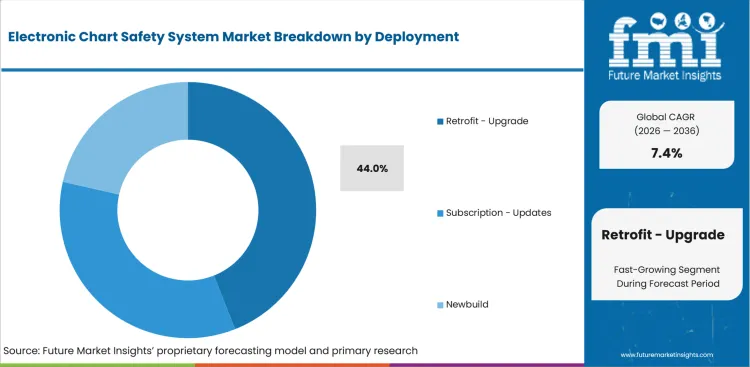
Retrofit / upgrade demand reflects installed bridge systems needing software readiness, cyber review and S-100 migration planning. Raymarine Commercial reported S-100 ready ECDIS simulation trials in May 2026, showing how suppliers are testing workflows before wider commercial transition. Vessel owners want upgradeable systems that protect current operation without forcing repeated bridge work.
- Retrofit / upgrade is set to secure 44.0% share in 2026, driven by older vessels needing chart service checks and interface updates. Planned bridge work reduces inspection risk compared with urgent replacement after non-compliance.
- Newbuild demand remains important through shipyard bridge packages. Retrofit demand holds a larger near-term role as existing vessels prepare for S-100 and revised ECDIS performance expectations.
How is direct OEM positioned within the sales-model segment?
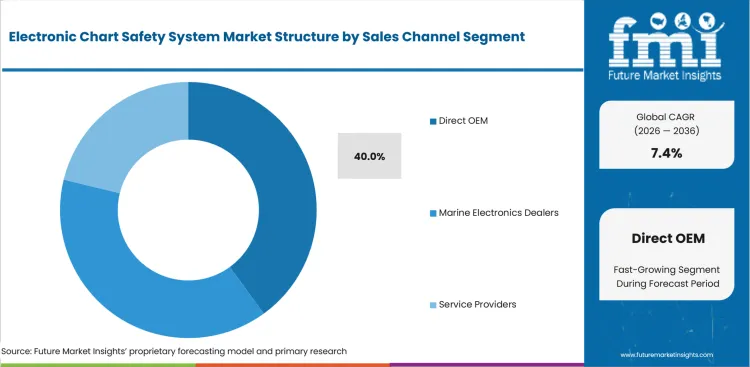
Direct OEM sourcing is central to electronic chart safety system buying since shipyards and bridge integrators specify navigation packages before vessel delivery. Buyers want accountability for ECDIS and training support. Teledyne SevenCs states that Nautilus SDK supports S-104 water levels and S-111 surface currents, showing why software kernels influence OEM selection.
- Direct OEM is expected to capture 40.0% share in 2026, backed by shipyards specifying bridge systems during vessel design. Suppliers gain commercial strength through commissioning support and type-aligned documentation.
- Marine electronics dealers remain useful for service work and smaller vessel upgrades. OEM channels lead newbuild packages once class review and installation records need one accountable supplier.
What are the drivers, restraints, and opportunities in the Electronic Chart Safety System Market?
Near-term purchases are shaped by chart equivalency guidance and retrofit timing outlined below.
- Driver: S-100 layer readiness increases system demand as bridge teams prepare for richer chart and warning information.
- Restraint: Cyber and retrofit approval burden can slow adoption as shipyards and system vendors add documentation before bridge installation.
- Opportunity: Chart service subscriptions create recurring revenue as fleets replace periodic media routines with managed update workflows.
S-100 readiness changes how operators judge chart safety systems. Navigation teams need data layers that improve passage planning without overloading bridge screens. UNCTADstat reported 12.1 billion metric tons of goods loaded worldwide in 2024, up 3.9% from 2023, which keeps route planning and chart service demand linked to international trade activity. Suppliers keeping S-57 and S-100 workflows clear can reduce training risk and support planned upgrades.
Approval complexity remains a practical restraint for smaller suppliers and retrofit buyers. IACS stated that revised UR E26 and UR E27 apply to new ships contracted for construction on and after 1 July 2024, while its member societies cover more than 90% of the world’s cargo-carrying tonnage. Bridge system vendors therefore need cyber-resilience documentation beside chart performance proof before buyer approval moves into installation planning.
S-100 transition creates a service opportunity before full replacement cycles accelerate. UKHO’s S-100 timeline guidance stated that type-approved S-100 ECDIS are estimated to be commercially available to purchase in 2028. Service providers can use the pre-purchase period for testing support and managed chart update workflows that prepare operators before mandatory retrofit decisions.
Which country CAGRs are profiled in the Electronic Chart Safety System Market?
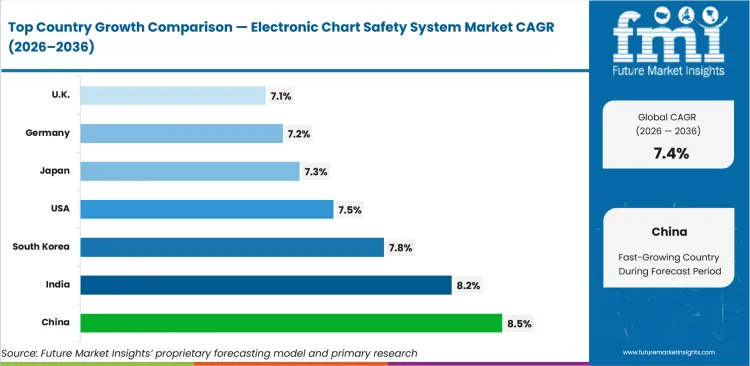
| Country | CAGR |
|---|---|
| China | 8.5% |
| India | 8.2% |
| South Korea | 7.8% |
| United States | 7.5% |
| Japan | 7.3% |
| Germany | 7.2% |
| United Kingdom | 7.1% |
| France | 6.9% |
Source: Future Market Insights analysis, 2026.
How do country-level CAGRs compare in the Electronic Chart Safety System Market?
Country CAGR profiles in the electronic chart safety system market reflect shipbuilding depth and S-100 transition readiness. China and India show stronger adoption led by newbuild channels and bridge modernization programs. South Korea and the United States form a mid-tier adoption band shaped by export vessel programs and electronic chart equivalency guidance. Japan and Germany show steadier uptake through fleet ownership and service-led navigation software demand. The United Kingdom and France reflect careful hydrographic transition cycles as operators prepare bridge teams for richer chart data and audit-ready voyage records.
- China’s demand outlook is anticipated to advance at 8.5% CAGR over the assessment period, supported by shipbuilding scale and fleet ownership depth. UNCTAD data updated in June 2025 placed Chinese-owned fleet capacity at 347 million dwt, giving ECDIS suppliers a large owner base for newbuild vessel installations and managed chart service contracts. Newbuild programs are expected to expand system demand across merchant fleets requiring route planning and chart update evidence. Raymarine Commercial along with Furuno and ChartWorld are positioned to gain account attention as shipyard delivery support and managed service coverage guide supplier selection.
- India is forecast to rise at 8.2% CAGR over the forecast period, attributable to port cargo expansion and maritime modernization. Press Information Bureau reported that major ports handled 915.17 million tonnes of cargo during FY 2025-26, which supports stronger route planning and chart update demand across coastal shipping and port approach movements. Vessel operators are expected to prioritize ECS and ECDIS tools reducing paper-heavy navigation processes. Service providers with local commissioning teams can secure stronger buyer interest among cargo vessels, workboats and smaller operators.
- South Korea is estimated to post 7.8% CAGR over the forecast period, reinforced by export newbuild programs and concentrated port traffic. Ministry of Oceans and Fisheries reported trade ports handled 31.73 million TEUs in 2024, up 5.3% from the prior year, helping bridge-system suppliers link ECDIS packages with container vessel activity and port approach safety needs. Shipyard-linked buyers are expected to seek navigation systems that combine commissioning, chart service continuity and officer training support. Kongsberg Maritime, Japan Radio Company and NAVTOR can benefit as export vessel programs require validated bridge equipment before delivery.
- By 2036, the United States is projected to grow at 7.5% CAGR through electronic chart equivalency guidance and domestic vessel compliance needs. Coast Guard guidance issued in August 2025 clarified 3 equivalencies covering electronic charts, allowing domestic vessel operators to move toward compliant ECS workflows with clearer inspection support. Workboat and coastal fleets are expected to use electronic chart systems to strengthen route records and reduce paper-heavy bridge procedures. Dealer-led vendors can gain through upgrade packages combining equipment and field service.
- In Japan, electronic chart safety system demand is predicted to scale at 7.3% CAGR over the forecast period through fleet ownership depth and structured supplier coordination. UNCTAD data updated in June 2025 placed Japanese-owned fleet capacity at 241 million dwt, creating a stable installed base for ECDIS service continuity and long-term route planning records. Fleet operators are expected to prioritize low-disruption implementation and dependable service documentation. Furuno and Japan Radio Company are positioned for evidence-led accounts valuing long-term bridge support and supplier accountability.
- Adoption in Germany is estimated to post 7.2% CAGR over the forecast period, underpinned by port density and bridge software expertise. Eurostat reported 115,012 vessel calls at German main EU ports during 2024, strengthening the need for update history and route planning evidence across repeated commercial vessel movements. Commercial fleet buyers are expected to require systems that align current ENC workflows with S-100 migration planning. Software-focused suppliers are predicted to receive stronger consideration once migration support reduces service gaps across multi-vessel operations.
- The United Kingdom outlook is projected to record 7.1% CAGR over the assessment period, driven by cargo vessel arrivals and hydrographic service planning. Department for Transport reported in December 2025 that 83,039 cargo vessels arrived at UK major ports during 2024, while major ports handled 421.0 million tonnes of freight and total UK port traffic reached 429.7 million tonnes, supporting demand for chart update services linked to busy port approach activity. UK buyers are expected to favor systems that connect voyage planning and audit-ready records. Suppliers with S-100 transition support can gain traction without forcing operators into disruptive bridge changes.
- France is forecast to expand at 6.9% CAGR over the forecast period, shaped by ferry routes, coastal navigation needs and S-100 trial activity. UK Hydrographic Office reported in December 2025 that an S-100 trial route from St. Helier to Saint-Malo was selected for early 2026 testing, providing practical evidence for systems handling richer chart layers across tidal and cross-border waters. French vessel operators are expected to assess ECDIS and ECS tools making route planning data easier to manage before voyage execution. Suppliers pairing S-100 readiness with chart service support can build stronger positions across channel routes and coastal fleets.
Who are the notable companies in the Electronic Chart Safety System Market?
Raymarine Commercial, Furuno, NAVTOR, Kongsberg Maritime, Anschütz, Japan Radio Company, ChartWorld, Teledyne SevenCs, OSI Maritime Systems and Garmin are the notable companies shaping electronic chart safety systems and navigation service pathways.
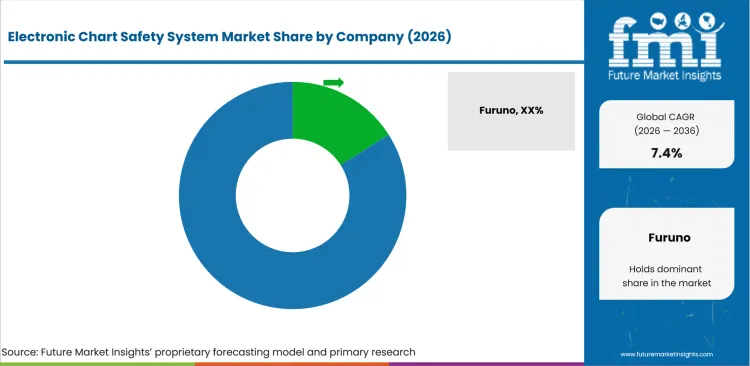
Competition in electronic chart safety systems is grouped by buyer expectations around ECDIS approval and bridge workflow support. Furuno, Japan Radio Company, Kongsberg Maritime, Anschütz and Raymarine Commercial bring bridge equipment and commissioning depth. NAVTOR and ChartWorld compete based on chart service workflows and fleet-level navigation management. Teledyne SevenCs supports software kernel depth for S-100 data handling. OSI Maritime Systems and Garmin address government and smaller vessel pathways.
- Furuno and Japan Radio Company compete based on ECDIS equipment depth and long service relationships. Shipowners review such suppliers for bridge compatibility and service continuity.
- Raymarine Commercial, ChartWorld and NAVTOR strengthen competition through chart services and navigation workflow platforms. Fleet operators use such suppliers for route planning evidence and data-layer transition support.
- Kongsberg Maritime and Anschütz support bridge integration needs aligned to commercial and specialist vessel programs. Buyer interest increases once chart display must interact with broader bridge systems and operator training.
- Teledyne SevenCs, OSI Maritime Systems and Garmin compete depending on government navigation needs and smaller vessel channels. Integration support and chart data capability remain useful for selected vessel classes.
Competitive Benchmarking: Electronic Chart Safety System Market
| Company | S-100 Chart Readiness | Bridge Integration Depth | Chart Service Workflow | Geographic Reach |
|---|---|---|---|---|
| Raymarine Commercial | High | Medium | Strong | Europe and North America |
| Furuno | High | High | Strong | Global |
| NAVTOR | High | Medium | High | Global |
| Kongsberg Maritime | Medium | High | Medium | Global |
| Anschütz | Medium | High | Medium | Europe and global |
| Japan Radio Company | Medium | High | Medium | Asia and global |
| ChartWorld | High | Medium | High | Global |
| Teledyne SevenCs | High | Medium | High | Global |
| OSI Maritime Systems | High | Strong | Medium | Naval and government markets |
| Garmin | Low | Medium | Medium | Global smaller vessel channels |
Source: Future Market Insights competitive analysis, 2026.
Key Developments in the Electronic Chart Safety System Market
- In November 2025, Raymarine Commercial launched Pathfinder ECDIS as an IMO-compliant navigation system for use as primary and backup navigation across vessel types. Product positioning supported ECDIS buyers needing route planning and reduced crew training work.
- In June 2024, NAVTOR acquired Masterloop to add IoT and web software capability. Navigation service buyers gained a stronger supplier pathway for connected route planning, fleet service tools and vessel performance support.
- In April 2026, Teledyne unified ChartWorld and Raymarine Commercial under one commercial navigation brand. Unified positioning linked ChartWorld chart service capability with Raymarine Commercial hardware and support for international shipping customers.
Key Players in the Electronic Chart Safety System Market
Integrated ECDIS and Bridge System Suppliers
- Furuno
- Japan Radio Company
- Kongsberg Maritime
- Anschütz
- Sperry Marine
Chart Services and E-navigation Platforms
- NAVTOR
- ChartWorld
- Raymarine Commercial
Navigation Software and Specialist Systems
- Teledyne SevenCs
- OSI Maritime Systems
- Garmin
Electronic Chart Safety System Market - Report Scope
| Coverage field | Report scope |
|---|---|
| Market breakdown | Electronic Chart Safety System Market Breakdown By System Type, Vessel Type, Function, Deployment, Sales Channel and Region |
| Market Definition | Onboard ECDIS, portable ECS, integrated bridge chart systems and chart update services used to support safe marine navigation |
| Regions Covered | North America, Latin America, Western Europe, Eastern Europe, East Asia, South Asia and Pacific, Middle East and Africa |
| Countries Covered | United States, United Kingdom, Germany, France, Japan, China, South Korea, India and 30+ countries |
| Key Companies Profiled | Raymarine Commercial, Furuno, NAVTOR, Kongsberg Maritime, Anschütz, Japan Radio Company, ChartWorld, Teledyne SevenCs, OSI Maritime Systems, Garmin |
| Forecast Period | 2026 to 2036 |
| Approach | Hybrid bottom-up and top-down methodology using vessel stock, retrofit timing, newbuild activity, system pricing and chart service revenue |
Source: Future Market Insights analysis, 2026.
Electronic Chart Safety System Market - Research Methodology
| Method | Approach |
|---|---|
| Primary Research | FMI analysts reviewed inputs from shipowners, bridge equipment suppliers, marine electronics dealers, vessel service providers and chart service firms. Discussions focused on compliance triggers, officer workflow, retrofit timing, chart update service needs and supplier acceptance. |
| Desk Research | Desk research covered IMO and IHO standards, Coast Guard guidance, hydrographic office updates, flag-state requirements, port statistics and company product information. Product coverage separated type-approved ECDIS from portable ECS and recreational chart tools. |
| Market Sizing and Forecasting | The model combined vessel stock, newbuild flow, retrofit cycles, chart service revenue, country-level maritime activity and average system pricing. Forecast assumptions were adjusted for S-100 readiness, inspection pressure and commercial fleet replacement timing. |
| Data Validation | Forecasts were checked against merchant fleet data, country port activity, shipbuilding signals and supplier product portfolios. Company portfolios were reviewed to avoid counting adjacent chart products without onboard safety or compliance use. |
Electronic Chart Safety System Market by Segments
Electronic Chart Safety System Market segmented by System Type:
- ECDIS
- Portable ECS
- Integrated Bridge Systems
- Chart Update Services
Electronic Chart Safety System Market segmented by Vessel Type:
- Commercial Ships
- Offshore Vessels
- Fishing Vessels
- Naval / Government
Electronic Chart Safety System Market segmented by Function:
- Route Planning
- Collision / Grounding Avoidance
- Regulatory Compliance
- Fleet Monitoring
Electronic Chart Safety System Market segmented by Deployment:
- Newbuild
- Retrofit / Upgrade
- Subscription / Updates
Electronic Chart Safety System Market segmented by Sales Channel:
- Direct OEM
- Marine Electronics Dealers
- Service Providers
Electronic Chart Safety System Market by Region:
- North America
- United States
- Canada
- Mexico
- Latin America
- Brazil
- Chile
- Rest of Latin America
- Western Europe
- Germany
- UK
- Italy
- Spain
- France
- Nordic
- BENELUX
- Rest of Western Europe
- Eastern Europe
- Russia
- Poland
- Hungary
- Balkan & Baltic
- Rest of Eastern Europe
- East Asia
- China
- Japan
- South Korea
- South Asia and Pacific
- India
- ASEAN
- Australia & New Zealand
- Rest of South Asia and Pacific
- Middle East & Africa
- Kingdom of Saudi Arabia
- Other GCC Countries
- Turkiye
- South Africa
- Other African Union
- Rest of Middle East & Africa
Research Sources and Bibliography
- ChartWorld. (2026, April 30). Teledyne unifies ChartWorld and Raymarine Commercial under a single global commercial navigation brand. ChartWorld.
- ClassNK. (2026). ECDIS News. ClassNK.
- Department for Transport. (2025, December 17). Port freight annual statistics 2024: Arrivals. Department for Transport.
- Eurostat. (2025). Maritime vessels statistics. European Commission.
- Federal Register. (2025, August 28). Notice of availability of Navigation and Vessel Inspection Circular 01-16 Change 3. Federal Register.
- International Association of Classification Societies. (2024). IACS UR E26 and E27 Press Release. International Association of Classification Societies.
- International Hydrographic Organization. (2026). S-100 Standards in Force - ENC & ECDIS. International Hydrographic Organization.
- International Hydrographic Organization. (2026, March 10). The S-100 framework is now operational. International Hydrographic Organization.
- Ministry of Oceans and Fisheries. (2025). Korea’s trade ports handled a record-breaking container volume of 31.73 million TEUs. Ministry of Oceans and Fisheries.
- NAVTOR. (2024, June 13). NAVTOR accelerates IoT and AI development with Masterloop acquisition. NAVTOR.
- Press Information Bureau. (2026, April 5). Major Ports Record 915 million tonnes cargo in FY 2025-26, surpass target with 7.06% growth. Ministry of Ports, Shipping and Waterways.
- Raymarine Commercial. (2025, November 25). Raymarine launches Pathfinder ECDIS. Raymarine Commercial.
- Raymarine Commercial. (2026, May 25). Raymarine Commercial trials S-100 ready ECDIS in real-world simulations. Raymarine Commercial.
- Teledyne SevenCs. (2026). Nautilus Maritime SDK. Teledyne SevenCs.
- UK Hydrographic Office. (2025, December 8). The UKHO partners with Shom to launch international S-100 sea trials programme. UK Hydrographic Office.
- UK Hydrographic Office. (2025, December 15). S-100 timelines explained. UK Hydrographic Office.
- UN Trade and Development. (2025, April 15). Maritime and other transport data insights. UN Trade and Development.
- UN Trade and Development. (2025, June 10). Maritime and other transport data insights. UN Trade and Development.
This bibliography is provided for reader reference and is not exhaustive. The full report contains the complete reference list and detailed citations.
This Report Answers
- What is the expected global value of the electronic chart safety system market in 2026 and 2036?
- What CAGR is forecast for electronic chart safety systems during the 2026 to 2036 period?
- Which system type segment is used to assess ECDIS demand in 2026?
- Why do shipowners buy electronic chart safety systems with validated route planning and chart update support?
- How do ECDIS and portable ECS shape electronic navigation choices?
- Which countries are compared in the electronic chart safety system market forecast?
- Which companies compete across chart services and S-100 navigation pathways?
- What electronic chart safety systems and applications are included within the market definition?
- How does FMI size and forecast electronic chart safety system demand across segments and countries?
- What implementation and supplier-selection factors should executives assess?
Frequently Asked Questions
What is driving growth in the electronic chart safety system market?
Growth is driven by ECDIS compliance and operator preference for chart update records with route planning evidence.
Why should executives track the electronic chart safety system market?
Executives should track electronic chart safety system demand since bridge system approval affects compliance cost and vessel inspection readiness.
What business problem does the electronic chart safety system market address?
Electronic chart safety systems help vessel operators plan routes and prove compliance during audits.
What should sourcing leaders evaluate before selecting suppliers?
Sourcing leaders should compare type approval and officer training coverage before supplier approval.
What can limit return on investment for buyers?
Return on investment can be delayed if retrofit timing, training cost or uncertain S-100 readiness forces repeated bridge work.
How can suppliers build executive confidence?
Suppliers build confidence through dependable chart update support and engineering accountability during newbuild or retrofit commissioning.
Preview the report firsthand - request a free sample
Get SampleGet the brochure for pricing and purchase details.
Get PDFTable of Content
- Key Takeaways
- Market Size and CAGR
- Top Growth Driver
- Fastest Growing Segment
- Leading Region
- Key Companies
- Emerging Opportunities
- Executive Summary
- Global Market Outlook
- Demand-side Trends
- Supply-side Trends
- Technology Roadmap Analysis
- Analysis and Recommendations
- Analyst Perspective (What is happening? Why now? What should investors know?)
- Key Questions Answered
- How large is the market?
- What is the CAGR?
- What are key trends?
- Which region dominates?
- Who are the leaders?
- Market Overview
- Market Coverage / Taxonomy
- Market Definition / Scope / Limitations
- Research Methodology
- Chapter Orientation
- Analytical Lens and Working Hypotheses
- Market Structure, Signals, and Trend Drivers
- Benchmarking and Cross-market Comparability
- Market Sizing, Forecasting, and Opportunity Mapping
- Research Design and Evidence Framework
- Desk Research Programme (Secondary Evidence)
- Expert Input and Fieldwork (Primary Evidence)
- Tooling, Models, and Reference Databases
- Data Engineering and Model Build
- Quality Assurance and Audit Trail
- Market Background
- Market Dynamics (Drivers, Restraints, Opportunity, Trends)
- Scenario Forecast (Optimistic, Likely, Conservative)
- Impact Analysis
- AI Impact
- Sustainability Impact
- Regulatory Impact
- Technology Impact
- Consumer / Buyer Analysis
- Purchase Drivers
- Adoption Barriers
- Buyer Journey
- Opportunity Map Analysis
- Product Life Cycle Analysis
- Supply Chain Analysis
- Investment Feasibility Matrix
- Value Chain Analysis
- PESTLE and Porter's Analysis
- Regulatory Landscape
- Regional Parent Market Outlook
- Production and Consumption Statistics
- Import and Export Statistics
- Global Market Analysis and Forecast, 2021 to 2036
- Historical Market Size Value (USD Million) & Volume (Unit) Analysis, 2021 to 2025
- Current and Future Market Size Value (USD Million) & Volume (Unit) Projections, 2026 to 2036
- Y-o-Y Growth Trend Analysis
- Absolute $ Opportunity Analysis
- Global Market Pricing Analysis, 2021 to 2036
- Global Market Analysis and Forecast, By System Type, 2021 to 2036
- Introduction / Key Findings
- Historical Market Size Value (USD Million) & Volume (Unit) Analysis By System Type, 2021 to 2025
- Current and Future Market Size Value (USD Million) & Volume (Unit) Analysis and Forecast By System Type, 2026 to 2036
- ECDIS
- Portable ECS
- Integrated Bridge Systems
- Chart Update Services
- ECDIS
- Y-o-Y Growth Trend Analysis By System Type, 2021 to 2025
- Absolute $ Opportunity Analysis By System Type, 2026 to 2036
- Global Market Analysis and Forecast, By Vessel Type, 2021 to 2036
- Introduction / Key Findings
- Historical Market Size Value (USD Million) & Volume (Unit) Analysis By Vessel Type, 2021 to 2025
- Current and Future Market Size Value (USD Million) & Volume (Unit) Analysis and Forecast By Vessel Type, 2026 to 2036
- Commercial Ships
- Offshore Vessels
- Fishing Vessels
- Naval - Government
- Commercial Ships
- Y-o-Y Growth Trend Analysis By Vessel Type, 2021 to 2025
- Absolute $ Opportunity Analysis By Vessel Type, 2026 to 2036
- Global Market Analysis and Forecast, By Function, 2021 to 2036
- Introduction / Key Findings
- Historical Market Size Value (USD Million) & Volume (Unit) Analysis By Function, 2021 to 2025
- Current and Future Market Size Value (USD Million) & Volume (Unit) Analysis and Forecast By Function, 2026 to 2036
- Route Planning
- Collision - Grounding Avoidance
- Regulatory Compliance
- Fleet Monitoring
- Route Planning
- Y-o-Y Growth Trend Analysis By Function, 2021 to 2025
- Absolute $ Opportunity Analysis By Function, 2026 to 2036
- Global Market Analysis and Forecast, By Deployment, 2021 to 2036
- Introduction / Key Findings
- Historical Market Size Value (USD Million) & Volume (Unit) Analysis By Deployment, 2021 to 2025
- Current and Future Market Size Value (USD Million) & Volume (Unit) Analysis and Forecast By Deployment, 2026 to 2036
- Retrofit - Upgrade
- Subscription - Updates
- Newbuild
- Retrofit - Upgrade
- Y-o-Y Growth Trend Analysis By Deployment, 2021 to 2025
- Absolute $ Opportunity Analysis By Deployment, 2026 to 2036
- Global Market Analysis and Forecast, By Sales Channel, 2021 to 2036
- Introduction / Key Findings
- Historical Market Size Value (USD Million) & Volume (Unit) Analysis By Sales Channel, 2021 to 2025
- Current and Future Market Size Value (USD Million) & Volume (Unit) Analysis and Forecast By Sales Channel, 2026 to 2036
- Direct OEM
- Marine Electronics Dealers
- Service Providers
- Direct OEM
- Y-o-Y Growth Trend Analysis By Sales Channel, 2021 to 2025
- Absolute $ Opportunity Analysis By Sales Channel, 2026 to 2036
- Global Market Analysis and Forecast, By Region, 2021 to 2036
- Introduction
- Historical Market Size Value (USD Million) & Volume (Unit) Analysis By Region, 2021 to 2025
- Current Market Size Value (USD Million) & Volume (Unit) Analysis and Forecast By Region, 2026 to 2036
- North America
- Latin America
- Western Europe
- Eastern Europe
- East Asia
- South Asia and Pacific
- Middle East & Africa
- Market Attractiveness Analysis By Region
- North America Market Analysis and Forecast, By Country, 2021 to 2036
- Historical Market Size Value (USD Million) & Volume (Unit) Trend Analysis By Market Taxonomy, 2021 to 2025
- Market Size Value (USD Million) & Volume (Unit) Forecast By Market Taxonomy, 2026 to 2036
- By Country
- USA
- Canada
- Mexico
- By System Type
- By Vessel Type
- By Function
- By Deployment
- By Sales Channel
- By Country
- Market Attractiveness Analysis
- By Country
- By System Type
- By Vessel Type
- By Function
- By Deployment
- By Sales Channel
- Key Takeaways
- Latin America Market Analysis and Forecast, By Country
- Historical Market Size Value (USD Million) & Volume (Unit) Trend Analysis By Market Taxonomy, 2021 to 2025
- Market Size Value (USD Million) & Volume (Unit) Forecast By Market Taxonomy, 2026 to 2036
- By Country
- Brazil
- Chile
- Rest of Latin America
- By System Type
- By Vessel Type
- By Function
- By Deployment
- By Sales Channel
- By Country
- Market Attractiveness Analysis
- By Country
- By System Type
- By Vessel Type
- By Function
- By Deployment
- By Sales Channel
- Key Takeaways
- Western Europe Market Analysis and Forecast, By Country
- Historical Market Size Value (USD Million) & Volume (Unit) Trend Analysis By Market Taxonomy, 2021 to 2025
- Market Size Value (USD Million) & Volume (Unit) Forecast By Market Taxonomy, 2026 to 2036
- By Country
- Germany
- UK
- Italy
- Spain
- France
- Nordic
- BENELUX
- Rest of Western Europe
- By System Type
- By Vessel Type
- By Function
- By Deployment
- By Sales Channel
- By Country
- Market Attractiveness Analysis
- By Country
- By System Type
- By Vessel Type
- By Function
- By Deployment
- By Sales Channel
- Key Takeaways
- Eastern Europe Market Analysis and Forecast, By Country
- Historical Market Size Value (USD Million) & Volume (Unit) Trend Analysis By Market Taxonomy, 2021 to 2025
- Market Size Value (USD Million) & Volume (Unit) Forecast By Market Taxonomy, 2026 to 2036
- By Country
- Russia
- Poland
- Hungary
- Balkan & Baltic
- Rest of Eastern Europe
- By System Type
- By Vessel Type
- By Function
- By Deployment
- By Sales Channel
- By Country
- Market Attractiveness Analysis
- By Country
- By System Type
- By Vessel Type
- By Function
- By Deployment
- By Sales Channel
- Key Takeaways
- East Asia Market Analysis and Forecast, By Country
- Historical Market Size Value (USD Million) & Volume (Unit) Trend Analysis By Market Taxonomy, 2021 to 2025
- Market Size Value (USD Million) & Volume (Unit) Forecast By Market Taxonomy, 2026 to 2036
- By Country
- China
- Japan
- South Korea
- By System Type
- By Vessel Type
- By Function
- By Deployment
- By Sales Channel
- By Country
- Market Attractiveness Analysis
- By Country
- By System Type
- By Vessel Type
- By Function
- By Deployment
- By Sales Channel
- Key Takeaways
- South Asia and Pacific Market Analysis and Forecast, By Country
- Historical Market Size Value (USD Million) & Volume (Unit) Trend Analysis By Market Taxonomy, 2021 to 2025
- Market Size Value (USD Million) & Volume (Unit) Forecast By Market Taxonomy, 2026 to 2036
- By Country
- India
- ASEAN
- Australia & New Zealand
- Rest of South Asia and Pacific
- By System Type
- By Vessel Type
- By Function
- By Deployment
- By Sales Channel
- By Country
- Market Attractiveness Analysis
- By Country
- By System Type
- By Vessel Type
- By Function
- By Deployment
- By Sales Channel
- Key Takeaways
- Middle East & Africa Market Analysis and Forecast, By Country
- Historical Market Size Value (USD Million) & Volume (Unit) Trend Analysis By Market Taxonomy, 2021 to 2025
- Market Size Value (USD Million) & Volume (Unit) Forecast By Market Taxonomy, 2026 to 2036
- By Country
- Kingdom of Saudi Arabia
- Other GCC Countries
- Türkiye
- South Africa
- Other African Union
- Rest of Middle East & Africa
- By System Type
- By Vessel Type
- By Function
- By Deployment
- By Sales Channel
- By Country
- Market Attractiveness Analysis
- By Country
- By System Type
- By Vessel Type
- By Function
- By Deployment
- By Sales Channel
- Key Takeaways
- Key Countries Market Analysis
- USA
- Pricing Analysis
- Market Share Analysis, 2025
- By System Type
- By Vessel Type
- By Function
- By Deployment
- By Sales Channel
- Canada
- Pricing Analysis
- Market Share Analysis, 2025
- By System Type
- By Vessel Type
- By Function
- By Deployment
- By Sales Channel
- Mexico
- Pricing Analysis
- Market Share Analysis, 2025
- By System Type
- By Vessel Type
- By Function
- By Deployment
- By Sales Channel
- Brazil
- Pricing Analysis
- Market Share Analysis, 2025
- By System Type
- By Vessel Type
- By Function
- By Deployment
- By Sales Channel
- Chile
- Pricing Analysis
- Market Share Analysis, 2025
- By System Type
- By Vessel Type
- By Function
- By Deployment
- By Sales Channel
- Germany
- Pricing Analysis
- Market Share Analysis, 2025
- By System Type
- By Vessel Type
- By Function
- By Deployment
- By Sales Channel
- UK
- Pricing Analysis
- Market Share Analysis, 2025
- By System Type
- By Vessel Type
- By Function
- By Deployment
- By Sales Channel
- Italy
- Pricing Analysis
- Market Share Analysis, 2025
- By System Type
- By Vessel Type
- By Function
- By Deployment
- By Sales Channel
- Spain
- Pricing Analysis
- Market Share Analysis, 2025
- By System Type
- By Vessel Type
- By Function
- By Deployment
- By Sales Channel
- France
- Pricing Analysis
- Market Share Analysis, 2025
- By System Type
- By Vessel Type
- By Function
- By Deployment
- By Sales Channel
- India
- Pricing Analysis
- Market Share Analysis, 2025
- By System Type
- By Vessel Type
- By Function
- By Deployment
- By Sales Channel
- ASEAN
- Pricing Analysis
- Market Share Analysis, 2025
- By System Type
- By Vessel Type
- By Function
- By Deployment
- By Sales Channel
- Australia & New Zealand
- Pricing Analysis
- Market Share Analysis, 2025
- By System Type
- By Vessel Type
- By Function
- By Deployment
- By Sales Channel
- China
- Pricing Analysis
- Market Share Analysis, 2025
- By System Type
- By Vessel Type
- By Function
- By Deployment
- By Sales Channel
- Japan
- Pricing Analysis
- Market Share Analysis, 2025
- By System Type
- By Vessel Type
- By Function
- By Deployment
- By Sales Channel
- South Korea
- Pricing Analysis
- Market Share Analysis, 2025
- By System Type
- By Vessel Type
- By Function
- By Deployment
- By Sales Channel
- Russia
- Pricing Analysis
- Market Share Analysis, 2025
- By System Type
- By Vessel Type
- By Function
- By Deployment
- By Sales Channel
- Poland
- Pricing Analysis
- Market Share Analysis, 2025
- By System Type
- By Vessel Type
- By Function
- By Deployment
- By Sales Channel
- Hungary
- Pricing Analysis
- Market Share Analysis, 2025
- By System Type
- By Vessel Type
- By Function
- By Deployment
- By Sales Channel
- Kingdom of Saudi Arabia
- Pricing Analysis
- Market Share Analysis, 2025
- By System Type
- By Vessel Type
- By Function
- By Deployment
- By Sales Channel
- Türkiye
- Pricing Analysis
- Market Share Analysis, 2025
- By System Type
- By Vessel Type
- By Function
- By Deployment
- By Sales Channel
- South Africa
- Pricing Analysis
- Market Share Analysis, 2025
- By System Type
- By Vessel Type
- By Function
- By Deployment
- By Sales Channel
- USA
- Market Structure Analysis
- Competition Dashboard
- Competition Benchmarking
- Market Share Analysis of Top Players
- By Regional
- By System Type
- By Vessel Type
- By Function
- By Deployment
- By Sales Channel
- Emerging Startups
- Innovation Benchmarking
- Competition Analysis
- Competition Deep Dive
- Furuno
- Overview
- Product Portfolio
- Profitability by Market Segments (Product/Region/Sales Channel)
- Sales Footprint
- Strategy Overview
- Marketing Strategy
- Product Strategy
- Channel Strategy
- Japan Radio Company
- Kongsberg Maritime
- Anschütz
- Sperry Marine
- NAVTOR
- ChartWorld
- Raymarine Commercial
- Furuno
- Case Studies
- Success Stories
- Recent Developments
- Competition Deep Dive
- Assumptions & Acronyms Used


