Embedded Finance Market Size and Share Forecast Outlook 2025 to 2035

The Embedded Finance Market is estimated to be valued at USD 85.8 billion in 2025 and is projected to reach USD 370.9 billion by 2035, registering a compound annual growth rate (CAGR) of 15.8% over the forecast period.
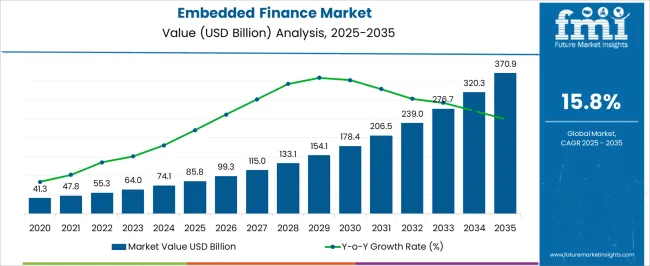
Quick Stats for Embedded Finance Market

  • Embedded Finance Market Industry Value (2025): USD 85.8 billion
  • Embedded Finance Market Forecast Value (2035): USD 370.9 billion
  • Embedded Finance Market Forecast CAGR: 15.8%
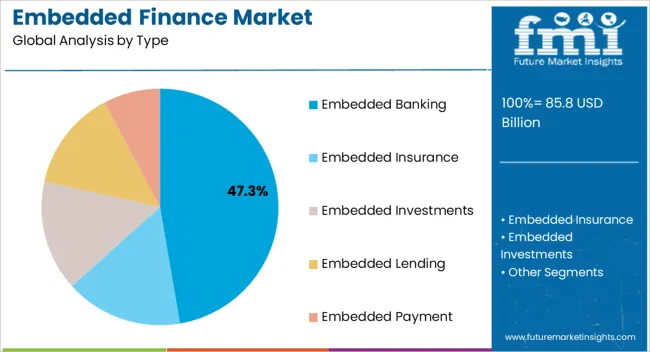
  • Leading Segment in Embedded Finance Market in 2025: Embedded Banking (47.3%)
  • Key Growth Region in Embedded Finance Market: North America, Asia-Pacific, Europe
  • Top Key Players in Embedded Finance Market: Bankable, Banxware, Cross River, Finix, Flywire, Resolve, Parafin, TreviPay, Balance, Stripe

Embedded Finance Market Market Value Analysis

Metric Value
Embedded Finance Market Estimated Value in (2025 E) USD 85.8 billion
Embedded Finance Market Forecast Value in (2035 F) USD 370.9 billion
Forecast CAGR (2025 to 2035) 15.8%

Rationale for Segmental Growth in the Embedded Finance Market

The embedded finance market is expanding rapidly due to the rising integration of financial services into non financial digital platforms, creating seamless user experiences and unlocking new revenue streams. Increasing adoption of digital ecosystems, from e commerce to ride hailing, is driving the inclusion of banking, payments, and lending directly within platforms consumers already use.

This trend is supported by advancements in APIs, cloud infrastructure, and regulatory frameworks that encourage financial inclusion and innovation. Businesses are leveraging embedded finance to reduce friction in transactions, enhance customer engagement, and gain deeper insights into consumer behavior.

The outlook remains promising as partnerships between technology providers, financial institutions, and digital service companies continue to evolve, shaping a market defined by convenience, accessibility, and data driven financial solutions.
Segmental Analysis

Insights into the Embedded Banking Type Segment

Embedded Finance Market Analysis By Type

The embedded banking segment is expected to represent 47.30% of the overall market by 2025, positioning it as the leading type. This growth is being driven by the integration of banking features such as digital accounts, cards, and payment services directly within non financial platforms.

The demand for frictionless financial services that reduce the need for third party banking interactions has been a key growth catalyst. Businesses adopting embedded banking have gained the ability to enhance customer loyalty, increase transaction volumes, and generate recurring revenue.

Regulatory support for open banking and rising consumer preference for simplified financial solutions have further strengthened the position of this segment, making embedded banking the cornerstone of the embedded finance landscape.
Insights into the Loans Associations End User Segment

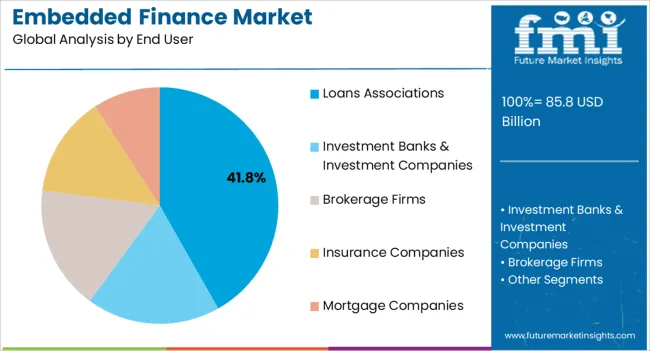
Embedded Finance Market Analysis By End User

The loans associations segment is projected to hold 41.80% of the market by 2025, establishing it as the dominant end user category. Growth in this segment is being fueled by the increasing need for credit accessibility, particularly for underbanked populations and small businesses.

Embedded loan solutions have enabled faster approval processes, automated risk assessments, and improved customer experience within digital platforms. Associations and organizations providing loans are adopting embedded finance to expand outreach, reduce operational costs, and improve repayment efficiencies.

As digital ecosystems prioritize inclusivity and streamlined lending, the loans associations segment continues to lead, benefiting from both technological innovation and evolving credit demand across global markets.

What Are The Key Drivers And Restraints For Growth Of The Embedded Finance Market?

Concepts like UPIs, consumer lending, SME lending, and insurance are helping the embedded finance market grow. These concepts are also expected to push the market upward in the forecast period, digitizing multiple sectors from finance to retail.

The key factors driving the growth of the embedded finance market are growing digitization in multiple spaces, acceptance of UPI payments, and increased consumer and SME lending.

Embedded finance can be known as financial services that are not integrated with banks.

The use of these services has increased lately due to the transformation of each sector and the fourth industrial revolution, also known as Industry 4.0. Covid-19 has also pushed the cashless economy and increased the consumption of embedded finance.

SME lending is another growing sector, accelerating the growth of the embedded finance market worldwide. Small and medium-sized enterprises seek financial aid to expand their distribution channels and supply chains; especially the covid-19 has impacted these SMEs adversely. To recover from the damage, these small and medium enterprises seek financial help, a loan against a business, or any other type of loan. This pushes the sales of embedded finance solutions and services.

Multiple investment schemes drawn up by governments and private players are also spreading awareness among people about alternative investment plans. Apart from this, the digitization of multiple sectors leads to cashless transactions, fueling the sales of embedded finance services. For instance,

Cashless transactions have skyrocketed in India due to covid-19 and demonetization. The UPI payments are now used largely, integrating with multiple platforms like Paytm, Google Pay, and Phone Pay. Low-cost EMIs are another important factor that drives the sales of consumer lending.

The B2B operations integrate with fintech services to improve financial management, increasing the sales of embedded finance solutions. Another key factor that pushes the market growth is the high penetration of the internet and 4G/5G services in developed and developing regions.

The only restraint to the market is the unavailability of the internet, including the incompetency of the workforce. New risks involving financial transactions that lead up to fraud and malicious activities are also hindering the growth of the embedded finance market.

Country-wise Insights

Countries Revenue Share % (2025)
The United States 22.3%
Germany 12.3%
Japan 7.1%
Australia 3.2%
North America 32.5%
Europe 25.4%
Countries CAGR % (2025 to 2035)
China 370.9.7%
India 19.5%
The United Kingdom 16.3%

The embedded finance market is divided into regions such as North America, Latin America, Asia Pacific, the Middle East and Africa (MEA), and Europe. The foremost market is the United States, thriving at a CAGR of 16.1% between 2025 and 2035. The United States held a market share of 22.3% in 2002 while North America region held a market share of 32.5

The region is expected to hold a market revenue of USD 370.9 billion by the end of 2035. Factors behind this region's high sales of embedded finance solutions and services are increased investment, payment, and loan digitization. Apart from this, China is the second high-growth market for embedded finance market, thriving at a CAGR of 15.8% and might hold a value of USD 370.9 billion by 2035.

Japan region is estimated to hold USD 13.8 billion by the end of 2035 as it thrives on a promising CAGR of 14.7% between 2025 and 2035. The United Kingdom also grows along with Japan and the forecasted value is USD 10.5 billion (2035) at a CAGR of 15.3% between 2025 and 2035.

Key Regional Trends:

  • The United States holds a significant portion of the embedded finance market.
  • The United States of America is a notably growing market making North America region the highest growing region, thriving at a CAGR of 16.1% between 2025 and 2035.
  • Better end user experience, growing digitization, better ROI, and smooth processes provided by embedded finance services in North American countries like the United States and Canada are pushing the demand for embedded finance solutions in the region.

Category-Wise Landscape

Category By Type
Leading Segment Embedded Banking
Market Share (2025) 32.1%
Category By End User Type
Leading Segment Investment Banks and Investment Companies
Market Share (2025) 27.2%

What is the Segmentation Outlook for the Embedded Finance Market?

The embedded finance market is categorized by type and end user. These categories are further divided into small segments that expand their channels in multiple market spaces. These segments perform differently in multiple markets as they have a stronghold in multiple regions.

The type category is segmented into embedded banking, embedded insurance, embedded investments, embedded lending, and embedded payments. The end user category is segmented into loan associations, investment banks & investments companies, brokerage firms, insurance companies, and mortgage companies.

Which Segment is Likely to Lead the Embedded Finance Market by Type?

By type, the FMI study finds that the embedded banking type has a high sales potential through 2035. The adoption of embedded held a market share of 32.1% in 2025. Its growth is attributed to the rapid digitization of banking services and private banks, enhancing and transforming the customer experience.

In the future, sales of embedded banking services are estimated to grow in proportion to the need for easy processes and smooth transactions. This pushes the sales of embedded finance systems in new markets.

Which Segment is Likely to Lead the Embedded Finance Market by End User?

By the end, the user, investment banks & investment companies segment is the big segment in the embedded finance market and is expected to hold a notable portion in the forecast period. The segment held a market share of 27.2% in 2025.

Factors behind the growth of this segment are rising start-ups and demand for high investments. The increased consumption through investment services and integration of embedded fintech services is increasing the sales of embedded finance solutions.
Competition Scenario

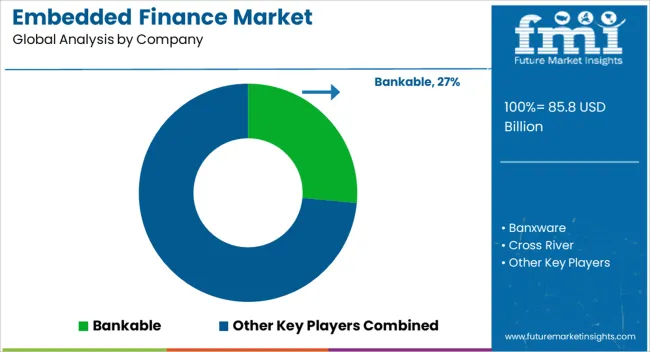
Embedded Finance Market Analysis By Company

The competitive landscape of embedded finance is diversified and makes the market exclusive for new players. Companies also collaborate and merge with other companies, which enhances operability. The vendors focus on expanding their supply chain and distribution channels.

Market Developments

  • Bankable has introduced its series of virtual ledger managers, payment card programs, digital banking, and e-wallet. This pushes the sales of embedded finance services.
  • Crossriver has launched its multiple embedded finance services like payment, lending, banking, traditional banking, and compliance. These fuel the sales of embedded finance services.
  • Flywire has upgraded its set of services covering multiple industries like education, healthcare, travel, and B2B, fueling the sales of embedded finance solutions.
  • Balance has introduced its platform that delivers credit limit and net terms with financing deals up to USD 4.5 million through the real-time application. The platform also provides the service of instant payouts, automatic reconciliation, and vendor out-boarding through a smooth B2B-friendly design.
  • Stripe is another embedded finance platform that builds enhanced financial services for B2B clients. Online payments, capital access, fund generation, and card issuing are some of the other services the company delivers.

Key Players Working in the Embedded Finance Market

  • Bankable
  • Banxware
  • Cross River
  • Finix
  • Flywire
  • Resolve
  • Parafin
  • TreviPay
  • Balance
  • Stripe

Report Scope Table - Embedded Finance Market

Report Attributes Details
Current Total Market Size (2025) USD 85.8 billion
Projected Market Size (2035) USD 370.9 billion
CAGR (2025 to 2035) 15.8%
Base Year for Estimation 2025
Historical Period 2020 to 2025
Projections Period 2025 to 2035
Quantitative Units USD billion for value and million transactions for volume
Types Analyzed (Segment 1) Embedded Banking, Embedded Insurance, Embedded Investments, Embedded Lending, Embedded Payment
End Users Analyzed (Segment 2) Loan Associations, Investment Banks & Investment Companies, Brokerage Firms, Insurance Companies, Mortgage Companies
Regions Covered North America; Latin America; Western Europe; Eastern Europe; South Asia and Pacific; East Asia; Middle East & Africa
Countries Covered United States, Canada, Brazil, Argentina, Germany, France, United Kingdom, Italy, Spain, Netherlands, China, India, Japan, South Korea, ANZ, GCC Countries, South Africa
Key Players influencing the Embedded Finance Market Bankable, Banxware, Cross River, Finix, Flywire, Resolve, Parafin, TreviPay, Balance, Stripe
Additional Attributes Digital transformation in banking-as-a-service (BaaS), Use cases across e-commerce, SaaS, and gig platforms, Cross-sector partnerships in embedded finance rollouts, Fintech innovation in APIs and open banking compliance, Regulatory implications and market entry challenges
Customization and Pricing Customization and Pricing Available on Request

Key Segments Covered

By Type:

  • Embedded Banking
  • Embedded Insurance
  • Embedded Investments
  • Embedded Lending
  • Embedded Payment

By End User:

  • Loans Associations
  • Investment Banks & Investment Companies
  • Brokerage Firms
  • Insurance Companies
  • Mortgage Companies

Key Regions Covered:

  • North America
    • The United States
    • Canada
  • Latin America
    • Brazil
    • Mexico
    • Rest of Latin America
  • Europe
    • Germany
    • The United Kingdom
    • France
    • Spain
    • Russia
    • Rest of Europe
  • Japan
  • Asia Pacific Excluding Japan
    • China
    • India
    • Malaysia
    • Singapore
    • Australia
    • Rest of Asia Pacific Excluding Japan (APEJ)
  • The Middle East and Africa
    • GCC Countries
    • Israel
    • South Africa
    • The Middle East and Africa (MEA)

Table of Content

  1. Executive Summary
    • Global Market Outlook
    • Demand-side Trends
    • Supply-side Trends
    • Technology Roadmap Analysis
    • Analysis and Recommendations
  2. Market Overview
    • Market Coverage / Taxonomy
    • Market Definition / Scope / Limitations
  3. Market Background
    • Market Dynamics
      • Drivers
      • Restraints
      • Opportunity
      • Trends
    • Scenario Forecast
      • Demand in Optimistic Scenario
      • Demand in Likely Scenario
      • Demand in Conservative Scenario
    • Opportunity Map Analysis
    • Product Life Cycle Analysis
    • Supply Chain Analysis
    • Investment Feasibility Matrix
    • Value Chain Analysis
    • PESTLE and Porter’s Analysis
    • Regulatory Landscape
    • Regional Parent Market Outlook
    • Production and Consumption Statistics
    • Import and Export Statistics
  4. Global Market Analysis 2020 to 2024 and Forecast, 2025 to 2035
    • Historical Market Size Value (USD Million) Analysis, 2020 to 2024
    • Current and Future Market Size Value (USD Million) Projections, 2025 to 2035
      • Y-o-Y Growth Trend Analysis
      • Absolute $ Opportunity Analysis
  5. Global Market Pricing Analysis 2020 to 2024 and Forecast 2025 to 2035
  6. Global Market Analysis 2020 to 2024 and Forecast 2025 to 2035, By Type
    • Introduction / Key Findings
    • Historical Market Size Value (USD Million) Analysis By Type , 2020 to 2024
    • Current and Future Market Size Value (USD Million) Analysis and Forecast By Type , 2025 to 2035
      • Embedded Banking
      • Embedded Insurance
      • Embedded Investments
      • Embedded Lending
      • Embedded Payment
    • Y-o-Y Growth Trend Analysis By Type , 2020 to 2024
    • Absolute $ Opportunity Analysis By Type , 2025 to 2035
  7. Global Market Analysis 2020 to 2024 and Forecast 2025 to 2035, By End User
    • Introduction / Key Findings
    • Historical Market Size Value (USD Million) Analysis By End User, 2020 to 2024
    • Current and Future Market Size Value (USD Million) Analysis and Forecast By End User, 2025 to 2035
      • Loans Associations
      • Investment Banks & Investment Companies
      • Brokerage Firms
      • Insurance Companies
      • Mortgage Companies
    • Y-o-Y Growth Trend Analysis By End User, 2020 to 2024
    • Absolute $ Opportunity Analysis By End User, 2025 to 2035
  8. Global Market Analysis 2020 to 2024 and Forecast 2025 to 2035, By Region
    • Introduction
    • Historical Market Size Value (USD Million) Analysis By Region, 2020 to 2024
    • Current Market Size Value (USD Million) Analysis and Forecast By Region, 2025 to 2035
      • North America
      • Latin America
      • Western Europe
      • Eastern Europe
      • East Asia
      • South Asia and Pacific
      • Middle East & Africa
    • Market Attractiveness Analysis By Region
  9. North America Market Analysis 2020 to 2024 and Forecast 2025 to 2035, By Country
    • Historical Market Size Value (USD Million) Trend Analysis By Market Taxonomy, 2020 to 2024
    • Market Size Value (USD Million) Forecast By Market Taxonomy, 2025 to 2035
      • By Country
        • USA
        • Canada
        • Mexico
      • By Type
      • By End User
    • Market Attractiveness Analysis
      • By Country
      • By Type
      • By End User
    • Key Takeaways
  10. Latin America Market Analysis 2020 to 2024 and Forecast 2025 to 2035, By Country
    • Historical Market Size Value (USD Million) Trend Analysis By Market Taxonomy, 2020 to 2024
    • Market Size Value (USD Million) Forecast By Market Taxonomy, 2025 to 2035
      • By Country
        • Brazil
        • Chile
        • Rest of Latin America
      • By Type
      • By End User
    • Market Attractiveness Analysis
      • By Country
      • By Type
      • By End User
    • Key Takeaways
  11. Western Europe Market Analysis 2020 to 2024 and Forecast 2025 to 2035, By Country
    • Historical Market Size Value (USD Million) Trend Analysis By Market Taxonomy, 2020 to 2024
    • Market Size Value (USD Million) Forecast By Market Taxonomy, 2025 to 2035
      • By Country
        • Germany
        • UK
        • Italy
        • Spain
        • France
        • Nordic
        • BENELUX
        • Rest of Western Europe
      • By Type
      • By End User
    • Market Attractiveness Analysis
      • By Country
      • By Type
      • By End User
    • Key Takeaways
  12. Eastern Europe Market Analysis 2020 to 2024 and Forecast 2025 to 2035, By Country
    • Historical Market Size Value (USD Million) Trend Analysis By Market Taxonomy, 2020 to 2024
    • Market Size Value (USD Million) Forecast By Market Taxonomy, 2025 to 2035
      • By Country
        • Russia
        • Poland
        • Hungary
        • Balkan & Baltic
        • Rest of Eastern Europe
      • By Type
      • By End User
    • Market Attractiveness Analysis
      • By Country
      • By Type
      • By End User
    • Key Takeaways
  13. East Asia Market Analysis 2020 to 2024 and Forecast 2025 to 2035, By Country
    • Historical Market Size Value (USD Million) Trend Analysis By Market Taxonomy, 2020 to 2024
    • Market Size Value (USD Million) Forecast By Market Taxonomy, 2025 to 2035
      • By Country
        • China
        • Japan
        • South Korea
      • By Type
      • By End User
    • Market Attractiveness Analysis
      • By Country
      • By Type
      • By End User
    • Key Takeaways
  14. South Asia and Pacific Market Analysis 2020 to 2024 and Forecast 2025 to 2035, By Country
    • Historical Market Size Value (USD Million) Trend Analysis By Market Taxonomy, 2020 to 2024
    • Market Size Value (USD Million) Forecast By Market Taxonomy, 2025 to 2035
      • By Country
        • India
        • ASEAN
        • Australia & New Zealand
        • Rest of South Asia and Pacific
      • By Type
      • By End User
    • Market Attractiveness Analysis
      • By Country
      • By Type
      • By End User
    • Key Takeaways
  15. Middle East & Africa Market Analysis 2020 to 2024 and Forecast 2025 to 2035, By Country
    • Historical Market Size Value (USD Million) Trend Analysis By Market Taxonomy, 2020 to 2024
    • Market Size Value (USD Million) Forecast By Market Taxonomy, 2025 to 2035
      • By Country
        • Kingdom of Saudi Arabia
        • Other GCC Countries
        • Turkiye
        • South Africa
        • Other African Union
        • Rest of Middle East & Africa
      • By Type
      • By End User
    • Market Attractiveness Analysis
      • By Country
      • By Type
      • By End User
    • Key Takeaways
  16. Key Countries Market Analysis
    • USA
      • Pricing Analysis
      • Market Share Analysis, 2024
        • By Type
        • By End User
    • Canada
      • Pricing Analysis
      • Market Share Analysis, 2024
        • By Type
        • By End User
    • Mexico
      • Pricing Analysis
      • Market Share Analysis, 2024
        • By Type
        • By End User
    • Brazil
      • Pricing Analysis
      • Market Share Analysis, 2024
        • By Type
        • By End User
    • Chile
      • Pricing Analysis
      • Market Share Analysis, 2024
        • By Type
        • By End User
    • Germany
      • Pricing Analysis
      • Market Share Analysis, 2024
        • By Type
        • By End User
    • UK
      • Pricing Analysis
      • Market Share Analysis, 2024
        • By Type
        • By End User
    • Italy
      • Pricing Analysis
      • Market Share Analysis, 2024
        • By Type
        • By End User
    • Spain
      • Pricing Analysis
      • Market Share Analysis, 2024
        • By Type
        • By End User
    • France
      • Pricing Analysis
      • Market Share Analysis, 2024
        • By Type
        • By End User
    • India
      • Pricing Analysis
      • Market Share Analysis, 2024
        • By Type
        • By End User
    • ASEAN
      • Pricing Analysis
      • Market Share Analysis, 2024
        • By Type
        • By End User
    • Australia & New Zealand
      • Pricing Analysis
      • Market Share Analysis, 2024
        • By Type
        • By End User
    • China
      • Pricing Analysis
      • Market Share Analysis, 2024
        • By Type
        • By End User
    • Japan
      • Pricing Analysis
      • Market Share Analysis, 2024
        • By Type
        • By End User
    • South Korea
      • Pricing Analysis
      • Market Share Analysis, 2024
        • By Type
        • By End User
    • Russia
      • Pricing Analysis
      • Market Share Analysis, 2024
        • By Type
        • By End User
    • Poland
      • Pricing Analysis
      • Market Share Analysis, 2024
        • By Type
        • By End User
    • Hungary
      • Pricing Analysis
      • Market Share Analysis, 2024
        • By Type
        • By End User
    • Kingdom of Saudi Arabia
      • Pricing Analysis
      • Market Share Analysis, 2024
        • By Type
        • By End User
    • Turkiye
      • Pricing Analysis
      • Market Share Analysis, 2024
        • By Type
        • By End User
    • South Africa
      • Pricing Analysis
      • Market Share Analysis, 2024
        • By Type
        • By End User
  17. Market Structure Analysis
    • Competition Dashboard
    • Competition Benchmarking
    • Market Share Analysis of Top Players
      • By Regional
      • By Type
      • By End User
  18. Competition Analysis
    • Competition Deep Dive
      • Bankable
        • Overview
        • Product Portfolio
        • Profitability by Market Segments (Product/Age /Sales Channel/Region)
        • Sales Footprint
        • Strategy Overview
          • Marketing Strategy
          • Product Strategy
          • Channel Strategy
      • Banxware
      • Cross River
      • Finix
      • Flywire
      • Resolve
      • Parafin
      • TreviPay
      • Balance
      • Stripe
  19. Assumptions & Acronyms Used
  20. Research Methodology

List of Tables

  • Table 1: Global Market Value (USD Million) Forecast by Region, 2020-2035
  • Table 2: Global Market Value (USD Million) Forecast by Type , 2020-2035
  • Table 3: Global Market Value (USD Million) Forecast by End User, 2020-2035
  • Table 4: North America Market Value (USD Million) Forecast by Country, 2020-2035
  • Table 5: North America Market Value (USD Million) Forecast by Type , 2020-2035
  • Table 6: North America Market Value (USD Million) Forecast by End User, 2020-2035
  • Table 7: Latin America Market Value (USD Million) Forecast by Country, 2020-2035
  • Table 8: Latin America Market Value (USD Million) Forecast by Type , 2020-2035
  • Table 9: Latin America Market Value (USD Million) Forecast by End User, 2020-2035
  • Table 10: Western Europe Market Value (USD Million) Forecast by Country, 2020-2035
  • Table 11: Western Europe Market Value (USD Million) Forecast by Type , 2020-2035
  • Table 12: Western Europe Market Value (USD Million) Forecast by End User, 2020-2035
  • Table 13: Eastern Europe Market Value (USD Million) Forecast by Country, 2020-2035
  • Table 14: Eastern Europe Market Value (USD Million) Forecast by Type , 2020-2035
  • Table 15: Eastern Europe Market Value (USD Million) Forecast by End User, 2020-2035
  • Table 16: East Asia Market Value (USD Million) Forecast by Country, 2020-2035
  • Table 17: East Asia Market Value (USD Million) Forecast by Type , 2020-2035
  • Table 18: East Asia Market Value (USD Million) Forecast by End User, 2020-2035
  • Table 19: South Asia and Pacific Market Value (USD Million) Forecast by Country, 2020-2035
  • Table 20: South Asia and Pacific Market Value (USD Million) Forecast by Type , 2020-2035
  • Table 21: South Asia and Pacific Market Value (USD Million) Forecast by End User, 2020-2035
  • Table 22: Middle East & Africa Market Value (USD Million) Forecast by Country, 2020-2035
  • Table 23: Middle East & Africa Market Value (USD Million) Forecast by Type , 2020-2035
  • Table 24: Middle East & Africa Market Value (USD Million) Forecast by End User, 2020-2035

List of Figures

  • Figure 1: Global Market Pricing Analysis
  • Figure 2: Global Market Value (USD Million) Forecast 2020-2035
  • Figure 3: Global Market Value Share and BPS Analysis by Type , 2025 and 2035
  • Figure 4: Global Market Y-o-Y Growth Comparison by Type , 2025-2035
  • Figure 5: Global Market Attractiveness Analysis by Type
  • Figure 6: Global Market Value Share and BPS Analysis by End User, 2025 and 2035
  • Figure 7: Global Market Y-o-Y Growth Comparison by End User, 2025-2035
  • Figure 8: Global Market Attractiveness Analysis by End User
  • Figure 9: Global Market Value (USD Million) Share and BPS Analysis by Region, 2025 and 2035
  • Figure 10: Global Market Y-o-Y Growth Comparison by Region, 2025-2035
  • Figure 11: Global Market Attractiveness Analysis by Region
  • Figure 12: North America Market Incremental Dollar Opportunity, 2025-2035
  • Figure 13: Latin America Market Incremental Dollar Opportunity, 2025-2035
  • Figure 14: Western Europe Market Incremental Dollar Opportunity, 2025-2035
  • Figure 15: Eastern Europe Market Incremental Dollar Opportunity, 2025-2035
  • Figure 16: East Asia Market Incremental Dollar Opportunity, 2025-2035
  • Figure 17: South Asia and Pacific Market Incremental Dollar Opportunity, 2025-2035
  • Figure 18: Middle East & Africa Market Incremental Dollar Opportunity, 2025-2035
  • Figure 19: North America Market Value Share and BPS Analysis by Country, 2025 and 2035
  • Figure 20: North America Market Value Share and BPS Analysis by Type , 2025 and 2035
  • Figure 21: North America Market Y-o-Y Growth Comparison by Type , 2025-2035
  • Figure 22: North America Market Attractiveness Analysis by Type
  • Figure 23: North America Market Value Share and BPS Analysis by End User, 2025 and 2035
  • Figure 24: North America Market Y-o-Y Growth Comparison by End User, 2025-2035
  • Figure 25: North America Market Attractiveness Analysis by End User
  • Figure 26: Latin America Market Value Share and BPS Analysis by Country, 2025 and 2035
  • Figure 27: Latin America Market Value Share and BPS Analysis by Type , 2025 and 2035
  • Figure 28: Latin America Market Y-o-Y Growth Comparison by Type , 2025-2035
  • Figure 29: Latin America Market Attractiveness Analysis by Type
  • Figure 30: Latin America Market Value Share and BPS Analysis by End User, 2025 and 2035
  • Figure 31: Latin America Market Y-o-Y Growth Comparison by End User, 2025-2035
  • Figure 32: Latin America Market Attractiveness Analysis by End User
  • Figure 33: Western Europe Market Value Share and BPS Analysis by Country, 2025 and 2035
  • Figure 34: Western Europe Market Value Share and BPS Analysis by Type , 2025 and 2035
  • Figure 35: Western Europe Market Y-o-Y Growth Comparison by Type , 2025-2035
  • Figure 36: Western Europe Market Attractiveness Analysis by Type
  • Figure 37: Western Europe Market Value Share and BPS Analysis by End User, 2025 and 2035
  • Figure 38: Western Europe Market Y-o-Y Growth Comparison by End User, 2025-2035
  • Figure 39: Western Europe Market Attractiveness Analysis by End User
  • Figure 40: Eastern Europe Market Value Share and BPS Analysis by Country, 2025 and 2035
  • Figure 41: Eastern Europe Market Value Share and BPS Analysis by Type , 2025 and 2035
  • Figure 42: Eastern Europe Market Y-o-Y Growth Comparison by Type , 2025-2035
  • Figure 43: Eastern Europe Market Attractiveness Analysis by Type
  • Figure 44: Eastern Europe Market Value Share and BPS Analysis by End User, 2025 and 2035
  • Figure 45: Eastern Europe Market Y-o-Y Growth Comparison by End User, 2025-2035
  • Figure 46: Eastern Europe Market Attractiveness Analysis by End User
  • Figure 47: East Asia Market Value Share and BPS Analysis by Country, 2025 and 2035
  • Figure 48: East Asia Market Value Share and BPS Analysis by Type , 2025 and 2035
  • Figure 49: East Asia Market Y-o-Y Growth Comparison by Type , 2025-2035
  • Figure 50: East Asia Market Attractiveness Analysis by Type
  • Figure 51: East Asia Market Value Share and BPS Analysis by End User, 2025 and 2035
  • Figure 52: East Asia Market Y-o-Y Growth Comparison by End User, 2025-2035
  • Figure 53: East Asia Market Attractiveness Analysis by End User
  • Figure 54: South Asia and Pacific Market Value Share and BPS Analysis by Country, 2025 and 2035
  • Figure 55: South Asia and Pacific Market Value Share and BPS Analysis by Type , 2025 and 2035
  • Figure 56: South Asia and Pacific Market Y-o-Y Growth Comparison by Type , 2025-2035
  • Figure 57: South Asia and Pacific Market Attractiveness Analysis by Type
  • Figure 58: South Asia and Pacific Market Value Share and BPS Analysis by End User, 2025 and 2035
  • Figure 59: South Asia and Pacific Market Y-o-Y Growth Comparison by End User, 2025-2035
  • Figure 60: South Asia and Pacific Market Attractiveness Analysis by End User
  • Figure 61: Middle East & Africa Market Value Share and BPS Analysis by Country, 2025 and 2035
  • Figure 62: Middle East & Africa Market Value Share and BPS Analysis by Type , 2025 and 2035
  • Figure 63: Middle East & Africa Market Y-o-Y Growth Comparison by Type , 2025-2035
  • Figure 64: Middle East & Africa Market Attractiveness Analysis by Type
  • Figure 65: Middle East & Africa Market Value Share and BPS Analysis by End User, 2025 and 2035
  • Figure 66: Middle East & Africa Market Y-o-Y Growth Comparison by End User, 2025-2035
  • Figure 67: Middle East & Africa Market Attractiveness Analysis by End User
  • Figure 68: Global Market - Tier Structure Analysis
  • Figure 69: Global Market - Company Share Analysis

Frequently Asked Questions

How big is the embedded finance market in 2025?

The global embedded finance market is estimated to be valued at USD 85.8 billion in 2025.

What will be the size of embedded finance market in 2035?

The market size for the embedded finance market is projected to reach USD 370.9 billion by 2035.

How much will be the embedded finance market growth between 2025 and 2035?

The embedded finance market is expected to grow at a 15.8% CAGR between 2025 and 2035.

What are the key product types in the embedded finance market?

The key product types in embedded finance market are embedded banking, embedded insurance, embedded investments, embedded lending and embedded payment.

Which end user segment to contribute significant share in the embedded finance market in 2025?

In terms of end user, loans associations segment to command 41.8% share in the embedded finance market in 2025.

Explore Similar Insights

Future Market Insights

Embedded Finance Market

Chat With

MaRIA

Hi There, I am MaRIA, Your Market Research Intelligence Assistant. How may I help you?