

- Market Size (2026)
- USD 1.1 Bn
- Forecast (2036)
- USD 2.7 Bn
- CAGR (2026 to 2036)
- 9.4%
Engine Condition Monitoring for Safety-Critical Parameters Market Size, Market Forecast and Outlook By FMI
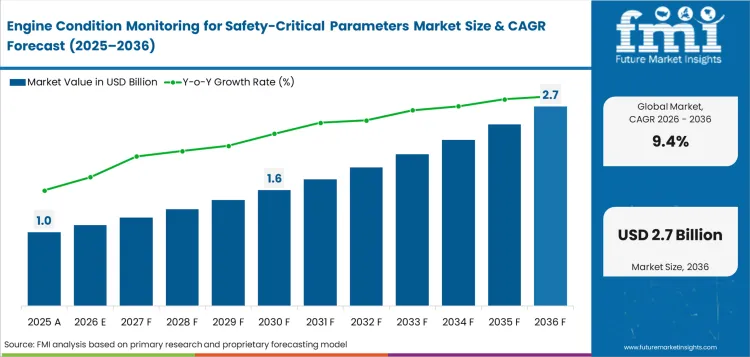
The engine condition monitoring for safety-critical parameters market is estimated at USD 1.0 billion in 2025 and is estimated at USD 1.1 billion by the end of 2026. With demand projected to rise at a 9.4% CAGR from 2026 to 2036, the market is projected to reach USD 2.7 billion by 2036. Commercial aircraft are projected to account for 61.0% platform share, and turbofan engines are expected to lead the engine type segment with a 54.0% share.
Summary of the Engine Condition Monitoring for Safety-Critical Parameters Market
- Demand and Growth Drivers
- Airline engine service planning drives demand as operators need earlier warnings before unscheduled removals affect aircraft availability.
- Safety-critical parameter review gains value as vibration and oil debris data improve fault isolation.
- Connected MRO workflows lift demand as service providers link engine alerts with planned shop visits.
- Product and Segment View
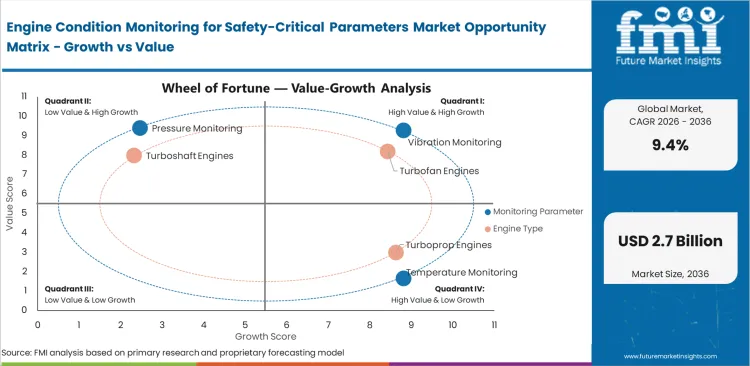
- Vibration monitoring is projected to hold 32.5% share in 2026 as rotating engine parts need early imbalance and bearing fault detection.
- With a 61.0% platform share expected in 2026, commercial aircraft are expected to account for the largest demand base due to intensive flight-cycle exposure.
- Turbofan engines retain high-revenue demand as airline fleets rely on frequent temperature review and vibration evidence during maintenance planning.
- Geography and Competitive Outlook
- India is expected to record a CAGR of 11.2% through 2036, as fleet expansion and airport additions raise monitoring needs.
- China is projected to expand at 10.4% CAGR by 2036, as commercial airport activity deepens engine data use.
- Companies combining engine analytics depth with service network access are strengthening market position during the forecast period.
- Analyst Opinion
- Nikhil Kaitwade, Principal Consultant for the Aviation domain at FMI, says, “Engine condition monitoring is a safety-critical decision layer for airlines and MRO teams. Maintenance groups need vibration evidence with temperature drift signals in one workflow. Certified sensors and reliable analytics reduce repeat troubleshooting while integration quality shapes long-cycle vendor selection.”
- Engine Condition Monitoring for Safety-Critical Parameters Market Value Analysis
- Engine condition monitoring for safety-critical parameters is shifting from scheduled inspection routines toward continuous data review across active aircraft fleets.
- Safety teams are placing higher value on verified engine data as turbofan platforms and high-cycle aircraft face tighter reliability expectations.
- Aircraft maintenance programs are using a condition monitoring system more deeply to connect engine alerts with fault review and service timing.
- Airline operators value alert records as they help align safety review needs with engine maintenance planning decisions.
Key Takeaways, Market Size and Forecast
- The engine condition monitoring for safety-critical parameters market was valued at USD 1.0 billion in 2025.
- By 2036, the engine condition monitoring for safety-critical parameters market is projected to reach USD 2.7 billion.
- From 2026 to 2036, the market is projected to expand at a CAGR of 9.4%.
- The market is projected to create an incremental opportunity of USD 1.6 billion between 2026 and 2036.
- In 2026, commercial aircraft are expected to account for 61.0% of platform demand.
- India and China are projected to expand faster than most country markets, advancing at 11.2% and 10.4% CAGR, respectively.
Engine faults can delay flights and raise safety review work, so airlines are using engine data to find problems earlier. CFM International expanded engine health monitoring for LEAP-1A and LEAP-1B engines in April 2024, applying probabilistic diagnostic and prognostic machine-learning tools to multi-sensor data captured during takeoff, climb, and cruise. This supports airline need for monitoring tools that turn engine signals into clear maintenance actions.
Honeywell’s 2025 technical update listed around 90,000 RTDL RS-422 parameters within its Ensemble architecture. This broader data access helps service teams review engine trends with better detail. Lufthansa Technik said in February 2025 that AVIATAR Technical Repetitives Examination had been rolled out at more than 20 airlines. This shows airlines want tools which organize technical logbook entries into repeat fault patterns across fleets.
Engine Condition Monitoring for Safety-Critical Parameters Market Definition
The engine condition monitoring for safety-critical parameters market includes systems used to track engine operating signals before fault escalation. These systems assess vibration, temperature, pressure, oil debris, and fuel flow across aircraft engines. Scope includes sensors, data acquisition units, analytics software, cockpit displays, and service dashboards. Airframe health systems and general industrial motor monitoring are outside the scope.
Engine Condition Monitoring for Safety-Critical Parameters Market Inclusions
Market scope covers all commercially traded engine condition monitoring solutions categorized by monitoring parameter, including vibration, temperature, pressure, fuel flow, and oil debris monitoring; engine type, including turbofan, turboprop, turboshaft, and piston engines; system component, including sensors, data acquisition units, analytics software, and cockpit displays; and platform, including commercial aircraft, business aircraft, defense aircraft, and rotorcraft; and sales channel, including aftermarket services, line-fit systems, retrofit kits, and software subscriptions. Revenue scope covers 2026 to 2036. The key stakeholders include engine monitoring system providers, aircraft engine manufacturers, sensor and actuator suppliers, avionics companies, airline operators, MRO service providers, defense aviation agencies, aircraft OEMs, software analytics vendors, system integrators, distributors, and aviation safety regulators.
Engine Condition Monitoring for Safety-Critical Parameters Market Exclusions
Scope does not include airframe structural health monitoring, cabin environment monitoring, general vehicle telematics, finished aircraft sales, or non-aviation industrial engine diagnostics.
Engine Condition Monitoring for Safety-Critical Parameters Market Research Methodology
- Primary Research: FMI analysts spoke to airline maintenance teams, engine OEM service groups, MRO providers, and aviation sensor specialists.
- Desk Research: Combined aviation safety publications, regulatory references, company service portfolios, and engine monitoring product information.
- Market sizing and forecasting: Added platform demand across engine types, component groups, and service channels from the bottom up.
- Data validation: Cross-checked quarterly against aviation traffic signals, fleet activity, and company engine service coverage.
Why is the Engine Condition Monitoring for Safety-Critical Parameters Market Growing?
- Airline fleets are using safety-critical engine data earlier to reduce avoidable removals before scheduled maintenance windows.
- Monitoring partners are becoming important as engines combine thermal loads, rotating assemblies, and electronic control systems.
- MRO teams are using analytics platforms to connect engine alerts with service planning and parts readiness.
Airline utilization creates a direct need for better engine signal review across high-cycle fleets. IATA reported in January 2026 full-year passenger demand in 2025 rose 5.3% compared with 2024. Higher traffic intensity raises pressure on dispatch reliability across commercial aircraft. Engine monitoring vendors gain importance as airlines need early warnings before delays become service disruptions.
Safety authorities are placing more attention on operational learning across aviation systems. EASA reported in August 2025 European traffic reached over 7.7 million flights in 2024. This flight volume creates a large base of engine operating data for safety teams. Parameter monitoring helps service teams compare abnormal readings with prior fleet patterns.
Market Segmentation Analysis
- Vibration monitoring is projected to hold 32.5% share in 2026, as rotating assemblies need early imbalance and bearing fault detection.
- Turbofan engines are expected to represent 54.0% of engine type revenue in 2026, reflecting heavy use across airline-operated fleets.
- Sensors lead the system component segment with an predicted 38.5% share in 2026, as every alert starts with reliable signal capture.
- Commercial aircraft are forecast to contribute 61.0% of platform use in 2026, driven by frequent engine review across high-cycle fleet operations.
- Aftermarket services are projected to capture 47.5% of sales channel activity in 2026, as active fleets need retrofit monitoring during service intervals.
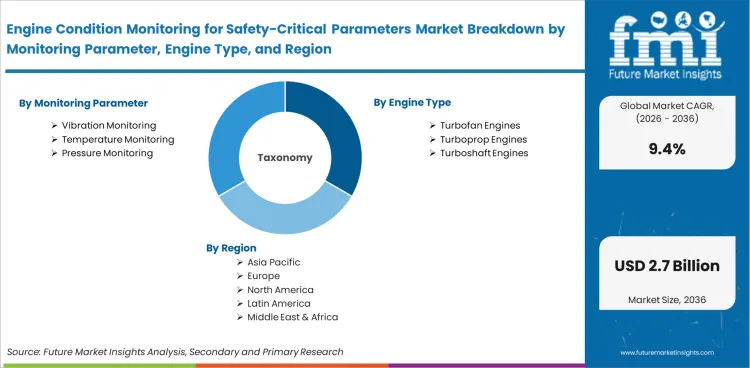
The market for engine condition monitoring for safety-critical parameters is divided into groups based on monitoring parameter, engine type, system component, platform, sales channel, and region. There are vibration monitoring, temperature monitoring, pressure monitoring, fuel monitoring, and oil debris monitoring under monitoring parameter. By engine type, the market includes turbofan engines, turboprop engines, turboshaft engines, and piston engines. By system component, the market covers sensors, data acquisition units, analytics software, and cockpit displays. Based on platform, it includes commercial aircraft, business aircraft, defense aircraft, and rotorcraft. By sales channel, the market includes aftermarket services, line-fit systems, retrofit kits, and software subscriptions.
Insights into Engine Condition Monitoring for Safety-Critical Parameters Market by Monitoring Parameter
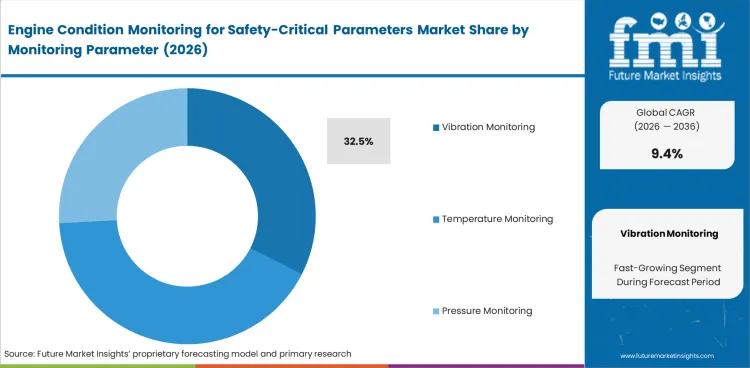
- In 2026, vibration monitoring is expected to contribute 32.5% of the monitoring parameter segment. Vibration signals help operators detect imbalance and bearing wear before engine faults affect safety decisions.
- Temperature and oil debris monitoring serve selected engine health needs. Their value improves in programs requiring thermal drift review and wear-particle evidence.
Insights into Engine Condition Monitoring for Safety-Critical Parameters Market by Engine Type
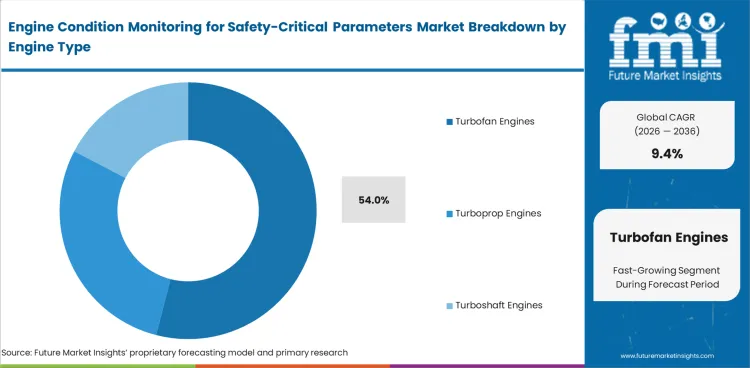
- Turbofan engines are projected to account for 54.0% of the engine type segment in 2026. Commercial aircraft fleets require frequent engine data review to protect dispatch reliability and maintenance planning.
- Turboprop and turboshaft engines serve specific aircraft groups. Their demand improves in regional aviation and rotorcraft operations with recurring duty-cycle stress.
Insights into Engine Condition Monitoring for Safety-Critical Parameters Market by System Component
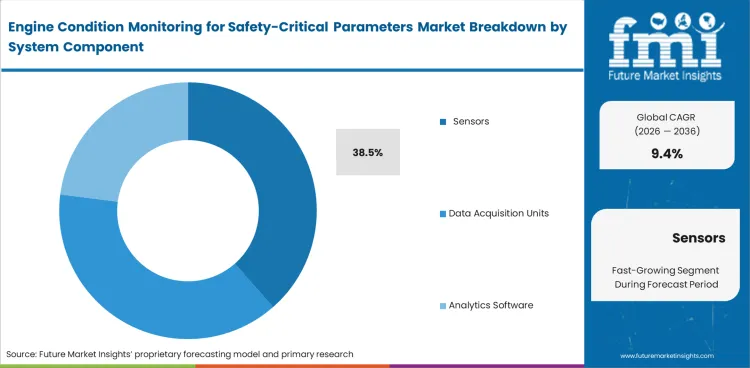
- Sensors are expected to contribute 38.5% share of the system component segment in 2026. Accurate signal capture helps monitoring systems convert engine behavior into usable safety alerts.
- Analytics software adds value after sensor installation. Its role improves as airlines need faster fault interpretation and maintenance records connected to service workflows.
Insights into Engine Condition Monitoring for Safety-Critical Parameters Market by Platform
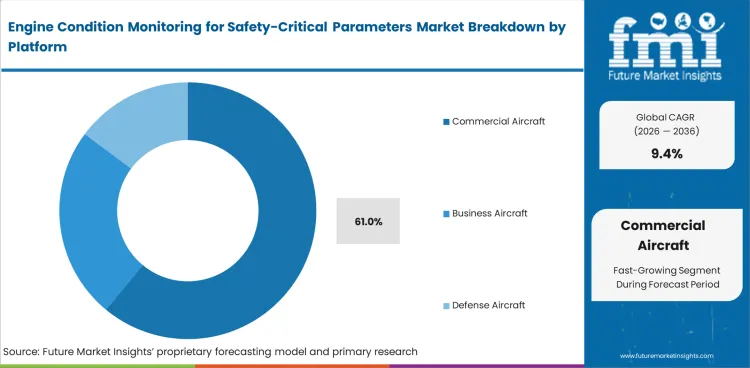
- Commercial aircraft are forecast to hold 61.0% of the platform segment in 2026. Airline fleets generate frequent engine operating data across short-haul and long-haul schedules.
- Business aircraft and defense aircraft address selected monitoring needs. Their value improves in fleets requiring high availability and mission-ready engine records.
Insights into Engine Condition Monitoring for Safety-Critical Parameters Market by Sales Channel
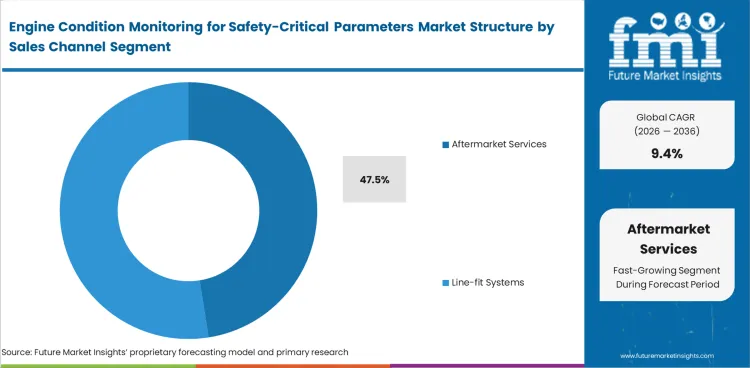
- Aftermarket services are projected to hold 47.5% share in 2026. Active fleets prefer service-based monitoring upgrades to improve visibility without waiting for new aircraft deliveries.
- Line-fit systems serve new aircraft programs requiring integrated engine data links. Retrofit kits support older fleets needing practical installation during scheduled maintenance.
Engine Condition Monitoring for Safety-Critical Parameters Market Drivers, Restraints, and Opportunities
- Flight-cycle pressure enhances demand for engine alerts across commercial aircraft maintenance teams.
- Certified sensors and secure data links increase pricing pressure for smaller operators and regional fleets.
- Connected maintenance improves service opportunity through AI-driven predictive maintenance and airline data integration.
Engine condition monitoring for safety-critical parameters keeps growing as aircraft engines need clear fault signals and reliable data review before safety risks affect flight operations. Cost pressure and limits on retrofit installation can slow wider adoption across older fleets. Growth continues through connected engine analytics and airline MRO applications.
Supply-Chain Scarcity Is Lifting Monitoring Premiums
Cost evidence from October 2025 indicates that price pressure is strong if engine monitoring reduces shop visit uncertainty. Price pressure is weaker when engine monitoring only reports data without improving decision outcomes. IATA said aerospace supply-chain delays are set to cost airlines more than US$11 billion in 2025, including US$3.1 billion in additional maintenance, US$2.6 billion in engine leasing while engines are in maintenance, and US$1.4 billion in surplus inventory.
This shifts purchasing behavior for safety-critical engine condition monitoring as operators show greater willingness to pay premiums. They pay more for vibration analytics and EGT margin tools to speed troubleshooting. They value oil pressure monitoring and exceedance analytics to protect dispatch reliability. Vendors can raise prices on retrofit kits and analytics subscriptions when contracts include clear performance terms. They can charge more for expedited integration when uptime metrics are explicit.
Higher Utilization Is Making Retrofit Prices Sticky
May 2026 FAA fleet and utilization data point to stickier pricing for certified engine-monitoring retrofits, especially in turbine and commercial fleets where system downtime is expensive. FAA forecasts the USA commercial aircraft fleet rising from 6,949 aircraft in 2025 to 10,677 in 2046, while the cargo large-jet fleet moves from 894 to 1,598 aircraft. It projects turbine aircraft hours including rotorcraft to rise by 2.6 percent annually between 2024 and 2046.
Jet aircraft hours are expected to increase by 3.2 percent annually over the same period. For buyers, this trend supports longer service queues and reduces discounting on sensors and data acquisition hardware. It limits discounts on secure connectivity and certification labor as demand continues rising. Price negotiations are likely to shift toward fleetwide packages and lifecycle support credits instead of simple unit price reductions.
Analysis of Engine Condition Monitoring for Safety-Critical Parameters Market By Key Countries
.webp "Top Country Growth Comparison Engine Condition Monitoring For Safety Critical Parameters Market Cagr (2026 2036)")
| Country | CAGR |
|---|---|
| India | 11.2% |
| China | 10.4% |
| USA | 8.8% |
| UK | 7.6% |
| Germany | 6.9% |
Source: Future Market Insights, 2026.
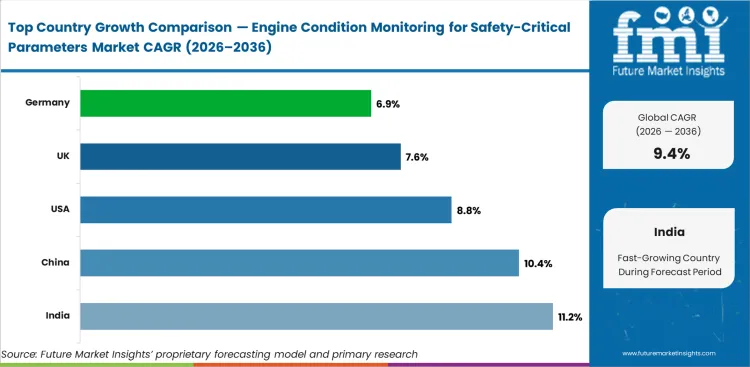
Engine Condition Monitoring for Safety-Critical Parameters Market CAGR Analysis By Country
- India is projected to record an 11.2% CAGR through 2036, helped by airport expansion and growing airline fleet requirements for engine data review.
- China’s 10.4% CAGR points to deeper monitoring needs across large airline networks and high commercial airport activity.
- In the USA, demand is forecast to rise at 8.8% CAGR as mature MRO practices favor engine health records.
- The UK is expected to advance at 7.6% CAGR, with dense airport operations increasing reliance on airline maintenance systems.
- Germany is forecast at 6.9% CAGR as established MRO capacity and Lufthansa service channels keep expansion controlled.
Demand for engine condition monitoring for safety-critical parameters is forecast to rise at 9.4% CAGR from 2026 to 2036. Country-level analysis covers the major markets contributing to this forecast, with the key markets listed below.
Demand Outlook for Engine Condition Monitoring for Safety-Critical Parameters Market in India
India’s engine condition monitoring for safety-critical parameters industry is projected to record a CAGR of 11.2% through 2036. India increased airports from 74 in 2014 to 163 in 2025 under its aviation expansion agenda. This airport base raises flight activity and raises demand for India engine condition monitoring for safety-critical parameters.
- Delhi and Mumbai route density creates stronger need for turbofan vibration checks across short-haul aircraft cycles.
- UDAN regional airport expansion increases demand for monitoring kits suitable for smaller aircraft and mixed fleets.
- Indian MRO hubs in Hyderabad and Bengaluru can benefit from service engine analytics work.
Sales Analysis of Engine Condition Monitoring for Safety-Critical Parameters Market in China
The engine condition monitoring for safety-critical parameters sector in China is expected to expand at a CAGR of 10.4% during the assessment period. CAAC reported in April 2026 national commercial airports completed 1.529 billion passenger trips in 2025. This traffic base aids demand for China engine condition monitoring for safety-critical parameters.
- Beijing Capital and Shanghai Pudong boost demand for continuous engine data review across dense airline rotations.
- CAAC safety oversight favors systems with traceable alert records and documented parameter review.
- Domestic narrowbody fleet expansion raises need for aircraft automated inspection and monitoring across service networks.
Demand Outlook for Engine Condition Monitoring for Safety-Critical Parameters Market in the United States
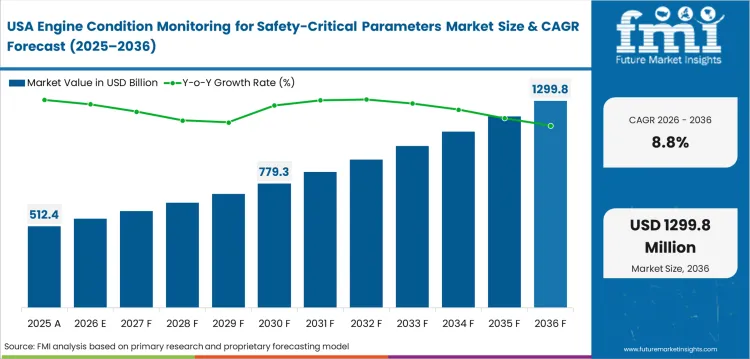
The USA engine condition monitoring for safety-critical parameters industry is forecast to grow at a CAGR of 8.8% by 2036. FAA forecast the commercial aircraft fleet to expand at an average annual rate of 1.7% from 2024 to 2045. Engine service teams value monitoring partners with FAA evidence awareness and study documentation discipline.
- Atlanta and Dallas-Fort Worth hub activity creates heavy turbofan use and regular maintenance planning needs.
- FAA oversight favors validated monitoring records across airline safety management systems.
- USA cargo fleets increase interest in predictive maintenance for engine availability.
Opportunity Analysis of Engine Condition Monitoring for Safety-Critical Parameters Market in Germany
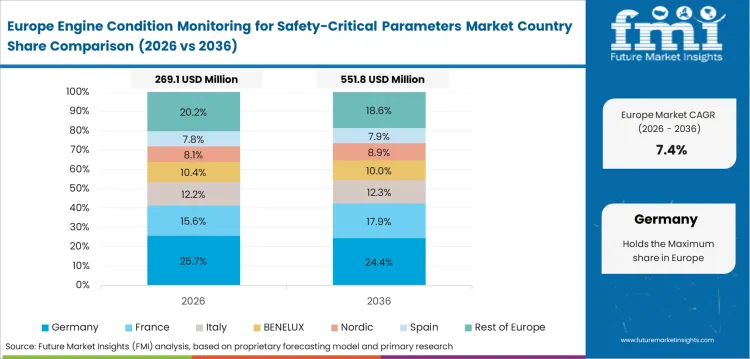
The engine condition monitoring for safety-critical parameters segment in Germany is projected to advance at 6.9% CAGR over the forecast years. Destatis reported in April 2026 aviation tax was payable for roughly 84.0 million air passengers in 2025. This passenger activity sustains monitoring needs around German airline and airport operations.
- Frankfurt airport concentration increases the need for fast fault review across high-utilization aircraft rotations.
- Lufthansa Technik facilities in Hamburg make a strong service base for engine analytics and MRO integration.
- German premium travel demand favors cockpit alerts and service dashboards across business aviation fleets.
Future Outlook for Engine Condition Monitoring for Safety-Critical Parameters Market in the United Kingdom
The UK engine condition monitoring for safety-critical parameters industry is expected to post 7.6% CAGR through 2036. UK CAA reported in February 2026 over 300 million passenger journeys through UK airports in 2025. This favors demand for UK engine condition monitoring for safety-critical parameters as airlines work through dense airport schedules.
- Heathrow and Gatwick activity enhances demand for service dashboards suited to frequent engine health review.
- UK CAA safety oversight favors repeatable monitoring records across airline maintenance control centers.
- London Luton expansion plans can lift long-term demand for monitoring across regional and leisure aircraft fleets.
Company Positioning and Strategic Context
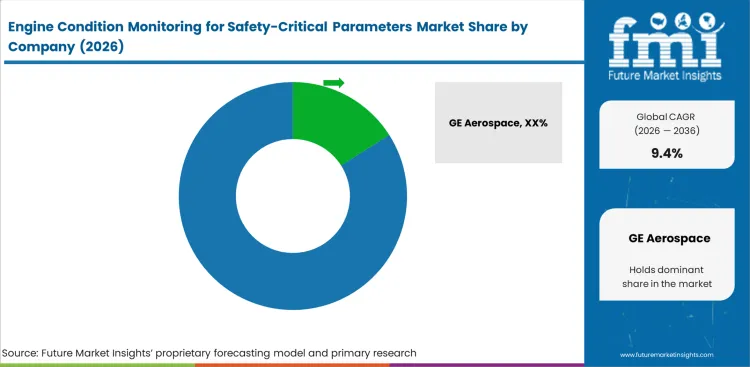
- GE Aerospace has a strong position in airline engine monitoring through EMS analytics and deep service records across active fleets.
- Rolls-Royce and Pratt & Whitney compete on engine care contracts and long-term fleet evidence across airline customer bases.
- Specialist service firms address retrofit needs for operators seeking focused alerts and direct MRO system connection.
Supplier selection is increasingly about proof quality after an alert is raised inside the maintenance workflow. GE Aerospace uses EMS analytics and engine service experience to strengthen its role in airline maintenance programs. Rolls-Royce builds its position through long-term care contracts across active engine fleets. Pratt & Whitney brings EngineWise coverage and GTF service depth into shop visit planning. Honeywell Aerospace serves business aviation through connected engine monitoring and post-flight data services.
Cost and data control limit easy switching among monitoring providers in airline maintenance systems. Certified sensors raise the entry barrier for smaller firms serving safety-critical engine programs. Airlines need alerts precise enough to guide fault review without creating extra inspection work. Providers able to pair validated alerts with MRO execution records will have a stronger position in airline and business aviation accounts.
Key Companies in the Engine Condition Monitoring for Safety-Critical Parameters Market
Key global companies leading the engine condition monitoring for safety-critical parameters market include:
- GE Aerospace, Rolls-Royce, and Pratt & Whitney have strong engine service infrastructure for monitoring workflows and fleet analytics.
- Honeywell Aerospace, Safran Aircraft Engines, and Lufthansa Technik serve operators through connected maintenance coverage and service reporting.
- MTU Aero Engines holds a specialist service position across engine maintenance, performance review, and repair planning.
Company Benchmarking: Engine Condition Monitoring for Safety-Critical Parameters Market
| Company | Engine Data Capture Depth | Analytics Workflow Strength | MRO Integration Reach | Geographic Footprint |
|---|---|---|---|---|
| GE Aerospace | High | High | Strong | Global footprint across the United States, Europe, Asia Pacific, India, China, South Korea, Middle East, and Latin America. GE Aerospace states it has 60+ manufacturing locations and 15+ overhaul and component locations across 22 countries. |
| Rolls-Royce | High | High | Strong | Global civil aerospace and defense footprint across 50+ countries, with major hubs in the UK, USA, Germany, India, Singapore, Canada, and Japan. |
| Pratt & Whitney | High | Medium | Strong | Strong North American base with global engine service reach. Pratt & Whitney Canada lists 50+ owned and designated engine and APU service facilities worldwide. |
| Honeywell Aerospace | Medium | High | Strong | Broad aerospace footprint across North America, Latin America, Europe, India, Asia Pacific, and the Middle East. |
| Safran Aircraft Engines | High | Medium | Medium | France-centered global engine footprint with locations and representative offices across the United States, China, Middle East, and other international aerospace hubs. |
| Lufthansa Technik | Medium | High | Strong | Global MRO network headquartered in Hamburg, with more than 35 operating subsidiaries and affiliates across EMEA, Asia Pacific, and the Americas. |
| MTU Aero Engines | Medium | Medium | Strong | Germany-headquartered footprint with maintenance, repair, leasing, component repair, and representative locations across Europe, North America, and Asia. |
Source: Future Market Insights, 2026.
Key Developments in Engine Condition Monitoring for Safety-Critical Parameters Market
- In November 2025, Lufthansa Technik Defense signed a multi-year sustainment contract with Boeing for Germany’s P-8A Poseidon fleet, including dedicated Engine Condition Monitoring for the aircraft’s two CFM56-7B power plants. The development focuses on early fault detection, performance degradation tracking, time-on-wing improvement, and prevention of unscheduled removals in a safety-critical maritime patrol environment. Lufthansa Technik stated the monitoring program is designed to identify engine faults and defects early, especially under demanding salt-water operating conditions.
- In April 2024, CFM International expanded engine health monitoring for LEAP-1A and LEAP-1B engines by applying probabilistic diagnostic and prognostic machine-learning tools to multi-sensor data captured during takeoff, climb, and cruise. The development improves early detection of engine operating signatures and supports targeted maintenance alerts for commercial aircraft fleets. CFM reported 60% earlier lead time for preventive maintenance recommendations, a 45% increase in detection rates, and a reduction in false alerts by half over the past decade.
Key Players in the Engine Condition Monitoring for Safety-Critical Parameters Market
Major Global Players:
- GE Aerospace
- Rolls-Royce
- Pratt & Whitney
- Honeywell Aerospace
- Safran Aircraft Engines
Specialist Players:
- Lufthansa Technik
- MTU Aero Engines
Report Scope and Coverage
| Parameter | Details |
|---|---|
| Quantitative Units | USD 1.1 billion to USD 2.7 billion, at a CAGR of 9.4% |
| Market Definition | Engine monitoring systems used to assess safety-critical operating signals before fault escalation or removal decisions. |
| Regions Covered | North America, Latin America, Europe, East Asia, South Asia and Pacific, Middle East and Africa |
| Countries Covered | USA, UK, Germany, China, India, Japan, South Korea, and 30 plus countries |
| Key Companies Profiled | GE Aerospace, Rolls-Royce, Pratt & Whitney, Honeywell Aerospace, Safran Aircraft Engines, Lufthansa Technik, MTU Aero Engines |
| Forecast Period | 2026 to 2036 |
| Approach | Hybrid bottom-up and top-down methodology starting with platform demand and verified engine service use patterns. |
Engine Condition Monitoring for Safety-Critical Parameters Market by Segments
Engine Condition Monitoring for Safety-Critical Parameters Market Segmented by Monitoring Parameter:
- Vibration Monitoring
- Temperature Monitoring
- Pressure Monitoring
- Fuel Monitoring
- Oil Debris Monitoring
Engine Condition Monitoring for Safety-Critical Parameters Market Segmented by Engine Type:
- Turbofan Engines
- Turboprop Engines
- Turboshaft Engines
- Piston Engines
Engine Condition Monitoring for Safety-Critical Parameters Market Segmented by System Component:
- Sensors
- Data Acquisition Units
- Analytics Software
- Cockpit Displays
Engine Condition Monitoring for Safety-Critical Parameters Market Segmented by Platform:
- Commercial Aircraft
- Business Aircraft
- Defense Aircraft
- Rotorcraft
Engine Condition Monitoring for Safety-Critical Parameters Market Segmented by Sales Channel:
- Aftermarket Services
- Line-fit Systems
- Retrofit Kits
- Software Subscriptions
Engine Condition Monitoring for Safety-Critical Parameters Market Segmented by Region:
- North America
- USA
- Canada
- Mexico
- Latin America
- Brazil
- Chile
- Rest of Latin America
- Europe
- Germany
- UK
- Italy
- Spain
- France
- Rest of Europe
- East Asia
- China
- Japan
- South Korea
- South Asia and Pacific
- India
- ASEAN
- Australia & New Zealand
- Rest of South Asia and Pacific
- Middle East and Africa
- Saudi Arabia
- Other GCC Countries
- South Africa
- Rest of Middle East and Africa
Research Sources and Bibliography
- International Air Transport Association. (2026, January). Strong 2025 passenger demand masks ongoing capacity constraints. IATA official source
- Federal Aviation Administration. (2025). FAA Aerospace Forecast Fiscal Years 2025 to 2045. FAA official source
- European Union Aviation Safety Agency. (2025, August). Annual Safety Review 2025. EASA official source
- Press Information Bureau. (2025, October). India’s Aviation Vision 2047. PIB official source
- Civil Aviation Administration of China. (2026, April). Statistical Bulletin of Civil Aviation Industry Development 2025. CAAC official source
- Destatis. (2026, April). Aviation tax declared in 2025 for roughly 84.0 million air passengers. Destatis official source
- UK Civil Aviation Authority. (2026, February). UK aviation officially breaks records with over 300m passenger journeys in 2025. UK CAA official source
- CFM International. (2024, April 10). CFM advances LEAP engine health monitoring.
- Honeywell. (2024, October). Honeywell unveils new engine data service to enhance customer experience. Honeywell Aerospace official source
- Pratt & Whitney. (2024, April). GTF MRO capacity expansion at West Palm Beach facility. RTX official source
- Honeywell Aerospace. (2025). Technical publications update: Honeywell Ensemble connected engine [Presentation].
- Lufthansa Technik. (2025, February 25). AVIATAR adds “Technical Repetitives Examination” to its Reliability Suite.
- Federal Aviation Administration. (2026). FAA Aerospace Forecast Fiscal Years 2026-2046. USA Department of Transportation. FAA Aerospace Forecast Fiscal Years 2026-2046
- International Air Transport Association. (2025, October 13). Supply Chain Challenges Could Cost Airlines More than $11 Billion in 2025. IATA. IATA - Supply Chain Challenges Could Cost Airlines More than $11 Billion in 2025
- CFM International. (2024, April 10). CFM advances LEAP engine health monitoring. CFM advances LEAP engine health monitoring
- Lufthansa Technik. (2025, November 20). Boeing contracts Lufthansa Technik Defense for sustainment of German Navy’s P-8A Poseidon [Press release]. Boeing contracts Lufthansa Technik Defense for sustainment of German Navy’s P-8A Poseidon
This bibliography is provided for reader reference and is not exhaustive. The full report contains the complete reference list and detailed citations.
Frequently Asked Questions
What is the global market demand for Engine Condition Monitoring for Safety-Critical Parameters in 2026?
In 2026, the global market for engine condition monitoring for safety-critical parameters is estimated at USD 1.1 billion.
How big will the market for Engine Condition Monitoring for Safety-Critical Parameters be in 2036?
By 2036, the market for engine condition monitoring for safety-critical parameters is projected to reach USD 2.7 billion.
How much is demand for Engine Condition Monitoring for Safety-Critical Parameters expected to expand between 2026 and 2036?
Between 2026 and 2036, demand for engine condition monitoring for safety-critical parameters is expected to expand at a CAGR of 9.4%.
Which monitoring parameter segment is expected to lead globally by 2026?
Vibration monitoring is expected to contribute 32.5% of the monitoring parameter segment in 2026.
What is causing demand to rise in India?
The India engine condition monitoring for safety-critical parameters market is projected to record 11.2% CAGR through 2036, aided by fleet expansion and airport additions.
Preview the report firsthand - request a free sample
Get SampleGet the brochure for pricing and purchase details.
Get PDFTable of Content
- Executive Summary
- Global Market Outlook
- Demand-side Trends
- Supply-side Trends
- Technology Roadmap Analysis
- Analysis and Recommendations
- Market Overview
- Market Coverage / Taxonomy
- Market Definition / Scope / Limitations
- Research Methodology
- Chapter Orientation
- Analytical Lens and Working Hypotheses
- Market Structure, Signals, and Trend Drivers
- Benchmarking and Cross-market Comparability
- Market Sizing, Forecasting, and Opportunity Mapping
- Research Design and Evidence Framework
- Desk Research Programme (Secondary Evidence)
- Company Annual and Sustainability Reports
- Peer-reviewed Journals and Academic Literature
- Corporate Websites, Product Literature, and Technical Notes
- Earnings Decks and Investor Briefings
- Statutory Filings and Regulatory Disclosures
- Technical White Papers and Standards Notes
- Trade Journals, Industry Magazines, and Analyst Briefs
- Conference Proceedings, Webinars, and Seminar Materials
- Government Statistics Portals and Public Data Releases
- Press Releases and Reputable Media Coverage
- Specialist Newsletters and Curated Briefings
- Sector Databases and Reference Repositories
- FMI Internal Proprietary Databases and Historical Market Datasets
- Subscription Datasets and Paid Sources
- Social Channels, Communities, and Digital Listening Inputs
- Additional Desk Sources
- Expert Input and Fieldwork (Primary Evidence)
- Primary Modes
- Qualitative Interviews and Expert Elicitation
- Quantitative Surveys and Structured Data Capture
- Blended Approach
- Why Primary Evidence is Used
- Field Techniques
- Interviews
- Surveys
- Focus Groups
- Observational and In-context Research
- Social and Community Interactions
- Stakeholder Universe Engaged
- C-suite Leaders
- Board Members
- Presidents and Vice Presidents
- R&D and Innovation Heads
- Technical Specialists
- Domain Subject-matter Experts
- Scientists
- Physicians and Other Healthcare Professionals
- Governance, Ethics, and Data Stewardship
- Research Ethics
- Data Integrity and Handling
- Primary Modes
- Tooling, Models, and Reference Databases
- Desk Research Programme (Secondary Evidence)
- Data Engineering and Model Build
- Data Acquisition and Ingestion
- Cleaning, Normalisation, and Verification
- Synthesis, Triangulation, and Analysis
- Quality Assurance and Audit Trail
- Market Background
- Market Dynamics
- Drivers
- Restraints
- Opportunity
- Trends
- Scenario Forecast
- Demand in Optimistic Scenario
- Demand in Likely Scenario
- Demand in Conservative Scenario
- Opportunity Map Analysis
- Product Life Cycle Analysis
- Supply Chain Analysis
- Investment Feasibility Matrix
- Value Chain Analysis
- PESTLE and Porter’s Analysis
- Regulatory Landscape
- Regional Parent Market Outlook
- Production and Consumption Statistics
- Import and Export Statistics
- Market Dynamics
- Global Market Analysis 2021 to 2025 and Forecast, 2026 to 2036
- Historical Market Size Value (USD Million) Analysis, 2021 to 2025
- Current and Future Market Size Value (USD Million) Projections, 2026 to 2036
- Y-o-Y Growth Trend Analysis
- Absolute $ Opportunity Analysis
- Global Market Pricing Analysis 2021 to 2025 and Forecast 2026 to 2036
- Global Market Analysis 2021 to 2025 and Forecast 2026 to 2036, By Product Type
- Introduction / Key Findings
- Historical Market Size Value (USD Million) Analysis By Product Type , 2021 to 2025
- Current and Future Market Size Value (USD Million) Analysis and Forecast By Product Type , 2026 to 2036
- Premium
- Standard
- Luxury
- Premium
- Y-o-Y Growth Trend Analysis By Product Type , 2021 to 2025
- Absolute $ Opportunity Analysis By Product Type , 2026 to 2036
- Global Market Analysis 2021 to 2025 and Forecast 2026 to 2036, By Tea Type
- Introduction / Key Findings
- Historical Market Size Value (USD Million) Analysis By Tea Type, 2021 to 2025
- Current and Future Market Size Value (USD Million) Analysis and Forecast By Tea Type, 2026 to 2036
- Black tea
- Green Tea
- Herbal Tea
- Black tea
- Y-o-Y Growth Trend Analysis By Tea Type, 2021 to 2025
- Absolute $ Opportunity Analysis By Tea Type, 2026 to 2036
- Global Market Analysis 2021 to 2025 and Forecast 2026 to 2036, By Material Type
- Introduction / Key Findings
- Historical Market Size Value (USD Million) Analysis By Material Type, 2021 to 2025
- Current and Future Market Size Value (USD Million) Analysis and Forecast By Material Type, 2026 to 2036
- Corn-based PLA
- Nylon Mesh
- Silk Mesh
- Corn-based PLA
- Y-o-Y Growth Trend Analysis By Material Type, 2021 to 2025
- Absolute $ Opportunity Analysis By Material Type, 2026 to 2036
- Global Market Analysis 2021 to 2025 and Forecast 2026 to 2036, By Distribution Channel
- Introduction / Key Findings
- Historical Market Size Value (USD Million) Analysis By Distribution Channel, 2021 to 2025
- Current and Future Market Size Value (USD Million) Analysis and Forecast By Distribution Channel, 2026 to 2036
- Supermarkets and Hypermarkets
- Specialty Tea Stores
- Online Retail
- Supermarkets and Hypermarkets
- Y-o-Y Growth Trend Analysis By Distribution Channel, 2021 to 2025
- Absolute $ Opportunity Analysis By Distribution Channel, 2026 to 2036
- Global Market Analysis 2021 to 2025 and Forecast 2026 to 2036, By Pack Size
- Introduction / Key Findings
- Historical Market Size Value (USD Million) Analysis By Pack Size, 2021 to 2025
- Current and Future Market Size Value (USD Million) Analysis and Forecast By Pack Size, 2026 to 2036
- 20-Count Boxes
- Single Sachets
- Bulk Packs
- 20-Count Boxes
- Y-o-Y Growth Trend Analysis By Pack Size, 2021 to 2025
- Absolute $ Opportunity Analysis By Pack Size, 2026 to 2036
- Global Market Analysis 2021 to 2025 and Forecast 2026 to 2036, By Region
- Introduction
- Historical Market Size Value (USD Million) Analysis By Region, 2021 to 2025
- Current Market Size Value (USD Million) Analysis and Forecast By Region, 2026 to 2036
- North America
- Latin America
- Western Europe
- Eastern Europe
- East Asia
- South Asia and Pacific
- Middle East & Africa
- Market Attractiveness Analysis By Region
- North America Market Analysis 2021 to 2025 and Forecast 2026 to 2036, By Country
- Historical Market Size Value (USD Million) Trend Analysis By Market Taxonomy, 2021 to 2025
- Market Size Value (USD Million) Forecast By Market Taxonomy, 2026 to 2036
- By Country
- USA
- Canada
- Mexico
- By Product Type
- By Tea Type
- By Material Type
- By Distribution Channel
- By Pack Size
- By Country
- Market Attractiveness Analysis
- By Country
- By Product Type
- By Tea Type
- By Material Type
- By Distribution Channel
- By Pack Size
- Key Takeaways
- Latin America Market Analysis 2021 to 2025 and Forecast 2026 to 2036, By Country
- Historical Market Size Value (USD Million) Trend Analysis By Market Taxonomy, 2021 to 2025
- Market Size Value (USD Million) Forecast By Market Taxonomy, 2026 to 2036
- By Country
- Brazil
- Chile
- Rest of Latin America
- By Product Type
- By Tea Type
- By Material Type
- By Distribution Channel
- By Pack Size
- By Country
- Market Attractiveness Analysis
- By Country
- By Product Type
- By Tea Type
- By Material Type
- By Distribution Channel
- By Pack Size
- Key Takeaways
- Western Europe Market Analysis 2021 to 2025 and Forecast 2026 to 2036, By Country
- Historical Market Size Value (USD Million) Trend Analysis By Market Taxonomy, 2021 to 2025
- Market Size Value (USD Million) Forecast By Market Taxonomy, 2026 to 2036
- By Country
- Germany
- UK
- Italy
- Spain
- France
- Nordic
- BENELUX
- Rest of Western Europe
- By Product Type
- By Tea Type
- By Material Type
- By Distribution Channel
- By Pack Size
- By Country
- Market Attractiveness Analysis
- By Country
- By Product Type
- By Tea Type
- By Material Type
- By Distribution Channel
- By Pack Size
- Key Takeaways
- Eastern Europe Market Analysis 2021 to 2025 and Forecast 2026 to 2036, By Country
- Historical Market Size Value (USD Million) Trend Analysis By Market Taxonomy, 2021 to 2025
- Market Size Value (USD Million) Forecast By Market Taxonomy, 2026 to 2036
- By Country
- Russia
- Poland
- Hungary
- Balkan & Baltic
- Rest of Eastern Europe
- By Product Type
- By Tea Type
- By Material Type
- By Distribution Channel
- By Pack Size
- By Country
- Market Attractiveness Analysis
- By Country
- By Product Type
- By Tea Type
- By Material Type
- By Distribution Channel
- By Pack Size
- Key Takeaways
- East Asia Market Analysis 2021 to 2025 and Forecast 2026 to 2036, By Country
- Historical Market Size Value (USD Million) Trend Analysis By Market Taxonomy, 2021 to 2025
- Market Size Value (USD Million) Forecast By Market Taxonomy, 2026 to 2036
- By Country
- China
- Japan
- South Korea
- By Product Type
- By Tea Type
- By Material Type
- By Distribution Channel
- By Pack Size
- By Country
- Market Attractiveness Analysis
- By Country
- By Product Type
- By Tea Type
- By Material Type
- By Distribution Channel
- By Pack Size
- Key Takeaways
- South Asia and Pacific Market Analysis 2021 to 2025 and Forecast 2026 to 2036, By Country
- Historical Market Size Value (USD Million) Trend Analysis By Market Taxonomy, 2021 to 2025
- Market Size Value (USD Million) Forecast By Market Taxonomy, 2026 to 2036
- By Country
- India
- ASEAN
- Australia & New Zealand
- Rest of South Asia and Pacific
- By Product Type
- By Tea Type
- By Material Type
- By Distribution Channel
- By Pack Size
- By Country
- Market Attractiveness Analysis
- By Country
- By Product Type
- By Tea Type
- By Material Type
- By Distribution Channel
- By Pack Size
- Key Takeaways
- Middle East & Africa Market Analysis 2021 to 2025 and Forecast 2026 to 2036, By Country
- Historical Market Size Value (USD Million) Trend Analysis By Market Taxonomy, 2021 to 2025
- Market Size Value (USD Million) Forecast By Market Taxonomy, 2026 to 2036
- By Country
- Kingdom of Saudi Arabia
- Other GCC Countries
- Turkiye
- South Africa
- Other African Union
- Rest of Middle East & Africa
- By Product Type
- By Tea Type
- By Material Type
- By Distribution Channel
- By Pack Size
- By Country
- Market Attractiveness Analysis
- By Country
- By Product Type
- By Tea Type
- By Material Type
- By Distribution Channel
- By Pack Size
- Key Takeaways
- Key Countries Market Analysis
- USA
- Pricing Analysis
- Market Share Analysis, 2025
- By Product Type
- By Tea Type
- By Material Type
- By Distribution Channel
- By Pack Size
- Canada
- Pricing Analysis
- Market Share Analysis, 2025
- By Product Type
- By Tea Type
- By Material Type
- By Distribution Channel
- By Pack Size
- Mexico
- Pricing Analysis
- Market Share Analysis, 2025
- By Product Type
- By Tea Type
- By Material Type
- By Distribution Channel
- By Pack Size
- Brazil
- Pricing Analysis
- Market Share Analysis, 2025
- By Product Type
- By Tea Type
- By Material Type
- By Distribution Channel
- By Pack Size
- Chile
- Pricing Analysis
- Market Share Analysis, 2025
- By Product Type
- By Tea Type
- By Material Type
- By Distribution Channel
- By Pack Size
- Germany
- Pricing Analysis
- Market Share Analysis, 2025
- By Product Type
- By Tea Type
- By Material Type
- By Distribution Channel
- By Pack Size
- UK
- Pricing Analysis
- Market Share Analysis, 2025
- By Product Type
- By Tea Type
- By Material Type
- By Distribution Channel
- By Pack Size
- Italy
- Pricing Analysis
- Market Share Analysis, 2025
- By Product Type
- By Tea Type
- By Material Type
- By Distribution Channel
- By Pack Size
- Spain
- Pricing Analysis
- Market Share Analysis, 2025
- By Product Type
- By Tea Type
- By Material Type
- By Distribution Channel
- By Pack Size
- France
- Pricing Analysis
- Market Share Analysis, 2025
- By Product Type
- By Tea Type
- By Material Type
- By Distribution Channel
- By Pack Size
- India
- Pricing Analysis
- Market Share Analysis, 2025
- By Product Type
- By Tea Type
- By Material Type
- By Distribution Channel
- By Pack Size
- ASEAN
- Pricing Analysis
- Market Share Analysis, 2025
- By Product Type
- By Tea Type
- By Material Type
- By Distribution Channel
- By Pack Size
- Australia & New Zealand
- Pricing Analysis
- Market Share Analysis, 2025
- By Product Type
- By Tea Type
- By Material Type
- By Distribution Channel
- By Pack Size
- China
- Pricing Analysis
- Market Share Analysis, 2025
- By Product Type
- By Tea Type
- By Material Type
- By Distribution Channel
- By Pack Size
- Japan
- Pricing Analysis
- Market Share Analysis, 2025
- By Product Type
- By Tea Type
- By Material Type
- By Distribution Channel
- By Pack Size
- South Korea
- Pricing Analysis
- Market Share Analysis, 2025
- By Product Type
- By Tea Type
- By Material Type
- By Distribution Channel
- By Pack Size
- Russia
- Pricing Analysis
- Market Share Analysis, 2025
- By Product Type
- By Tea Type
- By Material Type
- By Distribution Channel
- By Pack Size
- Poland
- Pricing Analysis
- Market Share Analysis, 2025
- By Product Type
- By Tea Type
- By Material Type
- By Distribution Channel
- By Pack Size
- Hungary
- Pricing Analysis
- Market Share Analysis, 2025
- By Product Type
- By Tea Type
- By Material Type
- By Distribution Channel
- By Pack Size
- Kingdom of Saudi Arabia
- Pricing Analysis
- Market Share Analysis, 2025
- By Product Type
- By Tea Type
- By Material Type
- By Distribution Channel
- By Pack Size
- Turkiye
- Pricing Analysis
- Market Share Analysis, 2025
- By Product Type
- By Tea Type
- By Material Type
- By Distribution Channel
- By Pack Size
- South Africa
- Pricing Analysis
- Market Share Analysis, 2025
- By Product Type
- By Tea Type
- By Material Type
- By Distribution Channel
- By Pack Size
- USA
- Market Structure Analysis
- Competition Dashboard
- Competition Benchmarking
- Market Share Analysis of Top Players
- By Regional
- By Product Type
- By Tea Type
- By Material Type
- By Distribution Channel
- By Pack Size
- Competition Analysis
- Competition Deep Dive
- Dilmah Tea
- Overview
- Product Portfolio
- Profitability by Market Segments (Product/Age /Sales Channel/Region)
- Sales Footprint
- Strategy Overview
- Marketing Strategy
- Product Strategy
- Channel Strategy
- Twinings
- Harney & Sons
- Mighty Leaf Tea
- The Republic of Tea
- Dilmah Tea
- Competition Deep Dive
- Assumptions & Acronyms Used


