Enteral Formula Market Size and Share Forecast Outlook 2025 to 2035

The global enteral formula market is valued at USD 8.5 billion in 2025 and is slated to reach USD 16.7 billion by 2035, which shows a CAGR of 6.9%. This growth is driven by the rising prevalence of chronic diseases such as cancer, diabetes, and gastrointestinal disorders, along with the growing elderly population requiring nutritional support.
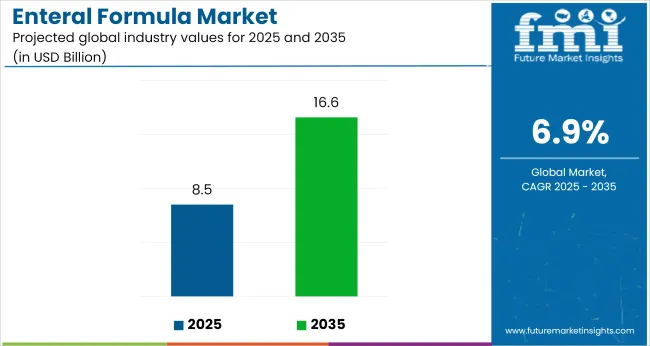
Quick Stats for Enteral Formula Market

  • Market Value (2025): USD 8.5 billion
  • Forecast Value (2035): USD 16.7 billion
  • Forecast CAGR: 6.9%
  • Administration Methods Leader in 2025:  Tube Feeding (70.6% Market Share)
  • Top Sales Channel Segment: Prescription-Based (68% Market Share in 2025)
  • Key Growth Region:  East Asia (Japan is the fastest-growing market with 7.5% CAGR)
Metric Value
Market Size 2025 USD 8.5 billion
Market Size 2035 USD 16.7 billion
CAGR (2025 to 2035) 6.9%

Additionally, technological advancements in delivery systems and increasing home healthcare trends are contributing significantly to market expansion globally.

The market will witness strong growth in Japan with the highest CAGR of 7.5%, driven by its aging population and advanced feeding technologies. The USA will follow with a CAGR of 7.2% due to strong healthcare infrastructure, chronic disease prevalence, and insurance coverage.

Germany will grow at 6.8% owing to rising clinical nutrition awareness and hospital admissions. Tube feeding is projected to dominate the administration method segment with a 70.6% share, while prescription-based sales will lead the sales channel with a 68% market share in 2025.

The enteral formula market holds a significant share within its parent markets. It accounts for approximately 35-40% of the clinical nutrition market, as enteral feeding is a primary method for delivering clinical nutrition to patients who cannot consume food orally.

Within the medical nutrition market, it holds around a 30-35% share, driven by its use in hospitals and home healthcare. In the food supplement and nutrition market, its share is relatively smaller at 10-12%, as this market includes broader supplements.

Enteral Formula Market Analysis by Top Investment Segments

The market segments include product, health claim, product format, sales channel, administration methods, feeding type, and region. The product segment covers standard formulas, elemental formulas, blenderized formulas (with real food ingredients), specialized formulas, high-protein formulas, fiber-enriched formulas, caloric-dense formulas, and peptide formulas (semi-elemental formulas).

The health claim segment includes adults, kids, and geriatric individuals. The product format segment comprises liquid formulas, powder formulas, semi-solid formulas, and ready-to-use formulas. The sales channel segment consists of prescription-based, over-the-counter, and online pharmacies.

The administration methods segment includes tube feeding and oral administration. The feeding type segment covers continuous, intermittent, and bolus. The regional segment includes North America, Latin America, Western Europe, Eastern Europe, East Asia, South Asia & Pacific, and MEA.

Standard Formulas to Lead Product Segment with 40% Market Share in 2025

The most lucrative segment under the product category is standard formulas, holding an estimated market share of approximately 40%.
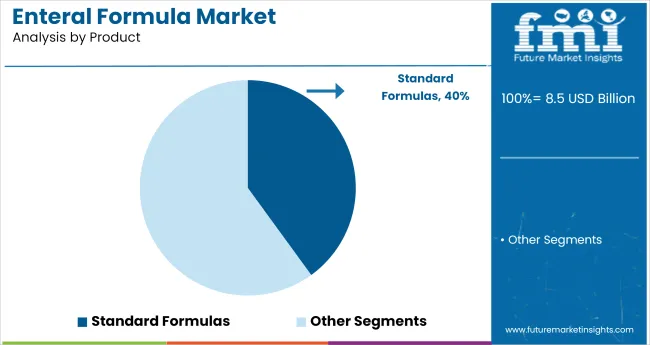
  • Standard formulas are widely used for patients with normal digestion and absorption capabilities as they provide balanced nutrition required for general health maintenance and recovery.
  • The high demand is driven by their suitability for a broad patient population, making them the primary choice for healthcare providers and caregivers globally, thus strengthening their market dominance.

Adults to Lead Health Claim Segment with 58% Market Share in 2025

The most lucrative segment under the health claim category is adults, holding an estimated market share of 58% in 2025.
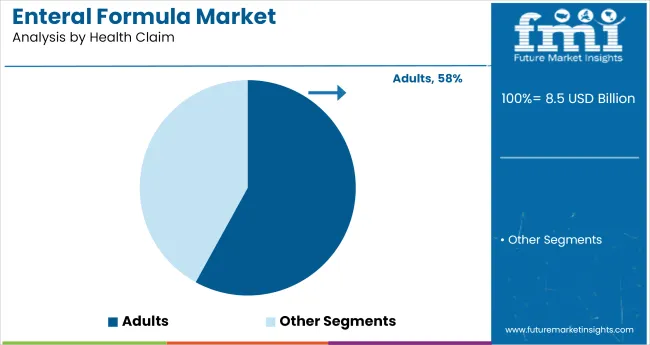
  • Adults require enteral nutrition for various medical conditions such as cancer, gastrointestinal disorders, neurological issues, and surgical recovery, leading to high demand in hospitals and home care settings.
  • Manufacturers focus on developing disease-specific formulas for adults, further strengthening the market share of this segment and supporting its continued growth globally.

Liquid Formulas to Lead Product Format Segment with 54% Market Share in 2025

The most lucrative segment under the product format category is liquid formulas, holding an estimated market share of 54% in 2025.
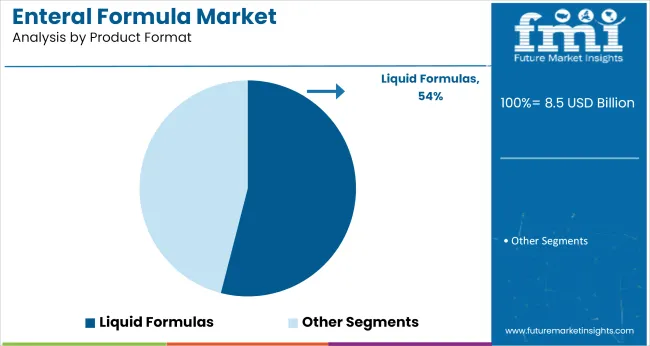
  • Liquid formulas are preferred due to their ready-to-use nature, sterile packaging, and ease of administration, especially in hospital and home care settings.
  • Their compatibility with feeding tubes and suitability for patients with swallowing difficulties further drive their demand.

Prescription-Based Sales to Lead Sales Channel Segment with 68% Market Share in 2025

The most lucrative segment under the sales channel category is prescription-based sales, holding an estimated market share of 68% in 2025.
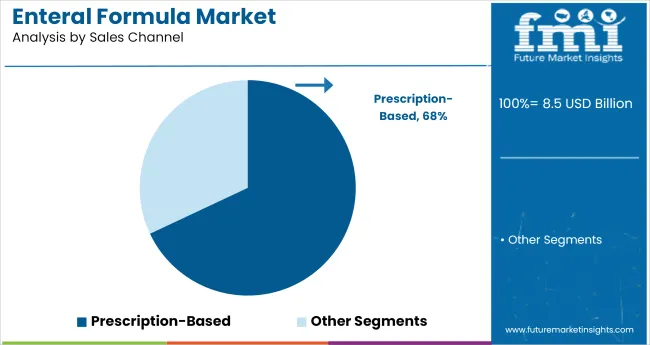
  • Prescription-based enteral formulas are widely used in hospitals, clinics, and long-term care facilities as they are recommended by physicians and dietitians to ensure safe and appropriate nutritional support for patients.
  • This channel ensures that products are administered under medical supervision, reducing risks associated with self-medication.

Tube Feeding to Lead Administration Methods Segment with 70.6% Market Share in 2025

The most lucrative segment under the administration methods category in the enteral formula market is tube feeding, holding an exact market share of 70.6%.
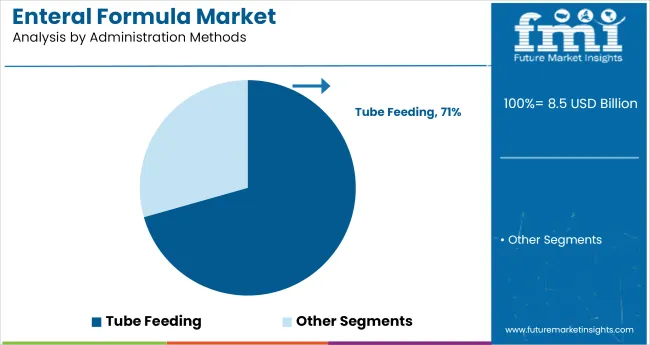
  • Tube feeding is widely used for patients who are unable to consume food orally due to medical conditions such as neurological disorders, cancer, or critical illness.
  • Its dominance is driven by the increasing prevalence of chronic diseases, rising hospital admissions, and the growing elderly population requiring assisted feeding.

Continuous to Lead Feeding Type Segment with 49.4% Market Share in 2025

The most lucrative segment under the feeding type category in the enteral formula market is continuous feeding, holding an exact market share of 49.4% in 2025.
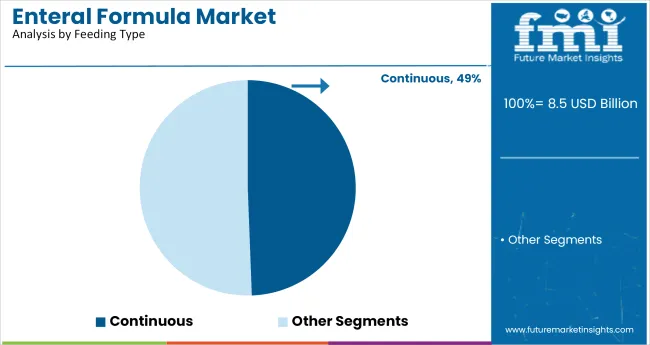
  • Continuous feeding is preferred for critically ill patients as it delivers a steady and controlled supply of nutrients over an extended period, improving absorption and reducing gastrointestinal intolerance.
  • This method is widely used in intensive care units, hospitals, and home healthcare settings for patients requiring constant nutritional support.

Top Enteral Formula Market Dynamics

The global market is growing steadily, driven by the rising prevalence of chronic diseases, increasing demand for clinical nutrition solutions, and advancements in specialized formulations and innovative delivery systems across hospital, home healthcare, and long-term care settings.

Recent Trends in the Enteral Formula Market

  • Rising adoption of disease-specific and peptide-based enteral formulas for targeted nutrition.
  • Increasing preference for home enteral nutrition with easy-to-use packaging and portable feeding pumps.
  • Growing innovation in blenderized formulas containing real food ingredients for better patient outcomes.
  • Expansion of online pharmacies and e-commerce platforms for enteral formula distribution.

Challenges in the Enteral Formula Market

  • High cost of specialized enteral formulas limits affordability for low-income patients.
  • Limited awareness about enteral nutrition benefits among patients and caregivers in developing regions.
  • Risks of tube feeding complications, such as infections and gastrointestinal intolerance.
  • Supply chain disruptions are affecting product availability in certain regional markets.

Analyzing Top Countries Producing and Supplying Enteral Formulas

Japan is projected to witness the highest growth with a CAGR of 7.5%, driven by its aging population and technological advancements. The USA follows closely with a CAGR of 7.2%, supported by a strong healthcare infrastructure and leading market players.

Germany records a steady CAGR of 6.8%, while France shows slightly lower growth at 6.6%, driven by elderly care programs. The United Kingdom registers the slowest among these at 6.5%, although it maintains strong demand due to hospital nutrition programs and rising chronic disease prevalence.

The report covers an in-depth analysis of 40+ countries; five top-performing OECD countries are highlighted below.

USA Enteral Formula Market Analysis

The USA enteral formula market is projected to grow at a CAGR of 7.2% through 2035.

  • Rising demand for home enteral nutrition solutions.
  • Strong insurance coverage supporting enteral feeding reimbursements.
  • Continuous product launches targeting disease-specific conditions.
  • Technological advancements in feeding pumps and devices.

Enteral Formula Demand Analysis in the UK

Sales of enteral formulas in the UK are projected to grow at a CAGR of 6.5% during 2025 to 2035.

  • Increasing government focus on the elderly and critical care nutrition.
  • Rising prevalence of chronic diseases like cancer and gastrointestinal disorders.
  • Growth in prescription-based and hospital pharmacy sales channels.
  • Key players are expanding portfolios with specialized and peptide formulas.

Enteral Formula Demand Analysis in Germany

Germany’s enteral formula market is projected to grow at a CAGR of 6.8% over the forecast period.

  • Rising use of tube feeding for critical care patients.
  • Expansion of product offerings targeting specific disease conditions.
  • Strong regulatory standards ensure product safety and efficacy.
  • Growing partnerships between manufacturers and hospitals for supply chains.

Enteral Formula Demand Analysis in France

Sales of enteral formulas in France are expected to grow at a CAGR of 6.6% during 2025 to 2035.

  • Expansion of home healthcare services using enteral nutrition.
  • Growing focus on personalized nutrition solutions for patients.
  • High demand for ready-to-use liquid enteral formulas.
  • Leading players are investing in research for new formulation development.

Japan Enteral Formula Market Analysis

The enteral formula revenue in Japan is anticipated to grow at a CAGR of 7.5% through 2035.

  • Rising preference for easy-to-open packaging solutions.
  • Growing demand for blenderized formulas with real food ingredients.
  • High market penetration of continuous feeding systems.
  • Technological innovation in feeding pumps improves patient compliance.

Leading Enteral Formula Suppliers

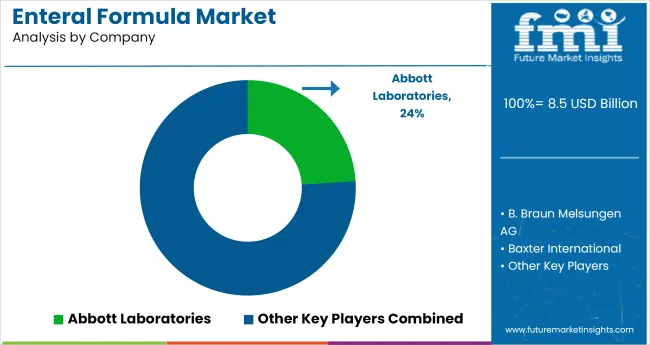
The market is relatively consolidated, with top-tier players such as Abbott Laboratories, Nestlé Health Science, Danone (Nutricia), Fresenius Kabi, and Baxter International dominating global shares. These companies maintain leadership through extensive product portfolios, advanced R&D, strong distribution networks, and established brand reputations.

Top companies are competing through continuous product innovation, development of disease-specific formulas, strategic acquisitions, and expansion into emerging markets to capture increasing demand for clinical nutrition. For instance, Abbott Laboratories focuses on developing specialized nutrition solutions under its Ensure brand, while Danone enhances its medical nutrition portfolio through targeted acquisitions.

Recent Enteral Formula Industry News
  • In January 2025, Alcresta Therapeutics unveiled the expanded use approval for the RELiZORB (immobilized lipase) cartridge, now authorizing its use in pediatric patients as young as one year old who suffer from fat malabsorption.
  • In 2024, Vygon launched its enteral feeding system called Nutrisafe to ensure feeding safety and precision for the neonates.

Enteral Formula Market - Report Scope

Report Attributes Details
Current Total Market Size (2025) USD 8.5 billion
Projected Market Size (2035) USD 16.7 billion
CAGR (2025 to 2035) 6.9%
Base Year for Estimation 2024
Historical Period 2020 to 2024
Projections Period 2025 to 2035
Market Analysis Parameters Revenue in USD billion /Volume in Units
By Product Standard Formulas, Elemental Formulas, Blenderized Formulas, Specialized Formulas, High-Protein Formulas, Fiber -Enriched Formulas, Caloric-Dense Formulas, Peptide Formulas
By Health Claim Adults, Kids, Geriatric
By Product Format Liquid Formulas, Powder Formulas, Semi-Solid Formulas, Ready To Use Formulas
By Sales Channel Prescription-Based, Over-the-Counter, Online Pharmacies
By Administration Methods Tube Feeding and Oral Administration
By Feeding Type Continuous, Intermittent, Bolus
Regions Covered North America, Latin America, Western Europe, Eastern Europe, East Asia, South Asia & Pacific, Middle East & Africa
Countries Covered United States, Canada, United Kingdom, Germany, France, China, Japan, South Korea, Brazil, Australia
Key Players Abbott Laboratories, B. Braun Melsungen AG, Baxter International, Danone (Nutricia), EN Otsuka Pharmaceutical Co., Ltd., Fresenius Kabi AG, Herbalife Nutrition Ltd., Mead Johnson Nutrition (Reckitt Benckiser), Medtrition, Inc., Meiji Holdings Co., Ltd., Nestle SA, Pediatric Nutrition Company (PediaSure), Victus, Inc., Vonco Products, LLC., and WHOLE Enteral Nourishment
Additional Attributes Dollar sales by value, market share analysis by region, and country-wise analysis.

Key Segmentation

By Product Type:

As per product type, the industry has been categorized into Standard Formulas, Elemental Formulas, Blenderized Formulas (with Real Food Ingredients), Specialized Formulas, High-Protein Formulas, Fiber-Enriched Formulas, Caloric-Dense Formulas, and Peptide Formulas (Semi-Elemental Formulas).

By Health Claim:

As per health claims, the industry has been categorized into Adults [Chronic Obstructive Pulmonary Disease (COPD), Cancer, Stroke, Diabetes, Malnutrition, Gastroparesis, Renal Failure, Multiple Sclerosis (MS), Traumatic Brain Injury (TBI), and Heart Failure], Kids [Failure to Thrive, Food Allergies or Intolerances, Cystic Fibrosis, Neurological Disorders, Gastroesophageal Reflux Disease (GERD), Short Bowel Syndrome, Anorexia or Eating Disorders, Inborn Errors of Metabolism, Pediatric Cancer, and Severe Infections], and Geriatric [Dysphagia, Malnutrition, Parkinsons Disease, Alzheimers Disease/Dementia, Post-Surgical Recovery, Chronic Kidney Disease, Heart Failure, Cancer, Chronic Pain Conditions, and Diabetes].

By Product Format:

This segment is further categorized into Liquid Formulas, Powder Formulas, Semi-Solid Formulas, and Ready to Use Formulas.

By Sales Channel:

As per sales channel, the industry has been categorized into Prescription (Dietician/Nutritionists, and Hospitals (Private Public) Clinics), Over-the-Counter (Modern Trade, Hospital Pharmacies, Retail Pharmacies, and Drug Stores), and Online Pharmacies.

By Administration Methods:

This segment is further categorized into Tube Feeding (Nasogastric Tube, Gastrostomy Tube, Jejunostomy Tube, and Percutaneous Endoscopic Gastrostomy), and Oral Administration.

By Feeding Type:

This segment is further categorized into Continuous, Intermittent, and Bolus.

By Region:

Industry analysis has been carried out in key countries of North America, Latin America, Europe, East Asia, South Asia, Oceania, and the Middle East Africa.

Table of Content

  1. Executive Summary
    • Global Market Outlook
    • Demand-side Trends
    • Supply-side Trends
    • Technology Roadmap Analysis
    • Analysis and Recommendations
  2. Market Overview
    • Market Coverage/Taxonomy
    • Market Definition/Scope/Limitations
  3. Market Background
    • Market Dynamics
      • Drivers
      • Restraints
      • Opportunity
      • Trends
    • Scenario Forecast
      • Demand in Optimistic Scenario
      • Demand in Likely Scenario
      • Demand in Conservative Scenario
    • Opportunity Map Analysis
    • Product Life Cycle Analysis
    • Supply Chain Analysis
      • Supply Side Participants and their Roles
        • Producers
        • Mid-Level Participants (Traders/ Agents/ Brokers)
        • Wholesalers and Distributors
      • Value Added and Value Created at Node in the Supply Chain
      • List of Raw Material Suppliers
      • List of Existing and Potential Buyer’s
    • Investment Feasibility Matrix
    • Value Chain Analysis
      • Profit Margin Analysis
      • Wholesalers and Distributors
      • Retailers
    • PESTLE and Porter’s Analysis
    • Regulatory Landscape
      • By Key Regions
      • By Key Countries
    • Regional Parent Market Outlook
    • Production and Consumption Statistics
    • Import and Export Statistics
  4. Global Market Analysis 2020 to 2024 and Forecast, 2025 to 2035
    • Historical Market Size Value (USD Billion) & Volume (Units) Analysis, 2020 to 2024
    • Current and Future Market Size Value (USD Billion) & Volume (Units) Projections, 2025 to 2035
      • Y-o-Y Growth Trend Analysis
      • Absolute $ Opportunity Analysis
  5. Global Market Pricing Analysis 2020 to 2024 and Forecast 2025 to 2035
  6. Global Market Analysis 2020 to 2024 and Forecast 2025 to 2035, By Product
    • Introduction/Key Findings
    • Historical Market Size Value (USD Billion) & Volume (Units) Analysis By Product, 2020 to 2024
    • Current and Future Market Size Value (USD Billion) & Volume (Units) Analysis and Forecast By Product, 2025 to 2035
      • Standard Formulas
      • Elemental Formulas
      • Blenderized Formulas (with Real Food Ingredients)
      • Specialized Formulas
      • High-Protein Formulas
      • Fiber-Enriched Formulas
      • Caloric-Dense Formulas
      • Peptide Formulas (Semi-Elemental Formulas)
    • Y-o-Y Growth Trend Analysis By Product, 2020 to 2024
    • Absolute $ Opportunity Analysis By Product, 2025 to 2035
  7. Global Market Analysis 2020 to 2024 and Forecast 2025 to 2035, By Health Claim
    • Introduction/Key Findings
    • Historical Market Size Value (USD Billion) & Volume (Units) Analysis By Health Claim, 2020 to 2024
    • Current and Future Market Size Value (USD Billion) & Volume (Units) Analysis and Forecast By Health Claim, 2025 to 2035
      • Adults
      • Kids
      • Geriatric
    • Y-o-Y Growth Trend Analysis By Health Claim, 2020 to 2024
    • Absolute $ Opportunity Analysis By Health Claim, 2025 to 2035
  8. Global Market Analysis 2020 to 2024 and Forecast 2025 to 2035, By Product Format
    • Introduction/Key Findings
    • Historical Market Size Value (USD Billion) & Volume (Units) Analysis By Product Format, 2020 to 2024
    • Current and Future Market Size Value (USD Billion) & Volume (Units) Analysis and Forecast By Product Format, 2025 to 2035
      • Liquid Formulas
      • Powder Formulas
      • Semi-Solid Formulas
      • Ready To Use Formulas
    • Y-o-Y Growth Trend Analysis By Product Format, 2020 to 2024
    • Absolute $ Opportunity Analysis By Product Format, 2025 to 2035
  9. Global Market Analysis 2020 to 2024 and Forecast 2025 to 2035, By Sales Channel
    • Introduction/Key Findings
    • Historical Market Size Value (USD Billion) & Volume (Units) Analysis By Sales Channel, 2020 to 2024
    • Current and Future Market Size Value (USD Billion) & Volume (Units) Analysis and Forecast By Sales Channel, 2025 to 2035
      • Prescription-Based
      • Over the Counter
      • Online Pharmacies
    • Y-o-Y Growth Trend Analysis By Sales Channel, 2020 to 2024
    • Absolute $ Opportunity Analysis By Sales Channel, 2025 to 2035
  10. Global Market Analysis 2020 to 2024 and Forecast 2025 to 2035, By Administration Methods
    • Introduction/Key Findings
    • Historical Market Size Value (USD Billion) & Volume (Units) Analysis By Administration Methods, 2020 to 2024
    • Current and Future Market Size Value (USD Billion) & Volume (Units) Analysis and Forecast By Administration Methods, 2025 to 2035
      • Tube Feeding
      • Oral Administration
    • Y-o-Y Growth Trend Analysis By Administration Methods, 2020 to 2024
    • Absolute $ Opportunity Analysis By Administration Methods, 2025 to 2035
  11. Global Market Analysis 2020 to 2024 and Forecast 2025 to 2035, By Feeding Type
    • Introduction/Key Findings
    • Historical Market Size Value (USD Billion) & Volume (Units) Analysis By Feeding Type, 2020 to 2024
    • Current and Future Market Size Value (USD Billion) & Volume (Units) Analysis and Forecast By Feeding Type, 2025 to 2035
      • Continuous
      • Intermittent
      • Bolus
    • Y-o-Y Growth Trend Analysis By Feeding Type, 2020 to 2024
    • Absolute $ Opportunity Analysis By Feeding Type, 2025 to 2035
  12. Global Market Analysis 2020 to 2024 and Forecast 2025 to 2035, By Region
    • Introduction
    • Historical Market Size Value (USD Billion) & Volume (Units) Analysis By Region, 2020 to 2024
    • Current Market Size Value (USD Billion) & Volume (Units) Analysis and Forecast By Region, 2025 to 2035
      • USA
      • Latin America
      • Western Europe
      • Eastern Europe
      • East Asia
      • South Asia & Pacific
      • Middle East and Africa
    • Market Attractiveness Analysis By Region
  13. USA Market Analysis 2020 to 2024 and Forecast 2025 to 2035, By Country
    • Historical Market Size Value (USD Billion) & Volume (Units) Trend Analysis By Market Taxonomy, 2020 to 2024
    • Market Size Value (USD Billion) & Volume (Units) Forecast By Market Taxonomy, 2025 to 2035
      • By Country
        • Canada
        • Brazil
        • Mexico
        • Argentina
      • By Product
      • By Health Claim
      • By Product Format
      • By Sales Channel
      • By Administration Methods
      • By Feeding Type
    • Market Attractiveness Analysis
      • By Country
      • By Product
      • By Health Claim
      • By Product Format
      • By Sales Channel
      • By Administration Methods
      • By Feeding Type
    • Key Takeaways
  14. Latin America Market Analysis 2020 to 2024 and Forecast 2025 to 2035, By Country
    • Historical Market Size Value (USD Billion) & Volume (Units) Trend Analysis By Market Taxonomy, 2020 to 2024
    • Market Size Value (USD Billion) & Volume (Units) Forecast By Market Taxonomy, 2025 to 2035
      • By Country
        • Brazil
        • Argentina
        • Rest of LATAM
      • By Product
      • By Health Claim
      • By Product Format
      • By Sales Channel
      • By Administration Methods
      • By Feeding Type
    • Market Attractiveness Analysis
      • By Country
      • By Product
      • By Health Claim
      • By Product Format
      • By Sales Channel
      • By Administration Methods
      • By Feeding Type
    • Key Takeaways
  15. Western Europe Market Analysis 2020 to 2024 and Forecast 2025 to 2035, By Country
    • Historical Market Size Value (USD Billion) & Volume (Units) Trend Analysis By Market Taxonomy, 2020 to 2024
    • Market Size Value (USD Billion) & Volume (Units) Forecast By Market Taxonomy, 2025 to 2035
      • By Country
        • Germany
        • Italy
        • France
        • UK
        • Spain
        • BENELUX
        • Nordic
        • Rest of W.Europe
      • By Product
      • By Health Claim
      • By Product Format
      • By Sales Channel
      • By Administration Methods
      • By Feeding Type
    • Market Attractiveness Analysis
      • By Country
      • By Product
      • By Health Claim
      • By Product Format
      • By Sales Channel
      • By Administration Methods
      • By Feeding Type
    • Key Takeaways
  16. Eastern Europe Market Analysis 2020 to 2024 and Forecast 2025 to 2035, By Country
    • Historical Market Size Value (USD Billion) & Volume (Units) Trend Analysis By Market Taxonomy, 2020 to 2024
    • Market Size Value (USD Billion) & Volume (Units) Forecast By Market Taxonomy, 2025 to 2035
      • By Country
        • Russia
        • Hungary
        • Poland
        • Balkan & Baltics
        • Rest of E. Europe
      • By Product
      • By Health Claim
      • By Product Format
      • By Sales Channel
      • By Administration Methods
      • By Feeding Type
    • Market Attractiveness Analysis
      • By Country
      • By Product
      • By Health Claim
      • By Product Format
      • By Sales Channel
      • By Administration Methods
      • By Feeding Type
    • Key Takeaways
  17. East Asia Market Analysis 2020 to 2024 and Forecast 2025 to 2035, By Country
    • Historical Market Size Value (USD Billion) & Volume (Units) Trend Analysis By Market Taxonomy, 2020 to 2024
    • Market Size Value (USD Billion) & Volume (Units) Forecast By Market Taxonomy, 2025 to 2035
      • By Country
        • China
        • Japan
        • South Korea
      • By Product
      • By Health Claim
      • By Product Format
      • By Sales Channel
      • By Administration Methods
      • By Feeding Type
    • Market Attractiveness Analysis
      • By Country
      • By Product
      • By Health Claim
      • By Product Format
      • By Sales Channel
      • By Administration Methods
      • By Feeding Type
    • Key Takeaways
  18. South Asia & Pacific Market Analysis 2020 to 2024 and Forecast 2025 to 2035, By Country
    • Historical Market Size Value (USD Billion) & Volume (Units) Trend Analysis By Market Taxonomy, 2020 to 2024
    • Market Size Value (USD Billion) & Volume (Units) Forecast By Market Taxonomy, 2025 to 2035
      • By Country
        • India
        • Australia & New Zealand
        • ASEAN
        • Rest of SAP
      • By Product
      • By Health Claim
      • By Product Format
      • By Sales Channel
      • By Administration Methods
      • By Feeding Type
    • Market Attractiveness Analysis
      • By Country
      • By Product
      • By Health Claim
      • By Product Format
      • By Sales Channel
      • By Administration Methods
      • By Feeding Type
    • Key Takeaways
  19. Middle East and Africa Market Analysis 2020 to 2024 and Forecast 2025 to 2035, By Country
    • Historical Market Size Value (USD Billion) & Volume (Units) Trend Analysis By Market Taxonomy, 2020 to 2024
    • Market Size Value (USD Billion) & Volume (Units) Forecast By Market Taxonomy, 2025 to 2035
      • By Country
        • GCC Countries
        • Northern Africa
        • South Africa
        • Turkiye
        • Rest of MEA
      • By Product
      • By Health Claim
      • By Product Format
      • By Sales Channel
      • By Administration Methods
      • By Feeding Type
    • Market Attractiveness Analysis
      • By Country
      • By Product
      • By Health Claim
      • By Product Format
      • By Sales Channel
      • By Administration Methods
      • By Feeding Type
    • Key Takeaways
  20. Key Countries Market Analysis
    • USA
      • Pricing Analysis
      • Market Share Analysis, 2024
        • By Product
        • By Health Claim
        • By Product Format
        • By Sales Channel
        • By Administration Methods
        • By Feeding Type
    • Canada
      • Pricing Analysis
      • Market Share Analysis, 2024
        • By Product
        • By Health Claim
        • By Product Format
        • By Sales Channel
        • By Administration Methods
        • By Feeding Type
    • Brazil
      • Pricing Analysis
      • Market Share Analysis, 2024
        • By Product
        • By Health Claim
        • By Product Format
        • By Sales Channel
        • By Administration Methods
        • By Feeding Type
    • Mexico
      • Pricing Analysis
      • Market Share Analysis, 2024
        • By Product
        • By Health Claim
        • By Product Format
        • By Sales Channel
        • By Administration Methods
        • By Feeding Type
    • Argentina
      • Pricing Analysis
      • Market Share Analysis, 2024
        • By Product
        • By Health Claim
        • By Product Format
        • By Sales Channel
        • By Administration Methods
        • By Feeding Type
  21. Market Structure Analysis
    • Competition Dashboard
    • Competition Benchmarking
    • Market Share Analysis of Top Players
      • By Regional
      • By Product
      • By Health Claim
      • By Product Format
      • By Sales Channel
      • By Administration Methods
      • By Feeding Type
  22. Competition Analysis
    • Competition Deep Dive
      • Abbott Laboratories
        • Overview
        • Product Portfolio
        • Profitability by Market Segments (Product/Age /Sales Channel/Region)
        • Sales Footprint
        • Strategy Overview
          • Marketing Strategy
          • Product Strategy
          • Channel Strategy
      • B. Braun Melsungen AG
        • Overview
        • Product Portfolio
        • Profitability by Market Segments (Product/Age /Sales Channel/Region)
        • Sales Footprint
        • Strategy Overview
          • Marketing Strategy
          • Product Strategy
          • Channel Strategy
      • Baxter International
        • Overview
        • Product Portfolio
        • Profitability by Market Segments (Product/Age /Sales Channel/Region)
        • Sales Footprint
        • Strategy Overview
          • Marketing Strategy
          • Product Strategy
          • Channel Strategy
      • Danone (Nutricia)
        • Overview
        • Product Portfolio
        • Profitability by Market Segments (Product/Age /Sales Channel/Region)
        • Sales Footprint
        • Strategy Overview
          • Marketing Strategy
          • Product Strategy
          • Channel Strategy
      • EN Otsuka Pharmaceutical Co., Ltd.
        • Overview
        • Product Portfolio
        • Profitability by Market Segments (Product/Age /Sales Channel/Region)
        • Sales Footprint
        • Strategy Overview
          • Marketing Strategy
          • Product Strategy
          • Channel Strategy
      • Fresenius Kabi AG
        • Overview
        • Product Portfolio
        • Profitability by Market Segments (Product/Age /Sales Channel/Region)
        • Sales Footprint
        • Strategy Overview
          • Marketing Strategy
          • Product Strategy
          • Channel Strategy
      • Herbalife Nutrition Ltd.
        • Overview
        • Product Portfolio
        • Profitability by Market Segments (Product/Age /Sales Channel/Region)
        • Sales Footprint
        • Strategy Overview
          • Marketing Strategy
          • Product Strategy
          • Channel Strategy
      • Mead Johnson Nutrition (Reckitt Benckiser)
        • Overview
        • Product Portfolio
        • Profitability by Market Segments (Product/Age /Sales Channel/Region)
        • Sales Footprint
        • Strategy Overview
          • Marketing Strategy
          • Product Strategy
          • Channel Strategy
      • Medtrition, Inc.
        • Overview
        • Product Portfolio
        • Profitability by Market Segments (Product/Age /Sales Channel/Region)
        • Sales Footprint
        • Strategy Overview
          • Marketing Strategy
          • Product Strategy
          • Channel Strategy
      • Meiji Holdings Co., Ltd.
        • Overview
        • Product Portfolio
        • Profitability by Market Segments (Product/Age /Sales Channel/Region)
        • Sales Footprint
        • Strategy Overview
          • Marketing Strategy
          • Product Strategy
          • Channel Strategy
      • Nestle SA
        • Overview
        • Product Portfolio
        • Profitability by Market Segments (Product/Age /Sales Channel/Region)
        • Sales Footprint
        • Strategy Overview
          • Marketing Strategy
          • Product Strategy
          • Channel Strategy
      • Pediatric Nutrition Company (PediaSure)
        • Overview
        • Product Portfolio
        • Profitability by Market Segments (Product/Age /Sales Channel/Region)
        • Sales Footprint
        • Strategy Overview
          • Marketing Strategy
          • Product Strategy
          • Channel Strategy
      • Victus, Inc.
        • Overview
        • Product Portfolio
        • Profitability by Market Segments (Product/Age /Sales Channel/Region)
        • Sales Footprint
        • Strategy Overview
          • Marketing Strategy
          • Product Strategy
          • Channel Strategy
      • Vonco Products, LLC.
        • Overview
        • Product Portfolio
        • Profitability by Market Segments (Product/Age /Sales Channel/Region)
        • Sales Footprint
        • Strategy Overview
          • Marketing Strategy
          • Product Strategy
          • Channel Strategy
      • WHOLE Enteral Nourishment
        • Overview
        • Product Portfolio
        • Profitability by Market Segments (Product/Age /Sales Channel/Region)
        • Sales Footprint
        • Strategy Overview
          • Marketing Strategy
          • Product Strategy
          • Channel Strategy
  23. Assumptions & Acronyms Used
  24. Research Methodology

List of Tables

  • Table 1: Global Market Value (USD Billion) Forecast by Region, 2020-2035
  • Table 2: Global Market Volume (Units) Forecast by Region, 2020-2035
  • Table 3: Global Market Value (USD Billion) Forecast by Product, 2020-2035
  • Table 4: Global Market Volume (Units) Forecast by Product, 2020-2035
  • Table 5: Global Market Value (USD Billion) Forecast by Health Claim, 2020-2035
  • Table 6: Global Market Volume (Units) Forecast by Health Claim, 2020-2035
  • Table 7: Global Market Value (USD Billion) Forecast by Product Format, 2020-2035
  • Table 8: Global Market Volume (Units) Forecast by Product Format, 2020-2035
  • Table 9: Global Market Value (USD Billion) Forecast by Sales Channel, 2020-2035
  • Table 10: Global Market Volume (Units) Forecast by Sales Channel, 2020-2035
  • Table 11: Global Market Value (USD Billion) Forecast by Administration Methods, 2020-2035
  • Table 12: Global Market Volume (Units) Forecast by Administration Methods, 2020-2035
  • Table 13: Global Market Value (USD Billion) Forecast by Feeding Type, 2020-2035
  • Table 14: Global Market Volume (Units) Forecast by Feeding Type, 2020-2035
  • Table 15: USA Market Value (USD Billion) Forecast by Country, 2020-2035
  • Table 16: USA Market Volume (Units) Forecast by Country, 2020-2035
  • Table 17: USA Market Value (USD Billion) Forecast by Product, 2020-2035
  • Table 18: USA Market Volume (Units) Forecast by Product, 2020-2035
  • Table 19: USA Market Value (USD Billion) Forecast by Health Claim, 2020-2035
  • Table 20: USA Market Volume (Units) Forecast by Health Claim, 2020-2035
  • Table 21: USA Market Value (USD Billion) Forecast by Product Format, 2020-2035
  • Table 22: USA Market Volume (Units) Forecast by Product Format, 2020-2035
  • Table 23: USA Market Value (USD Billion) Forecast by Sales Channel, 2020-2035
  • Table 24: USA Market Volume (Units) Forecast by Sales Channel, 2020-2035
  • Table 25: USA Market Value (USD Billion) Forecast by Administration Methods, 2020-2035
  • Table 26: USA Market Volume (Units) Forecast by Administration Methods, 2020-2035
  • Table 27: USA Market Value (USD Billion) Forecast by Feeding Type, 2020-2035
  • Table 28: USA Market Volume (Units) Forecast by Feeding Type, 2020-2035
  • Table 29: Latin America Market Value (USD Billion) Forecast by Country, 2020-2035
  • Table 30: Latin America Market Volume (Units) Forecast by Country, 2020-2035
  • Table 31: Latin America Market Value (USD Billion) Forecast by Product, 2020-2035
  • Table 32: Latin America Market Volume (Units) Forecast by Product, 2020-2035
  • Table 33: Latin America Market Value (USD Billion) Forecast by Health Claim, 2020-2035
  • Table 34: Latin America Market Volume (Units) Forecast by Health Claim, 2020-2035
  • Table 35: Latin America Market Value (USD Billion) Forecast by Product Format, 2020-2035
  • Table 36: Latin America Market Volume (Units) Forecast by Product Format, 2020-2035
  • Table 37: Latin America Market Value (USD Billion) Forecast by Sales Channel, 2020-2035
  • Table 38: Latin America Market Volume (Units) Forecast by Sales Channel, 2020-2035
  • Table 39: Latin America Market Value (USD Billion) Forecast by Administration Methods, 2020-2035
  • Table 40: Latin America Market Volume (Units) Forecast by Administration Methods, 2020-2035
  • Table 41: Latin America Market Value (USD Billion) Forecast by Feeding Type, 2020-2035
  • Table 42: Latin America Market Volume (Units) Forecast by Feeding Type, 2020-2035
  • Table 43: Western Europe Market Value (USD Billion) Forecast by Country, 2020-2035
  • Table 44: Western Europe Market Volume (Units) Forecast by Country, 2020-2035
  • Table 45: Western Europe Market Value (USD Billion) Forecast by Product, 2020-2035
  • Table 46: Western Europe Market Volume (Units) Forecast by Product, 2020-2035
  • Table 47: Western Europe Market Value (USD Billion) Forecast by Health Claim, 2020-2035
  • Table 48: Western Europe Market Volume (Units) Forecast by Health Claim, 2020-2035
  • Table 49: Western Europe Market Value (USD Billion) Forecast by Product Format, 2020-2035
  • Table 50: Western Europe Market Volume (Units) Forecast by Product Format, 2020-2035
  • Table 51: Western Europe Market Value (USD Billion) Forecast by Sales Channel, 2020-2035
  • Table 52: Western Europe Market Volume (Units) Forecast by Sales Channel, 2020-2035
  • Table 53: Western Europe Market Value (USD Billion) Forecast by Administration Methods, 2020-2035
  • Table 54: Western Europe Market Volume (Units) Forecast by Administration Methods, 2020-2035
  • Table 55: Western Europe Market Value (USD Billion) Forecast by Feeding Type, 2020-2035
  • Table 56: Western Europe Market Volume (Units) Forecast by Feeding Type, 2020-2035
  • Table 57: Eastern Europe Market Value (USD Billion) Forecast by Country, 2020-2035
  • Table 58: Eastern Europe Market Volume (Units) Forecast by Country, 2020-2035
  • Table 59: Eastern Europe Market Value (USD Billion) Forecast by Product, 2020-2035
  • Table 60: Eastern Europe Market Volume (Units) Forecast by Product, 2020-2035
  • Table 61: Eastern Europe Market Value (USD Billion) Forecast by Health Claim, 2020-2035
  • Table 62: Eastern Europe Market Volume (Units) Forecast by Health Claim, 2020-2035
  • Table 63: Eastern Europe Market Value (USD Billion) Forecast by Product Format, 2020-2035
  • Table 64: Eastern Europe Market Volume (Units) Forecast by Product Format, 2020-2035
  • Table 65: Eastern Europe Market Value (USD Billion) Forecast by Sales Channel, 2020-2035
  • Table 66: Eastern Europe Market Volume (Units) Forecast by Sales Channel, 2020-2035
  • Table 67: Eastern Europe Market Value (USD Billion) Forecast by Administration Methods, 2020-2035
  • Table 68: Eastern Europe Market Volume (Units) Forecast by Administration Methods, 2020-2035
  • Table 69: Eastern Europe Market Value (USD Billion) Forecast by Feeding Type, 2020-2035
  • Table 70: Eastern Europe Market Volume (Units) Forecast by Feeding Type, 2020-2035
  • Table 71: East Asia Market Value (USD Billion) Forecast by Country, 2020-2035
  • Table 72: East Asia Market Volume (Units) Forecast by Country, 2020-2035
  • Table 73: East Asia Market Value (USD Billion) Forecast by Product, 2020-2035
  • Table 74: East Asia Market Volume (Units) Forecast by Product, 2020-2035
  • Table 75: East Asia Market Value (USD Billion) Forecast by Health Claim, 2020-2035
  • Table 76: East Asia Market Volume (Units) Forecast by Health Claim, 2020-2035
  • Table 77: East Asia Market Value (USD Billion) Forecast by Product Format, 2020-2035
  • Table 78: East Asia Market Volume (Units) Forecast by Product Format, 2020-2035
  • Table 79: East Asia Market Value (USD Billion) Forecast by Sales Channel, 2020-2035
  • Table 80: East Asia Market Volume (Units) Forecast by Sales Channel, 2020-2035
  • Table 81: East Asia Market Value (USD Billion) Forecast by Administration Methods, 2020-2035
  • Table 82: East Asia Market Volume (Units) Forecast by Administration Methods, 2020-2035
  • Table 83: East Asia Market Value (USD Billion) Forecast by Feeding Type, 2020-2035
  • Table 84: East Asia Market Volume (Units) Forecast by Feeding Type, 2020-2035
  • Table 85: South Asia & Pacific Market Value (USD Billion) Forecast by Country, 2020-2035
  • Table 86: South Asia & Pacific Market Volume (Units) Forecast by Country, 2020-2035
  • Table 87: South Asia & Pacific Market Value (USD Billion) Forecast by Product, 2020-2035
  • Table 88: South Asia & Pacific Market Volume (Units) Forecast by Product, 2020-2035
  • Table 89: South Asia & Pacific Market Value (USD Billion) Forecast by Health Claim, 2020-2035
  • Table 90: South Asia & Pacific Market Volume (Units) Forecast by Health Claim, 2020-2035
  • Table 91: South Asia & Pacific Market Value (USD Billion) Forecast by Product Format, 2020-2035
  • Table 92: South Asia & Pacific Market Volume (Units) Forecast by Product Format, 2020-2035
  • Table 93: South Asia & Pacific Market Value (USD Billion) Forecast by Sales Channel, 2020-2035
  • Table 94: South Asia & Pacific Market Volume (Units) Forecast by Sales Channel, 2020-2035
  • Table 95: South Asia & Pacific Market Value (USD Billion) Forecast by Administration Methods, 2020-2035
  • Table 96: South Asia & Pacific Market Volume (Units) Forecast by Administration Methods, 2020-2035
  • Table 97: South Asia & Pacific Market Value (USD Billion) Forecast by Feeding Type, 2020-2035
  • Table 98: South Asia & Pacific Market Volume (Units) Forecast by Feeding Type, 2020-2035
  • Table 99: Middle East and Africa Market Value (USD Billion) Forecast by Country, 2020-2035
  • Table 100: Middle East and Africa Market Volume (Units) Forecast by Country, 2020-2035
  • Table 101: Middle East and Africa Market Value (USD Billion) Forecast by Product, 2020-2035
  • Table 102: Middle East and Africa Market Volume (Units) Forecast by Product, 2020-2035
  • Table 103: Middle East and Africa Market Value (USD Billion) Forecast by Health Claim, 2020-2035
  • Table 104: Middle East and Africa Market Volume (Units) Forecast by Health Claim, 2020-2035
  • Table 105: Middle East and Africa Market Value (USD Billion) Forecast by Product Format, 2020-2035
  • Table 106: Middle East and Africa Market Volume (Units) Forecast by Product Format, 2020-2035
  • Table 107: Middle East and Africa Market Value (USD Billion) Forecast by Sales Channel, 2020-2035
  • Table 108: Middle East and Africa Market Volume (Units) Forecast by Sales Channel, 2020-2035
  • Table 109: Middle East and Africa Market Value (USD Billion) Forecast by Administration Methods, 2020-2035
  • Table 110: Middle East and Africa Market Volume (Units) Forecast by Administration Methods, 2020-2035
  • Table 111: Middle East and Africa Market Value (USD Billion) Forecast by Feeding Type, 2020-2035
  • Table 112: Middle East and Africa Market Volume (Units) Forecast by Feeding Type, 2020-2035

List of Figures

  • Figure 1: Global Market Volume (Units) Forecast 2020-2035
  • Figure 2: Global Market Pricing Analysis
  • Figure 3: Global Market Value (USD Billion) Forecast 2020-2035
  • Figure 4: Global Market Value Share and BPS Analysis by Product, 2025 and 2035
  • Figure 5: Global Market Y-o-Y Growth Comparison by Product, 2025-2035
  • Figure 6: Global Market Attractiveness Analysis by Product
  • Figure 7: Global Market Value Share and BPS Analysis by Health Claim, 2025 and 2035
  • Figure 8: Global Market Y-o-Y Growth Comparison by Health Claim, 2025-2035
  • Figure 9: Global Market Attractiveness Analysis by Health Claim
  • Figure 10: Global Market Value Share and BPS Analysis by Product Format, 2025 and 2035
  • Figure 11: Global Market Y-o-Y Growth Comparison by Product Format, 2025-2035
  • Figure 12: Global Market Attractiveness Analysis by Product Format
  • Figure 13: Global Market Value Share and BPS Analysis by Sales Channel, 2025 and 2035
  • Figure 14: Global Market Y-o-Y Growth Comparison by Sales Channel, 2025-2035
  • Figure 15: Global Market Attractiveness Analysis by Sales Channel
  • Figure 16: Global Market Value Share and BPS Analysis by Administration Methods, 2025 and 2035
  • Figure 17: Global Market Y-o-Y Growth Comparison by Administration Methods, 2025-2035
  • Figure 18: Global Market Attractiveness Analysis by Administration Methods
  • Figure 19: Global Market Value Share and BPS Analysis by Feeding Type, 2025 and 2035
  • Figure 20: Global Market Y-o-Y Growth Comparison by Feeding Type, 2025-2035
  • Figure 21: Global Market Attractiveness Analysis by Feeding Type
  • Figure 22: Global Market Value (USD Billion) Share and BPS Analysis by Region, 2025 and 2035
  • Figure 23: Global Market Y-o-Y Growth Comparison by Region, 2025-2035
  • Figure 24: Global Market Attractiveness Analysis by Region
  • Figure 25: USA Market Incremental $ Opportunity, 2025-2035
  • Figure 26: Latin America Market Incremental $ Opportunity, 2025-2035
  • Figure 27: Western Europe Market Incremental $ Opportunity, 2025-2035
  • Figure 28: Eastern Europe Market Incremental $ Opportunity, 2025-2035
  • Figure 29: East Asia Market Incremental $ Opportunity, 2025-2035
  • Figure 30: South Asia & Pacific Market Incremental $ Opportunity, 2025-2035
  • Figure 31: Middle East and Africa Market Incremental $ Opportunity, 2025-2035
  • Figure 32: USA Market Value Share and BPS Analysis by Country, 2025 and 2035
  • Figure 33: USA Market Value Share and BPS Analysis by Product, 2025 and 2035
  • Figure 34: USA Market Y-o-Y Growth Comparison by Product, 2025-2035
  • Figure 35: USA Market Attractiveness Analysis by Product
  • Figure 36: USA Market Value Share and BPS Analysis by Health Claim, 2025 and 2035
  • Figure 37: USA Market Y-o-Y Growth Comparison by Health Claim, 2025-2035
  • Figure 38: USA Market Attractiveness Analysis by Health Claim
  • Figure 39: USA Market Value Share and BPS Analysis by Product Format, 2025 and 2035
  • Figure 40: USA Market Y-o-Y Growth Comparison by Product Format, 2025-2035
  • Figure 41: USA Market Attractiveness Analysis by Product Format
  • Figure 42: USA Market Value Share and BPS Analysis by Sales Channel, 2025 and 2035
  • Figure 43: USA Market Y-o-Y Growth Comparison by Sales Channel, 2025-2035
  • Figure 44: USA Market Attractiveness Analysis by Sales Channel
  • Figure 45: USA Market Value Share and BPS Analysis by Administration Methods, 2025 and 2035
  • Figure 46: USA Market Y-o-Y Growth Comparison by Administration Methods, 2025-2035
  • Figure 47: USA Market Attractiveness Analysis by Administration Methods
  • Figure 48: USA Market Value Share and BPS Analysis by Feeding Type, 2025 and 2035
  • Figure 49: USA Market Y-o-Y Growth Comparison by Feeding Type, 2025-2035
  • Figure 50: USA Market Attractiveness Analysis by Feeding Type
  • Figure 51: Latin America Market Value Share and BPS Analysis by Country, 2025 and 2035
  • Figure 52: Latin America Market Value Share and BPS Analysis by Product, 2025 and 2035
  • Figure 53: Latin America Market Y-o-Y Growth Comparison by Product, 2025-2035
  • Figure 54: Latin America Market Attractiveness Analysis by Product
  • Figure 55: Latin America Market Value Share and BPS Analysis by Health Claim, 2025 and 2035
  • Figure 56: Latin America Market Y-o-Y Growth Comparison by Health Claim, 2025-2035
  • Figure 57: Latin America Market Attractiveness Analysis by Health Claim
  • Figure 58: Latin America Market Value Share and BPS Analysis by Product Format, 2025 and 2035
  • Figure 59: Latin America Market Y-o-Y Growth Comparison by Product Format, 2025-2035
  • Figure 60: Latin America Market Attractiveness Analysis by Product Format
  • Figure 61: Latin America Market Value Share and BPS Analysis by Sales Channel, 2025 and 2035
  • Figure 62: Latin America Market Y-o-Y Growth Comparison by Sales Channel, 2025-2035
  • Figure 63: Latin America Market Attractiveness Analysis by Sales Channel
  • Figure 64: Latin America Market Value Share and BPS Analysis by Administration Methods, 2025 and 2035
  • Figure 65: Latin America Market Y-o-Y Growth Comparison by Administration Methods, 2025-2035
  • Figure 66: Latin America Market Attractiveness Analysis by Administration Methods
  • Figure 67: Latin America Market Value Share and BPS Analysis by Feeding Type, 2025 and 2035
  • Figure 68: Latin America Market Y-o-Y Growth Comparison by Feeding Type, 2025-2035
  • Figure 69: Latin America Market Attractiveness Analysis by Feeding Type
  • Figure 70: Western Europe Market Value Share and BPS Analysis by Country, 2025 and 2035
  • Figure 71: Western Europe Market Value Share and BPS Analysis by Product, 2025 and 2035
  • Figure 72: Western Europe Market Y-o-Y Growth Comparison by Product, 2025-2035
  • Figure 73: Western Europe Market Attractiveness Analysis by Product
  • Figure 74: Western Europe Market Value Share and BPS Analysis by Health Claim, 2025 and 2035
  • Figure 75: Western Europe Market Y-o-Y Growth Comparison by Health Claim, 2025-2035
  • Figure 76: Western Europe Market Attractiveness Analysis by Health Claim
  • Figure 77: Western Europe Market Value Share and BPS Analysis by Product Format, 2025 and 2035
  • Figure 78: Western Europe Market Y-o-Y Growth Comparison by Product Format, 2025-2035
  • Figure 79: Western Europe Market Attractiveness Analysis by Product Format
  • Figure 80: Western Europe Market Value Share and BPS Analysis by Sales Channel, 2025 and 2035
  • Figure 81: Western Europe Market Y-o-Y Growth Comparison by Sales Channel, 2025-2035
  • Figure 82: Western Europe Market Attractiveness Analysis by Sales Channel
  • Figure 83: Western Europe Market Value Share and BPS Analysis by Administration Methods, 2025 and 2035
  • Figure 84: Western Europe Market Y-o-Y Growth Comparison by Administration Methods, 2025-2035
  • Figure 85: Western Europe Market Attractiveness Analysis by Administration Methods
  • Figure 86: Western Europe Market Value Share and BPS Analysis by Feeding Type, 2025 and 2035
  • Figure 87: Western Europe Market Y-o-Y Growth Comparison by Feeding Type, 2025-2035
  • Figure 88: Western Europe Market Attractiveness Analysis by Feeding Type
  • Figure 89: Eastern Europe Market Value Share and BPS Analysis by Country, 2025 and 2035
  • Figure 90: Eastern Europe Market Value Share and BPS Analysis by Product, 2025 and 2035
  • Figure 91: Eastern Europe Market Y-o-Y Growth Comparison by Product, 2025-2035
  • Figure 92: Eastern Europe Market Attractiveness Analysis by Product
  • Figure 93: Eastern Europe Market Value Share and BPS Analysis by Health Claim, 2025 and 2035
  • Figure 94: Eastern Europe Market Y-o-Y Growth Comparison by Health Claim, 2025-2035
  • Figure 95: Eastern Europe Market Attractiveness Analysis by Health Claim
  • Figure 96: Eastern Europe Market Value Share and BPS Analysis by Product Format, 2025 and 2035
  • Figure 97: Eastern Europe Market Y-o-Y Growth Comparison by Product Format, 2025-2035
  • Figure 98: Eastern Europe Market Attractiveness Analysis by Product Format
  • Figure 99: Eastern Europe Market Value Share and BPS Analysis by Sales Channel, 2025 and 2035
  • Figure 100: Eastern Europe Market Y-o-Y Growth Comparison by Sales Channel, 2025-2035
  • Figure 101: Eastern Europe Market Attractiveness Analysis by Sales Channel
  • Figure 102: Eastern Europe Market Value Share and BPS Analysis by Administration Methods, 2025 and 2035
  • Figure 103: Eastern Europe Market Y-o-Y Growth Comparison by Administration Methods, 2025-2035
  • Figure 104: Eastern Europe Market Attractiveness Analysis by Administration Methods
  • Figure 105: Eastern Europe Market Value Share and BPS Analysis by Feeding Type, 2025 and 2035
  • Figure 106: Eastern Europe Market Y-o-Y Growth Comparison by Feeding Type, 2025-2035
  • Figure 107: Eastern Europe Market Attractiveness Analysis by Feeding Type
  • Figure 108: East Asia Market Value Share and BPS Analysis by Country, 2025 and 2035
  • Figure 109: East Asia Market Value Share and BPS Analysis by Product, 2025 and 2035
  • Figure 110: East Asia Market Y-o-Y Growth Comparison by Product, 2025-2035
  • Figure 111: East Asia Market Attractiveness Analysis by Product
  • Figure 112: East Asia Market Value Share and BPS Analysis by Health Claim, 2025 and 2035
  • Figure 113: East Asia Market Y-o-Y Growth Comparison by Health Claim, 2025-2035
  • Figure 114: East Asia Market Attractiveness Analysis by Health Claim
  • Figure 115: East Asia Market Value Share and BPS Analysis by Product Format, 2025 and 2035
  • Figure 116: East Asia Market Y-o-Y Growth Comparison by Product Format, 2025-2035
  • Figure 117: East Asia Market Attractiveness Analysis by Product Format
  • Figure 118: East Asia Market Value Share and BPS Analysis by Sales Channel, 2025 and 2035
  • Figure 119: East Asia Market Y-o-Y Growth Comparison by Sales Channel, 2025-2035
  • Figure 120: East Asia Market Attractiveness Analysis by Sales Channel
  • Figure 121: East Asia Market Value Share and BPS Analysis by Administration Methods, 2025 and 2035
  • Figure 122: East Asia Market Y-o-Y Growth Comparison by Administration Methods, 2025-2035
  • Figure 123: East Asia Market Attractiveness Analysis by Administration Methods
  • Figure 124: East Asia Market Value Share and BPS Analysis by Feeding Type, 2025 and 2035
  • Figure 125: East Asia Market Y-o-Y Growth Comparison by Feeding Type, 2025-2035
  • Figure 126: East Asia Market Attractiveness Analysis by Feeding Type
  • Figure 127: South Asia & Pacific Market Value Share and BPS Analysis by Country, 2025 and 2035
  • Figure 128: South Asia & Pacific Market Value Share and BPS Analysis by Product, 2025 and 2035
  • Figure 129: South Asia & Pacific Market Y-o-Y Growth Comparison by Product, 2025-2035
  • Figure 130: South Asia & Pacific Market Attractiveness Analysis by Product
  • Figure 131: South Asia & Pacific Market Value Share and BPS Analysis by Health Claim, 2025 and 2035
  • Figure 132: South Asia & Pacific Market Y-o-Y Growth Comparison by Health Claim, 2025-2035
  • Figure 133: South Asia & Pacific Market Attractiveness Analysis by Health Claim
  • Figure 134: South Asia & Pacific Market Value Share and BPS Analysis by Product Format, 2025 and 2035
  • Figure 135: South Asia & Pacific Market Y-o-Y Growth Comparison by Product Format, 2025-2035
  • Figure 136: South Asia & Pacific Market Attractiveness Analysis by Product Format
  • Figure 137: South Asia & Pacific Market Value Share and BPS Analysis by Sales Channel, 2025 and 2035
  • Figure 138: South Asia & Pacific Market Y-o-Y Growth Comparison by Sales Channel, 2025-2035
  • Figure 139: South Asia & Pacific Market Attractiveness Analysis by Sales Channel
  • Figure 140: South Asia & Pacific Market Value Share and BPS Analysis by Administration Methods, 2025 and 2035
  • Figure 141: South Asia & Pacific Market Y-o-Y Growth Comparison by Administration Methods, 2025-2035
  • Figure 142: South Asia & Pacific Market Attractiveness Analysis by Administration Methods
  • Figure 143: South Asia & Pacific Market Value Share and BPS Analysis by Feeding Type, 2025 and 2035
  • Figure 144: South Asia & Pacific Market Y-o-Y Growth Comparison by Feeding Type, 2025-2035
  • Figure 145: South Asia & Pacific Market Attractiveness Analysis by Feeding Type
  • Figure 146: Middle East and Africa Market Value Share and BPS Analysis by Country, 2025 and 2035
  • Figure 147: Middle East and Africa Market Value Share and BPS Analysis by Product, 2025 and 2035
  • Figure 148: Middle East and Africa Market Y-o-Y Growth Comparison by Product, 2025-2035
  • Figure 149: Middle East and Africa Market Attractiveness Analysis by Product
  • Figure 150: Middle East and Africa Market Value Share and BPS Analysis by Health Claim, 2025 and 2035
  • Figure 151: Middle East and Africa Market Y-o-Y Growth Comparison by Health Claim, 2025-2035
  • Figure 152: Middle East and Africa Market Attractiveness Analysis by Health Claim
  • Figure 153: Middle East and Africa Market Value Share and BPS Analysis by Product Format, 2025 and 2035
  • Figure 154: Middle East and Africa Market Y-o-Y Growth Comparison by Product Format, 2025-2035
  • Figure 155: Middle East and Africa Market Attractiveness Analysis by Product Format
  • Figure 156: Middle East and Africa Market Value Share and BPS Analysis by Sales Channel, 2025 and 2035
  • Figure 157: Middle East and Africa Market Y-o-Y Growth Comparison by Sales Channel, 2025-2035
  • Figure 158: Middle East and Africa Market Attractiveness Analysis by Sales Channel
  • Figure 159: Middle East and Africa Market Value Share and BPS Analysis by Administration Methods, 2025 and 2035
  • Figure 160: Middle East and Africa Market Y-o-Y Growth Comparison by Administration Methods, 2025-2035
  • Figure 161: Middle East and Africa Market Attractiveness Analysis by Administration Methods
  • Figure 162: Middle East and Africa Market Value Share and BPS Analysis by Feeding Type, 2025 and 2035
  • Figure 163: Middle East and Africa Market Y-o-Y Growth Comparison by Feeding Type, 2025-2035
  • Figure 164: Middle East and Africa Market Attractiveness Analysis by Feeding Type
  • Figure 165: Global Market - Tier Structure Analysis
  • Figure 166: Global Market - Company Share Analysis

Frequently Asked Questions

What is the size of the enteral formula market in 2025?

The market size is USD 8.5 billion in 2025.

What is the projected value of the enteral formula market by 2035?

It is projected to reach USD 16.7 billion by 2035.

What is the CAGR of the enteral formula market from 2025 to 2035?

The market is expected to grow at a CAGR of 6.9%.

Which is the leading product segment in the enteral formula market?

Standard formulas lead the market with a 40% share.

What is the fastest-growing country in the enteral formula market?

Japan is poised to grow at the highest CAGR of 7.5% during 2025 to 2035.

Explore Similar Insights

Future Market Insights

Enteral Formula Market