Europe Food Premix Market Outlook (2023 to 2033)

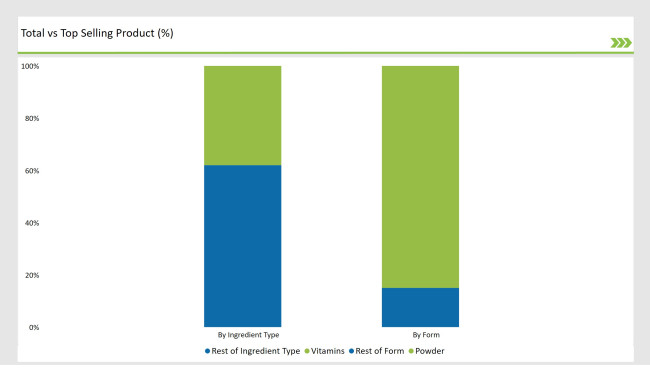
Europe food premix market is projected to accelerate at a healthy CAGR of 9.5% during the assessment period (2023 to 2033). The market value is set to expand from US$ 599 million in 2023 to US$ 1,489 million by 2033. Currently, vitamin-based food premixes hold around 31% of the total market share.

Rising usage of food premixes in food & beverages, dietary supplements, OTC drugs, and infant nutrition, growing health awareness, and availability of customized premixes are prominent factors driving Europe food premix market.

In the global market, Europe holds around 33.5% of market share and this figure is likely to further increase due to rising demand for functional food products and beverages across countries such as Germany, France, and the United Kingdom.

Food premixes are complex blends of ingredients or nutrients such as proteins, vitamins, nucleotides, minerals, and trace elements. These mixtures help in improving immunity, bone and heart health, digestion, and brain development. They also provide energy and help in weight management as well. Hence, these premixtures find application in a variety of industries including food & beverage and dietary supplements where they are utilized to improve the nutritional content of products.

Food premixes are an ideal way to get all essential nutrients a human body needs without having to consume large quantities of food. They are easy to use and help food manufacturing companies significantly improve nutritional content of their food items.

Growing trend of food fortification across Europe is expected to play a crucial role in boosting food premix sales during the assessment period. Food fortification with micronutrients has become a key strategy of European food manufacturing companies for increasing the intake of vitamins and minerals of public significance.

Rising demand for nutrition-rich foods or fortified foods and beverages across Europe due to high incidence of malnutrition and growing focus on fitness and health will create lucrative growth prospects for food premix market over the projection period.

Similarly, increasing prevalence of deficiency diseases across European countries along with favorable government initiatives to reduce malnutrition burden will help the food premix industry to thrive at a healthy pace during the assessment period.

Attribute Key Insights
Europe Food Premix Market Estimated Value (2023) US$ 599 million
Projected Market Value (2033) US$ 1,489 million
Value-based CAGR (2023 to 2033) 9.5%

Don't pay for what you don't need

Customize your report by selecting specific countries or regions and save 30%!

2018 to 2022 Europe Food Premix Market Outlook Compared to Sales Forecast 2023 to 2033

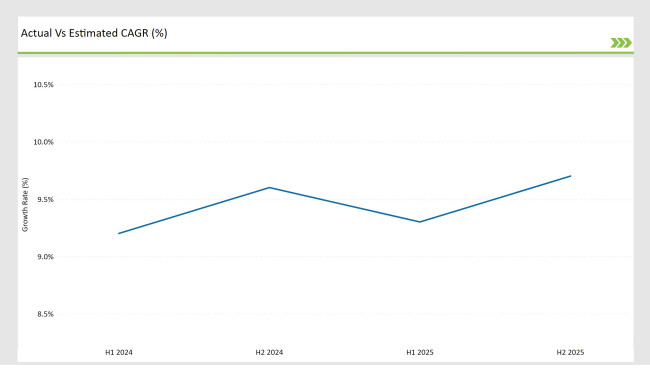
The food premix demand across Europe increased at a CAGR of 6.9% during the historical period from 2018 to 2022. For the forecast period between 2023 and 2033, Europe food premix industry is set to accelerate at a healthy CAGR of 9.5%, reaching a total valuation of US$ 1,489 million by the end of 2033.

Rising health consciousness and increasing demand for healthy food & beverage products are primary factors driving the market for food premixes across Europe.

Similarly, growing popularity of fortified food products and increasing production and consumption of dietary supplements across countries such as Germany and the United Kingdom will boost food premix sales during the projection period.

Market-o-Nomics - Highlighting the Key Trends

Several crucial factors have been identified by FMI that are projected to impact the market dynamics of Europe food premix industry during the assessment period (2023 to 2033). Besides this, analysts at FMI have also analyzed emerging trends, opportunities, restraining elements, and upcoming threats that can somehow impact food premix sales across Europe.

The drivers, restraints, opportunities, and threats identified are as follows:

DRIVERS:

  • Rising demand for food premixes across industries such as dietary supplements, food & beverage, and pharmaceutical is driving the market forward.
  • Growing health awareness coupled with increasing consumption of fortified foods is expected to boost food premix sales across Europe.
  • Rising prevalence of malnutrition across several European nations will elevate food premix sales over the projection period.
  • Increasing popularity of customized food premixes is also positively influencing the market.

RESTRAINTS:

  • Implementation of strict food safety rules and regulations is limiting market expansion to a large extent.
  • Lack of security in the supply of raw materials is also negatively influencing the market.

OPPORTUNITIES:

  • Growing popularity of plant-based food premixes is expected to create lucrative growth prospects for the market.
  • Increasing consumer spending on functional foods and beverages will bode well for the market.
  • Rising awareness about the potential advantages of food premixes is expected to elevate food premix demand in Europe market.
  • Robust growth of dietary supplement industry across countries such as the United Kingdom and Germany is expected to generate revenue-generation opportunities for food premix manufacturers.

THREATS:

  • High cost of food premixes is likely to slow down growth in the market over the projection period.
Nandini Roy Choudhury

Principal Consultant

Talk to Analyst

Find your sweet spots for generating winning opportunities in this market.

Country-wise Insights

What is the Demand Outlook for the United Kingdom Food Premix Market?

Growing Demand for Fortified Foods Boosting Market in the United Kingdom

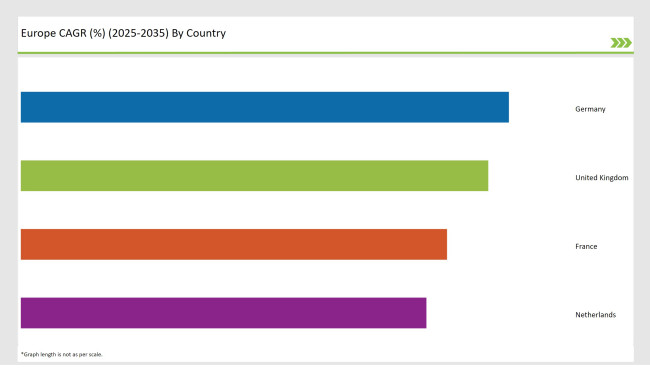
According to Future Market Insights, food premix market in the United Kingdom is poised to exhibit a CAGR of 4.1% during the forecast period (2023 to 2033). The demand for food premixes is increasing as consumers in the United Kingdom focus on healthy lifestyles. Also, there is growth in the functional food market which is creating lucrative opportunities for food premix manufacturers in the country.

Growing demand for fortified foods due to increasing health consciousness, changing lifestyles, and rising living standards, and changing lifestyles are expected to boost food premix sales across the United Kingdom during the projection period.

The need for quick, easy, and healthy food is increasing as people's schedules become busier. This in turn is creating growth prospects for the food premix business in the country.

Which Factors are Driving Germany’s Food Premix Industry?

Increased Demand for Packaged Food Products Boosting Food Premix Sales in Germany

Food premix sales across Germany are slated to rise at a steady pace during the next ten years owing to the rising demand for high-nutritional packaged food products, growing popularity of plant-based premixes, and rapid expansion of sports nutrition industry.

In European nations such as Germany, individuals are spending additional on healthy and nourishing foods to stay fit and healthy. Subsequently, due to a greater understanding among consumers of the advantages of consuming protein, such as enhanced energy, muscle mass, and strength, the sports nutrition sector is flourishing in the country. This expansion of the sports nutrition industry has led to an increased demand for food premixes and the trend is expected to continue during the assessment period.

Category-wise Insights

Which Ingredient Type Leads the Europe Food Premix Market?

Vitamin Premix Dominates the Europe Market

Based on ingredient type, the market is segmented into nucleotides, vitamins, amino acids, and minerals. Among these, vitamins segment holds a prominent share of Europe’s food premix industry and it is expected to progress at a robust pace during the projection period. This is attributed to the rising usage of vitamin premixes in dietary supplements, food & beverages, and OTC drugs.

Similarly, increasing inclination towards mixes of various functional components, growing demand for vitamin-fortified foods, and rising use of vitamin supplements due to rising prevalence of vitamin disorders such as osteoporosis, are also boosting growth of the target segment.

Which End Use Application will Create Lucrative Opportunities for Food Premix Manufacturers?

Food & Beverages Application to Create Maximum Revenue-generation Opportunities

By end use application, the market for food premixes has been segmented into food and beverages, dietary supplements, early life nutrition/baby food, and pharma OTC drugs. Among these, FMI predicts the food and beverages segment to retain its dominance over Europe’s food premixes industry during the forecast period. This is due to increasing usage of food premixes across the thriving food and beverage sector.

Food premixes are mostly used in food and beverage products to improve their nutritional content. Growing inclination towards high nutritional foods and beverages coupled with increasing trend of food fortification will further propel food premix demand in the food and beverage industry over the projection period.

Get the data you need at a Fraction of the cost

Personalize your report by choosing insights you need
and save 40%!

Competitive Landscape

The emergence of regional companies and increasing consumer demands for functional foods & beverages, and supplements have made the market highly competitive. To gain profits and expand their customer base, key food premix manufacturers across Europe are employing a wide range of strategies including new product launches, research and development activities, brand promotions, partnerships, mergers, acquisitions, and strengthening distribution channels.

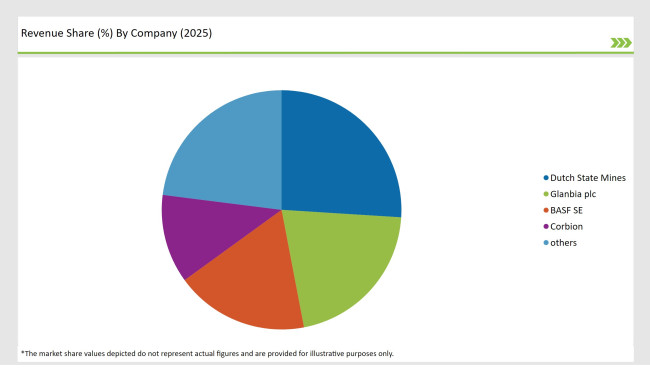
Glanbia plc, DSM, SternVitamin, Jubilant Life Sciences, Farbest Brands, Fenchem, Prinova Group, Hexagon Nutrition B&H Biotechnology, Watson Inc, BASF SE, and Corbion are few of the key food premix companies in Europe.

Recent Developments:

  • In December 2020, to meet growing demand for plant-based foods, a new range of premixes for dairy replacements products was launched by Prinova Europe.
  • In 2021, new micronutrient premixes were developed by SternVitamin, a subsidiary of Stern-Wywiol Gruppe, for the fortification of plant-based items.

Scope of the Report

Attribute Details
Estimated Market Size (2023) US$ 599 million
Projected Market Size (2033) US$ 1,489 million
Anticipated Growth Rate (2023 to 2033) 9.5% CAGR
Forecast Period 2023 to 2033
Historical Data Available for 2018 to 2022
Market Analysis US$ Million for Value and MT for Volume
Key Countries Covered Germany, France, Spain, United Kingdom, BENELUX, Nordic, Russia, Poland, Italy
Key Segments Covered Form, Ingredient Type, End Use Application, Country
Key Companies Profiled Dutch State Mines; Glanbia plc; BASF SE; Corbion; SternVitamin; Vitablend; Hellay Australia pvt; Farbest brands; Jubilant Life Sciences; Archer Daniels Midland Company; Koninklijke DSM N.V.; Farbest Brands; Fenchem Biotek Ltd.; Prinova Group LLC; Watson Inc.; Barentz International; LycoRed Ltd.; SternVitamin GmbH; Hexagon Nutrition Pvt. Ltd.
Report Coverage Market Forecast, Company Share Analysis, Competitive Landscape, Market Dynamics and Challenges, and Strategic Growth Initiatives

Europe Food Premix Industry by Category

By Form:

  • Powder
  • Liquid

By Ingredient Type:

  • Vitamins
  • Minerals
  • Amino Acids
  • Nucleotides

By End Use Application:

  • Early Life Nutrition/ Baby Food
  • Pharma OTC Drugs
  • Food & Beverages
  • Dietary Supplements

By Function Type:

  • Bone Health
  • Immunity
  • Digestion
  • Vision Health
  • Energy
  • Weight Management
  • Heart Health
  • Brain Health & Memory

Frequently Asked Questions

How Big is the Europe Food Premix Market?

The industry is valued at US$ 599 million in 2023.

What are the Challenges in Europe Food Premix Market?

The challenge in the market is the stringent environmental regulations.

Why is Europe Food Premix Market Growing?

The market is growing due to the increasing demand for convenience and healthy food.

How Big Will the Europe Food Premix Market by 2033?

The industry is estimated to reach US$ 1,489 million by 2033.

What is the Europe Food Premix Market CAGR for 2033?

The Europe food premix market CAGR through 2033 is likely to be 9.5%.

Table of Content
1. Executive Summary | Europe Food Premix Market

    1.1. Market Outlook

    1.2. Demand Side Trends

    1.3. Supply Side Trends

    1.4. Technology Roadmap

    1.5. Analysis and Recommendations

2. Market Overview

    2.1. Market Coverage / Taxonomy

    2.2. Market Definition

    2.3. Installed Base Capacity (2023E)

    2.4. Replacement Rate (2023E)

3. Market Outlook

    3.1. Historical Market Size (in Value (US$ Million) and Volume (MT) Analysis, 2018 to 2022

    3.2. Current and Future Market Size (in Value (US$ Million) and Volume (MT) Analysis, 2023 to 2033

        3.2.1. Y-o-Y Growth Trend Analysis

        3.2.2. Absolute $ Opportunity Analysis

4. Market Dynamics

    4.1. Drivers

        4.1.1. Supply Side Drivers

        4.1.2. Demand Side drivers

        4.1.3. Economic Side Drivers

    4.2. Restraints

    4.3. Opportunity

    4.4. Market trends By Region

    4.5. Forecast Factors - Relevance & Impact

    4.6. Regulations and Policies

5. Market - Pricing Analysis

    5.1. Price Point Assessment by Region

        5.1.1. Manufacturer Level Pricing

        5.1.2. Distributor Level Pricing

    5.2. Price Point Assessment By Ingredient Type

    5.3. Price Forecast till 2033

6. Value Chain Analysis

    6.1. Operating margins at each node of supply chain

    6.2. List of Active Market Participants

7. Market Size (in Value (US$ Million) and Volume (MT) Analysis 2018 to 2022 and Forecast, 2023 to 2033

    7.1. Historical Market Size (in Value (US$ Million) and Volume (MT) Analysis, 2018 to 2022

    7.2. Current and Future Market Size in Value (US$ Million) and Volume (MT) Analysis, 2023 to 2033

        7.2.1. Y-o-Y Growth Trend Analysis

        7.2.2. Absolute $ Opportunity Analysis

8. Market Analysis 2018 to 2022 and Forecast 2023 to 2033, By Form Type

    8.1. Introduction / Key Findings

    8.2. Historical Market Size in Value (US$ Million) and Volume (MT) Analysis By Form Type, 2018 to 2022

    8.3. Current and Future Market Size in Value (US$ Million) and Volume (MT) Analysis and Forecast By Form Type, 2023 to 2033

        8.3.1. Powder

        8.3.2. Liquid

    8.4. Market Attractiveness Analysis by Form Type

9. Market Analysis 2018 to 2022 and Forecast 2023 to 2033, By Ingredient Type

    9.1. Introduction / Key Findings

    9.2. Historical Market Size in Value (US$ Million) and Volume (MT) Analysis By Ingredient Type, 2018 to 2022

    9.3. Current and Future Market Size in Value (US$ Million) and Volume (MT) Analysis and Forecast By Ingredient Type, 2023 to 2033

        9.3.1. Vitamins

        9.3.2. Minerals

        9.3.3. Amino Acids

        9.3.4. Nucleotides

    9.4. Market Attractiveness Analysis by Ingredient Type

10. Market Analysis 2018 to 2022 and Forecast 2023 to 2033, By End Use Application

    10.1. Introduction / Key Findings

    10.2. Historical Market Size in Value (US$ Million) and Volume (MT) Analysis By End Use Application, 2018 to 2022

    10.3. Current and Future Market Size in Value (US$ Million) and Volume (MT) Analysis and Forecast By End Use, 2023 to 2033

        10.3.1. Early Life Nutrition/Baby Food

        10.3.2. Pharma OTC Drugs

        10.3.3. Food & Beverages

        10.3.4. Dietary Supplements

    10.4. Market Attractiveness Analysis by End Use Type

11. Market Analysis 2018 to 2022 and Forecast 2023 to 2033, By Function Type

    11.1. Introduction / Key Findings

    11.2. Historical Market Size in Value (US$ Million) and Volume (MT) Analysis By Function Type, 2018 to 2022

    11.3. Current and Future Market Size in Value (US$ Million) and Volume (MT) Analysis and Forecast By End Use, 2023 to 2033

        11.3.1. Immunity

        11.3.2. Bone Health

        11.3.3. Digestion

    11.4. Market Attractiveness Analysis by Function Type

12. Market Analysis 2018 to 2022 and Forecast 2023 to 2033, by Country

    12.1. Introduction

    12.2. Historical Market Size (in Value (US$ Million) and Volume (MT) Analysis By Region, 2018 to 2022

    12.3. Current Market Size (in Value (US$ Million) and Volume (MT) Analysis and Forecast By Country, 2023 to 2033

        12.3.1. Germany

        12.3.2. France

        12.3.3. Spain

        12.3.4. United Kingdom

        12.3.5. BENELUX

        12.3.6. Nordic

        12.3.7. Russia

        12.3.8. Poland

        12.3.9. Italy

    12.4. Market Attractiveness Analysis By Country

13. Germany Market Analysis 2018 to 2022 and Forecast 2023 to 2033

    13.1. Introduction

    13.2. Pricing Analysis

    13.3. Historical Market Size (US$ Million) and Volume(MT) Trend Analysis By Market Taxonomy, 2018 to 2022

    13.4. Market Size (US$ Million) and Volume(MT) Forecast By Market Taxonomy, 2023 to 2033

        13.4.1. By Form Type

        13.4.2. By Ingredient Type

        13.4.3. By Function Type

        13.4.4. By End Use Application

    13.5. Market Attractiveness Analysis

        13.5.1. By Form Type

        13.5.2. By Ingredient Type

        13.5.3. By Function Type

        13.5.4. By End Use Application

    13.6. Market Trends

    13.7. Key Market Participants - Intensity Mapping

    13.8. Drivers and Restraints - Impact Analysis

14. France Market Analysis 2018 to 2022 and Forecast 2023 to 2033

    14.1. Introduction

    14.2. Pricing Analysis

    14.3. Historical Market Size (US$ Million) and Volume(MT) Trend Analysis By Market Taxonomy, 2018 to 2022

    14.4. Market Size (US$ Million) and Volume(MT) Forecast By Market Taxonomy, 2023 to 2033

        14.4.1. By Form Type

        14.4.2. By Ingredient Type

        14.4.3. By Function Type

        14.4.4. By End Use Application

    14.5. Market Attractiveness Analysis

        14.5.1. By Form Type

        14.5.2. By Ingredient Type

        14.5.3. By Function Type

        14.5.4. By End Use Application

    14.6. Market Trends

    14.7. Key Market Participants - Intensity Mapping

    14.8. Drivers and Restraints - Impact Analysis

15. Italy Market Analysis 2018 to 2022 and Forecast 2023 to 2033

    15.1. Introduction

    15.2. Pricing Analysis

    15.3. Historical Market Size (US$ Million) and Volume(MT) Trend Analysis By Market Taxonomy, 2018 to 2022

    15.4. Market Size (US$ Million) and Volume(MT) Forecast By Market Taxonomy, 2023 to 2033

        15.4.1. By Form Type

        15.4.2. By Ingredient Type

        15.4.3. By Function Type

        15.4.4. By End Use Application

    15.5. Market Attractiveness Analysis

        15.5.1. By Form Type

        15.5.2. By Ingredient Type

        15.5.3. By Function Type

        15.5.4. By End Use Application

    15.6. Market Trends

    15.7. Key Market Participants - Intensity Mapping

    15.8. Drivers and Restraints - Impact Analysis

16. Spain Market Analysis 2018 to 2022 and Forecast 2023 to 2033

    16.1. Introduction

    16.2. Pricing Analysis

    16.3. Historical Market Size (US$ Million) and Volume(MT) Trend Analysis By Market Taxonomy, 2018 to 2022

    16.4. Market Size (US$ Million) and Volume(MT) Forecast By Market Taxonomy, 2023 to 2033

        16.4.1. By Form Type

        16.4.2. By Ingredient Type

        16.4.3. By Function Type

        16.4.4. By End Use Application

    16.5. Market Attractiveness Analysis

        16.5.1. By Form Type

        16.5.2. By Ingredient Type

        16.5.3. By Function Type

        16.5.4. By End Use Application

    16.6. Market Trends

    16.7. Key Market Participants - Intensity Mapping

    16.8. Drivers and Restraints - Impact Analysis

17. United Kingdom Market Analysis 2018 to 2022 and Forecast 2023 to 2033

    17.1. Introduction

    17.2. Pricing Analysis

    17.3. Historical Market Size (US$ Million) and Volume(MT) Trend Analysis By Market Taxonomy, 2018 to 2022

    17.4. Market Size (US$ Million) and Volume(MT) Forecast By Market Taxonomy, 2023 to 2033

        17.4.1. By Form Type

        17.4.2. By Ingredient Type

        17.4.3. By Function Type

        17.4.4. By End Use Application

    17.5. Market Attractiveness Analysis

        17.5.1. By Form Type

        17.5.2. By Ingredient Type

        17.5.3. By Function Type

        17.5.4. By End Use Application

    17.6. Market Trends

    17.7. Key Market Participants - Intensity Mapping

    17.8. Drivers and Restraints - Impact Analysis

18. BENELUX Market Analysis 2018 to 2022 and Forecast 2023 to 2033

    18.1. Introduction

    18.2. Pricing Analysis

    18.3. Historical Market Size (US$ Million) and Volume(MT) Trend Analysis By Market Taxonomy, 2018 to 2022

    18.4. Market Size (US$ Million) and Volume(MT) Forecast By Market Taxonomy, 2023 to 2033

        18.4.1. By Form Type

        18.4.2. By Ingredient Type

        18.4.3. By Function Type

        18.4.4. By End Use Application

    18.5. Market Attractiveness Analysis

        18.5.1. By Form Type

        18.5.2. By Ingredient Type

        18.5.3. By Function Type

        18.5.4. By End Use Application

    18.6. Market Trends

    18.7. Key Market Participants - Intensity Mapping

    18.8. Drivers and Restraints - Impact Analysis

19. Nordic Market Analysis 2018 to 2022 and Forecast 2023 to 2033

    19.1. Introduction

    19.2. Pricing Analysis

    19.3. Historical Market Size (US$ Million) and Volume(MT) Trend Analysis By Market Taxonomy, 2018 to 2022

    19.4. Market Size (US$ Million) and Volume(MT) Forecast By Market Taxonomy, 2023 to 2033

        19.4.1. By Form Type

        19.4.2. By Ingredient Type

        19.4.3. By Function Type

        19.4.4. By End Use Application

    19.5. Market Attractiveness Analysis

        19.5.1. By Form Type

        19.5.2. By Ingredient Type

        19.5.3. By Function Type

        19.5.4. By End Use Application

    19.6. Market Trends

    19.7. Key Market Participants - Intensity Mapping

    19.8. Drivers and Restraints - Impact Analysis

20. Russia Market Analysis 2018 to 2022 and Forecast 2023 to 2033

    20.1. Introduction

    20.2. Pricing Analysis

    20.3. Historical Market Size (US$ Million) and Volume(MT) Trend Analysis By Market Taxonomy, 2018 to 2022

    20.4. Market Size (US$ Million) and Volume(MT) Forecast By Market Taxonomy, 2023 to 2033

        20.4.1. By Form Type

        20.4.2. By Ingredient Type

        20.4.3. By Function Type

        20.4.4. By End Use Application

    20.5. Market Attractiveness Analysis

        20.5.1. By Form Type

        20.5.2. By Ingredient Type

        20.5.3. By Function Type

        20.5.4. By End Use Application

    20.6. Market Trends

    20.7. Key Market Participants - Intensity Mapping

    20.8. Drivers and Restraints - Impact Analysis

21. Poland Market Analysis 2018 to 2022 and Forecast 2023 to 2033

    21.1. Introduction

    21.2. Pricing Analysis

    21.3. Historical Market Size (US$ Million) and Volume(MT) Trend Analysis By Market Taxonomy, 2018 to 2022

    21.4. Market Size (US$ Million) and Volume(MT) Forecast By Market Taxonomy, 2023 to 2033

        21.4.1. By Form Type

        21.4.2. By Ingredient Type

        21.4.3. By Function Type

        21.4.4. By End Use Application

    21.5. Market Attractiveness Analysis

        21.5.1. By Form Type

        21.5.2. By Ingredient Type

        21.5.3. By Function Type

        21.5.4. By End Use Application

    21.6. Market Trends

    21.7. Key Market Participants - Intensity Mapping

    21.8. Drivers and Restraints - Impact Analysis

22. Market Structure Analysis

    22.1. Market Competition - a Dashboard View

    22.2. Industry Structure Analysis

        22.2.1. % tier 1 market players

        22.2.2. % tier 2 market players

        22.2.3. % tier 3 market players

    22.3. Market Company Share Analysis

        22.3.1. For Tier 1 Market Players, 2022

        22.3.2. Company Market Share Analysis of Top 5 Players, By Country

    22.4. Key Participants Market Presence (Intensity Mapping) by Country

23. Competition Analysis

    23.1. Competition Dashboard

    23.2. Competition Benchmarking

    23.3. Competition Deep Dive

        23.3.1. Dutch State Mines

            23.3.1.1. Product Portfolio

            23.3.1.2. Product Claim

            23.3.1.3. Revenue by Market Segments (Product/ Format/Channel/Country)

            23.3.1.4. Sales Footprint

            23.3.1.5. Strategy Overview

                23.3.1.5.1. Marketing Strategy

                23.3.1.5.2. Product Strategy

                23.3.1.5.3. Channel Strategy

            23.3.1.6. SWOT Analysis

        23.3.2. Glanbia plc

            23.3.2.1. Product Portfolio

            23.3.2.2. Product Claim

            23.3.2.3. Revenue by Market Segments (Product/ Format/Channel/Country)

            23.3.2.4. Sales Footprint

            23.3.2.5. Strategy Overview

                23.3.2.5.1. Marketing Strategy

                23.3.2.5.2. Product Strategy

                23.3.2.5.3. Channel Strategy

            23.3.2.6. SWOT Analysis

        23.3.3. BASF SE

            23.3.3.1. Product Portfolio

            23.3.3.2. Product Claim

            23.3.3.3. Revenue by Market Segments (Product/ Format/Channel/Country)

            23.3.3.4. Sales Footprint

            23.3.3.5. Strategy Overview

                23.3.3.5.1. Marketing Strategy

                23.3.3.5.2. Product Strategy

                23.3.3.5.3. Channel Strategy

            23.3.3.6. SWOT Analysis

        23.3.4. Corbion

            23.3.4.1. Product Portfolio

            23.3.4.2. Product Claim

            23.3.4.3. Revenue by Market Segments (Product/ Format/Channel/Country)

            23.3.4.4. Sales Footprint

            23.3.4.5. Strategy Overview

                23.3.4.5.1. Marketing Strategy

                23.3.4.5.2. Product Strategy

                23.3.4.5.3. Channel Strategy

            23.3.4.6. SWOT Analysis

        23.3.5. Watson

            23.3.5.1. Product Portfolio

            23.3.5.2. Product Claim

            23.3.5.3. Revenue by Market Segments (Product/ Format/Channel/Country)

            23.3.5.4. Sales Footprint

            23.3.5.5. Strategy Overview

                23.3.5.5.1. Marketing Strategy

                23.3.5.5.2. Product Strategy

                23.3.5.5.3. Channel Strategy

            23.3.5.6. SWOT Analysis

        23.3.6. SternVitamin

            23.3.6.1. Product Portfolio

            23.3.6.2. Product Claim

            23.3.6.3. Revenue by Market Segments (Product/ Format/Channel/Country)

            23.3.6.4. Sales Footprint

            23.3.6.5. Strategy Overview

                23.3.6.5.1. Marketing Strategy

                23.3.6.5.2. Product Strategy

                23.3.6.5.3. Channel Strategy

            23.3.6.6. SWOT Analysis

        23.3.7. Vitablend

            23.3.7.1. Product Portfolio

            23.3.7.2. Product Claim

            23.3.7.3. Revenue by Market Segments (Product/ Format/Channel/Country)

            23.3.7.4. Sales Footprint

            23.3.7.5. Strategy Overview

                23.3.7.5.1. Marketing Strategy

                23.3.7.5.2. Product Strategy

                23.3.7.5.3. Channel Strategy

            23.3.7.6. SWOT Analysis

        23.3.8. Hellay Australia pvt

            23.3.8.1. Product Portfolio

            23.3.8.2. Product Claim

            23.3.8.3. Revenue by Market Segments (Product/ Format/Channel/Country)

            23.3.8.4. Sales Footprint

            23.3.8.5. Strategy Overview

                23.3.8.5.1. Marketing Strategy

                23.3.8.5.2. Product Strategy

                23.3.8.5.3. Channel Strategy

            23.3.8.6. SWOT Analysis

        23.3.9. Farbest brands

            23.3.9.1. Product Portfolio

            23.3.9.2. Product Claim

            23.3.9.3. Revenue by Market Segments (Product/ Format/Channel/Country)

            23.3.9.4. Sales Footprint

            23.3.9.5. Strategy Overview

                23.3.9.5.1. Marketing Strategy

                23.3.9.5.2. Product Strategy

                23.3.9.5.3. Channel Strategy

            23.3.9.6. SWOT Analysis

        23.3.10. Jubilant Life Sciences

            23.3.10.1. Product Portfolio

            23.3.10.2. Product Claim

            23.3.10.3. Revenue by Market Segments (Product/ Format/Channel/Country)

            23.3.10.4. Sales Footprint

            23.3.10.5. Strategy Overview

                23.3.10.5.1. Marketing Strategy

                23.3.10.5.2. Product Strategy

                23.3.10.5.3. Channel Strategy

            23.3.10.6. SWOT Analysis

24. Assumptions and Acronyms Used

25. Research Methodology
Recommendations

Food and Beverage

Premix Bread Flour Market

September 2024

REP-GB-12836

Upcoming

Food and Beverage

Fortified Milk and Milk Products Market

September 2024

REP-GB-773

Upcoming

Food and Beverage

Feed Premix Market

September 2024

REP-GB-592

Upcoming

Explore Food and Beverage Insights

View Reports
Future Market Insights

Europe Food Premix Market