Reports

- Global Locations -

Headquarters

Future Market Insights, Inc.

Christiana Corporate, 200
Continental Drive, Suite 401,
Newark, Delaware - 19713,
United States

T: +1-845-579-5705

Americas

Future Market Insights, Inc.

616 Corporate Way, Suite 2-9018,
Valley Cottage, NY 10989, United States

T: +1-347-918-3531

MEA

Future Market Insights

1602-6 Jumeirah Bay X2 Tower, Plot No: JLT-PH2-X2A,
Jumeirah Lakes Towers, Dubai,
United Arab Emirates

Europe

Future Market Insights

3rd Floor, 207 Regent Street,
W1B 3HH London
United Kingdom

T: + 44 (0) 20 8123 9659
D: +44 (0) 20 3287 4268

Asia Pacific

Future Market Insights

IndiaLand Global Tech Park, Unit UG-1, Behind Grand HighStreet, Phase 1, Hinjawadi, MH, Pune – 411057, India

Europe Photovoltaic Mounting System Market Outlook (2023 to 2033)

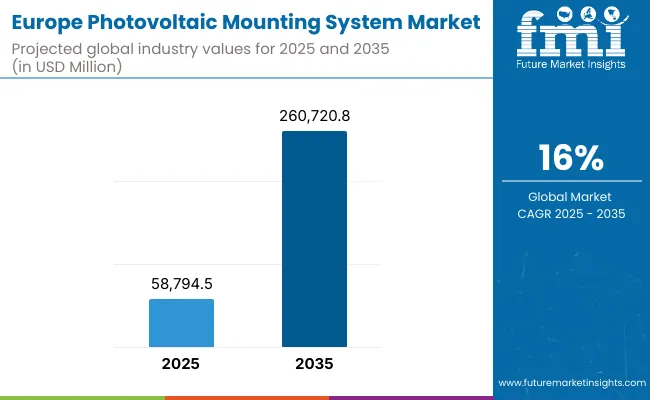
Registering a Y-o-Y growth of 9% in 2022, the Europe photovoltaic mounting system market reached US$ 35.7 billion by 2022-end. Total market size is projected to increase from US$ 40.6 billion in 2023 to US$ 178.7 billion by 2033. Over the forecast period (2023 to 2033), photovoltaic mounting system demand across Europe is likely to rise at a CAGR of 16%.

Key Trends Shaping Market Dynamics:

  • Rising inclination towards renewable energy sources such as solar energy is expected to drive rapid expansion of the Europe photovoltaic mounting system industry
  • Increasing adoption of photovoltaic systems across various European countries is anticipated to elevate PV mounting system demand
  • Decreasing costs of PV installation & energy storage systems is likely to create lucrative opportunities for photovoltaic mounting system manufacturers across Europe
  • Increasing energy prices and depletion in fossil fuel will create a conducive environment for the PV mounting system market in Europe
  • Favorable government initiatives and schemes to elevate photovoltaic mounting system demand
  • Surging popularity of rooftop solar panels or rooftop solar power systems due to convenient installation are set to foster market development
  • Introduction of lighter and more modular photovoltaic mounting systems is expected to trigger sales
  • Rising number of solar projects across Europe are likely to fuel PV mounting system demand

In recent years, factors such as increasing energy prices, rising carbon emissions, and depletion of renewable energy resources have put renewable energy sector into limelight.

People across regions such as Europe, East Asia, and North America are continuously embracing renewable energy sources such as solar panels or solar PV systems. High adoption of these solutions in turn is generating great growth potential for manufacturers.

Photovoltaic (PV) mounting systems are considered the framework or skeleton of solar panels. They are used to fix/mount solar panels or photovoltaic arrays or solar panels onto various surfaces, such as ground/ rooftops, or carports. This allows for applicability in industries as well as consumer sectors. It enables manufacturers to develop different strategies and areas of focus. These systems are also known as solar module racking systems.

Mounting systems are crucial in installing solar panels on rooftops and other structures. These are key components that influence the overall efficiency and longevity of a solar system. They are lightweight and adaptable and have become essential for modern solar panels.

Thanks to rising adoption of photovoltaic panels, Europe is becoming a highly lucrative market for PV mounting systems. These systems are becoming popular due to reduction in prices of solar panels, solar storage devices, and other products.

Photovoltaic mounting system sales across Europe are expected to rise rapidly during the next ten years. This is because more and more people are turning to renewable energy sources to reduce their carbon footprint and lower their energy costs.

Growing adoption of PV mounting systems in residential sector will boost Europe market during the projection period.

Introduction of various government incentives and schemes are encouraging people across Europe to install solar panels in their homes. This in turn will bolster photovoltaic mounting system sales.

Rising interest in space-based solar power is emerging as a key trend that will boost Europe photovoltaic mounting system industry.

Both government and non-government organizations across Europe are investing large amounts to explore the potential of space-based solar power systems. For example, the United Kingdom government recently commissioned space solar power stations research.

The new space-based solar power systems will use big solar power satellites for generating solar energy. This is anticipated to create new opportunities for PV mounting system manufacturers.

Attributes Key Insights
Estimated Europe Photovoltaic Mounting System Market Size (2023) US$40.6 billion
Projected Europe Photovoltaic Mounting System Market Value (2033) US$178.7 billion
Value-based CAGR (2023 to 2033) 16%
Collective Value Share: Top 5 Companies (2023E) 20% to 25%

Don't pay for what you don't need

Customize your report by selecting specific countries or regions and save 30%!

2018 to 2022 Europe Photovoltaic Mounting System Sales Outlook Compared to Demand Forecast from 2023 to 2033

As per Future Market Insights’ (FMI) latest analysis, sales of photovoltaic (PV) mounting systems in Europe increased at 5.5% CAGR from 2018 to 2022. Over the projection period (2023 to 2033), the market is expected to thrive at a stupendous CAGR of 16%.

Due to a confluence of factors, investors in this industry generally have a bullish outlook on the market.

First, the push towards renewable energy and a low-carbon economy is increasing interest in PV installations in Europe. PV system installations have been bolstered by governments' and regulators' policies and incentives for going solar.

Second, the expansion of the market will be helped by the development of innovative PV mounting systems. Because of developments in design, materials, and installation methods, today's mounting systems are more dependable and cost-effective than ever before.

Third, solar energy has become more cost-effective and competitive with conventional energy sources due to the declining costs of PV components such as solar panels and inverters. As a result, there has been an uptick in PV installations, which is increasing the need for mounting systems.

The Renewable Energy Directive and the Green Deal are two EU initiatives that will help the region reach its renewable energy goals and improve the market's prospects. These efforts support the PV mounting system industry by increasing the proportion of renewable energy in Europe's overall energy mix.

Supportive policies, technological advancements, cost reductions, rising demand for solar power, and a dedication to renewable energy are all expected to contribute to the expansion of Europe mounting systems industry.

Key Factors Elevating Demand for Photovoltaic Mounting Systems across Europe

The demand for photovoltaic (PV) mounting systems in Europe is driven by various factors. These drivers include:

Favorable Regulatory Environment: Europe has implemented supportive policies and regulations to promote renewable energy, including solar power. Measures such as feed-in tariffs, net metering, and renewable energy targets have incentivized the adoption of PV systems. These policies create a favorable market environment, driving the demand for PV mounting systems.

Ambitious Renewable Energy Targets: European countries have set ambitious renewable energy targets as part of their climate commitments. The European Union's Renewable Energy Directive sets a binding target of 32% renewable energy by 2030. This has led to increased investments in solar energy projects and, consequently, the demand for PV mounting systems.

Declining Costs: The cost of PV components, including solar panels, inverters, and mounting systems, has significantly decreased in recent years. This cost reduction has made solar energy more affordable and competitive with traditional energy sources. As a result, the demand for PV systems, along with mounting systems, has increased across Europe.

Technological Advancements: Continuous advancements in PV technology, including improvements in efficiency and durability, have boosted the demand for PV systems. These technological developments have also influenced the design and performance of PV mounting systems, making them more efficient, reliable, and cost-effective.

Energy Independence and Security: Europe's desire for energy independence and security has driven the demand for renewable energy sources, including solar power. PV systems provide a decentralized energy solution, allowing individuals, communities, and businesses to generate their own electricity. This desire for energy self-sufficiency in turn will positively impact the PV mounting system sales.

Job Creation and Economic Growth: The growth of the PV mounting system market in Europe has created employment opportunities and contributed to economic growth. The development, installation, and maintenance of PV systems require a skilled workforce, driving job creation in the renewable energy sector. Overall, the combination of environmental concerns, government incentives, and technological advancements is expected to continue driving demand for photovoltaic mounting systems during the next ten years.

Key Factors that May Hinder Sales of Photovoltaics Mountings Systems in Europe:

While the demand for photovoltaic (PV) mounting systems in Europe has been on the rise, several factors may hinder their sales in the region. These factors include:

Regulatory Changes and Uncertainty: Changes in government policies and regulations can create uncertainty in the market, impacting investor confidence and hindering sales of PV mounting systems. Shifts in subsidy schemes, feed-in tariffs, or net metering policies might disrupt the financial viability of PV projects, affecting the demand for mounting systems.

Grid Connection Issues: Challenges related to grid connection can impede the growth of the PV mounting system industry. In some regions, grid infrastructure may not be adequately prepared to handle the increased influx of PV installations. Delays in grid connection approvals or insufficient grid capacity can deter potential buyers from investing in PV systems and, consequently, mounting systems.

Permitting and Administrative Hurdles: The process of obtaining permits and navigating administrative procedures for PV installations can be complex and time-consuming. Lengthy approval processes, bureaucratic red tape, and unclear guidelines can discourage individuals and businesses from investing in PV systems, affecting the demand for mounting systems.

Nikhil Kaitwade
Nikhil Kaitwade

Principal Consultant

Talk to Analyst

Find your sweet spots for generating winning opportunities in this market.

Comparative View of the Adjacent Photovoltaic Mounting System Market

The adjacent photovoltaic (PV) mounting system market and the Europe solar inverter market have several key differences:

Due to rising solar PV adoption, the European solar inverter market has grown significantly. Solar power has helped Europe lead renewable energy deployment. European policies and incentives have grown the solar inverter market.

PV mounting systems, though related to solar inverters, are a separate market. PV mounting systems focus on the physical structures and mechanisms that hold PV panels, so their market size may be smaller than solar inverters.

Market Dynamics: Solar inverters convert DC electricity from solar panels into AC electricity for homes, businesses, and the grid, driving the market. PV mounting systems are driven by the need to securely install and position solar panels for maximum energy production. Solar inverters are necessary for PV systems, but PV mounting systems are necessary for panel installation.

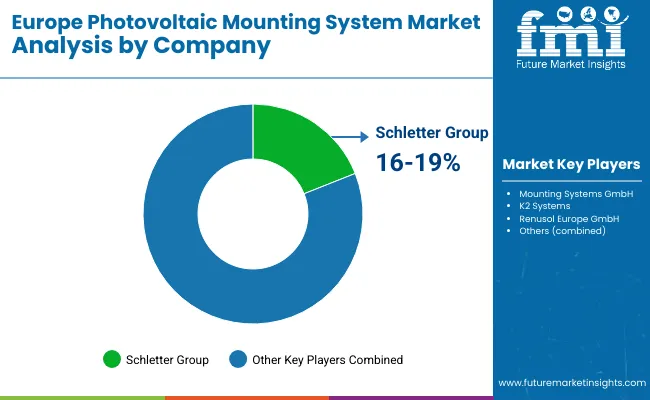
Competitive Landscape: Several established players and a mix of international and domestic manufacturers compete in the European solar inverter market. European solar inverter manufacturers include SMA Solar Technology, ABB, and Fronius. The PV mounting system market also has established players, but the product may allow for regional or local manufacturers. Leading European PV mounting system suppliers include Schletter, Renusol, and K2 Systems.

Technological Advancements: Solar inverter and PV mounting systems have advanced in recent years due to various technological advancements. Solar inverters with monitoring and grid integration features are becoming more efficient and smart. PV mounting system innovations have improved design, installation, and adaptability to different roof types or ground installations.

Europe Photovoltaic Mounting System Market

Attributes Europe Photovoltaic Mounting System Market
CAGR (2023 to 2033) 16%
Market Value (2023) US$ 40.6 billion
Growth Factor Increasing popularity of community solar projects due to a combination of government incentives, falling costs, greater energy security, technological advancements, fiercer competition, and more will boost the market.
Key Trend Benefits and incentives from the government to switch to solar power, advancements in PV technology, and the expansion of renewable energy sources are expected to elevate photovoltaic mounting system demand.

Country-wise Insights

Country Germany
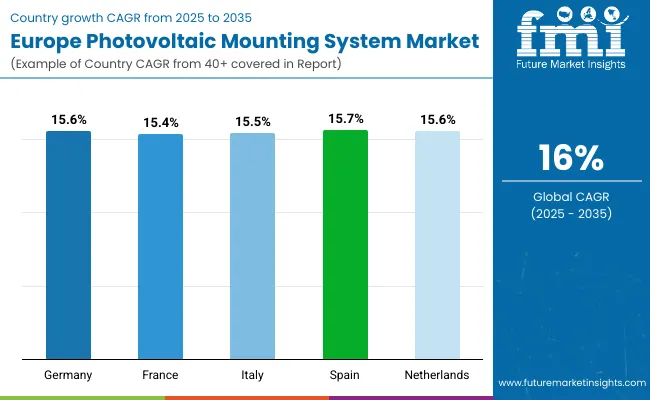
Projected CAGR (2023 to 2033) 17.8%
Market Value (2033) US$ 42.2 billion
Country United Kingdom
Projected CAGR (2023 to 2033) 18.7%
Market Value (2033) US$ 3.5 billion
Country Spain
Projected CAGR (2023 to 2033) 19%
Market Value (2033) US$ 45.9 billion
Country France
Projected CAGR (2023 to 2033) 16.7%
Market Value (2033) US$ 13.2 billion
Country Italy
Projected CAGR (2023 to 2033) 16.7%
Market Value (2033) US$ 12.6 billion

Why is Demand for Photovoltaic Mounting Systems Rising in Germany?

Rapid Shift Towards Renewable Energy Sources to Fuel PV Mounting System Demand in Germany

Germany is expected to remain a key market for photovoltaic mounting systems across Europe. As per Future Market Insights (FMI), Germany photovoltaic mounting system market is poised to exhibit 17.8% CAGR during the assessment period.

By 2033, total market valuation in the country is projected to reach US$ 42.2 billion. Rising interest in renewable energy resources and favorable government support are key factors driving demand in Germany.

People across Germany are seeking to generate their own electricity and benefit from various government incentives This in turn is expected to create high demand for photovoltaic mounting systems.

Similarly, rising environmental concerns and technological advancements in solar panels and mounting systems will favor market expansion during the assessment period.

Get the data you need at a Fraction of the cost

Personalize your report by choosing insights you need
and save 40%!

Category-wise Insights

Which is the Highly Sought-after Product Type in Europe Market?

Demand in the Market to Remain High for Ground Mounted Systems

In the Europe photovoltaic (PV) mounting system industry, several types of mounting systems have significant applications. The choice of mounting system depends on various factors such as the installation location, roof type, ground conditions, and project requirements.

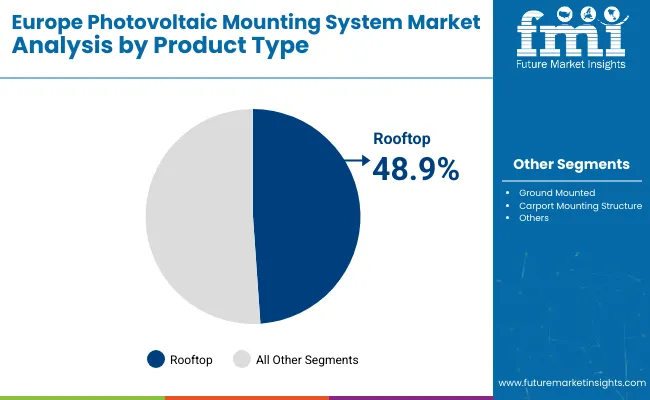
Among various product types, roof-mounted systems and ground mounted systems are the most commonly used ones. As per Future Market Insights, demand in Europe market is anticipated to remain high for ground mounted systems across Europe.

The ground mounted system segment is forecast to total a valuation of over US$ 14.6 billion by 2033. Rooftop segment on the other hand is likely to create a total incremental $ opportunity of US$ 8.9 billion between 2023 and 2033.

Ground-mounted PV systems are extensively used in Europe, particularly in large-scale utility projects and solar parks. These systems are installed on the ground, typically using fixed-tilt or single-axis or dual-axis tracking systems.

Ground-mounted systems offer flexibility in terms of layout and orientation to maximize solar energy capture. They are suitable for various terrains and can be easily scaled up for higher power generation.

Ground-mounted systems require more space compared to roof-mounted systems but are often preferred for larger installations due to their ease of access, maintenance, and potential for higher energy output.

Ground-mounted photovoltaic (PV) systems can be installed anywhere, from open fields to industrial sites, making them ideal for large-scale solar installations. The European government's focus on expanding renewable energy capacity is expected to boost ground-mounted systems significantly over the next few years.

Roof-mounted PV systems are widely utilized in residential, commercial, and industrial settings across Europe. These systems are designed to be installed on rooftops, either on pitched roofs or flat roofs.

Roof-mounted systems offer the advantage of utilizing existing roof space, making them a popular choice, especially in urban areas where ground space may be limited. They can be integrated into the building structure or installed as a separate system.

Various mounting methods such as flush mounting, tilted mounting, or ballasted systems are employed based on the roof type and structure.

Residential and commercial buildings alike make use of rooftop mounting systems. Demand for rooftop mounting systems is predicted to increase as more people in Europe switch to solar power and take advantage of government rebates and incentives for rooftop solar installations.

Competitive Landscape

The Europe photovoltaic (PV) mounting system industry has both established and new players. Companies compete to offer innovative, reliable, and affordable mounting solutions.

Leading manufacturers of PV mounting systems in Europe include Schletter GmbH, Renusol GmbH, Schletter Group, and others.

Schletter GmbH: A European leader in PV mounting systems, Schletter offers various roof- and ground-mounted PV mounting options. High-quality products, engineering expertise, and customer-centricity distinguish the company.

Renusol GmbH: Renusol develops innovative PV mounting systems for pitched, flat, and ground-mounted installations. It offers easy-to-install, flexible, modular energy-optimizing solutions.

K2 Systems GmbH: European PV mounting system provider, K2 Systems GmbH offers a variety of roof- and ground-mounting solutions. It makes durable, adaptable, and easy-to-install products.

Recent developments:

  • In 2022, a wide range of products and smart energy solutions was unveiled by Trina Solar. These products include a novel generation of Vertex and Vertex S rooftop modules and high-performance energy storage systems.
  • In October 2020, FlatFix Wave, a new revolutionary mounting system for solar panels on commercial roofs was introduced by Esdec. This new solar panel mounting system is designed to ensure fast installation times and greater reliability for solar-PV projects on large, flat roofs.

Scope of the Report

Attribute Details
Estimated Market Value (2023) US$40.6 billion
Projected Market Value (2033) US$178.7 billion
Anticipated Growth Rate (2023 to 2033) CAGR of 16% from 2023 to 2033
Historical Data 2018 to 2022
Forecast Period 2023 to 2033
Quantitative Units Revenue in US$ Million, Volume in Units and CAGR from 2023 to 2033
Report Coverage Revenue Forecast, Volume Forecast, Company Ranking, Competitive Landscape, Growth Factors, Trends and Pricing Analysis
Segments Covered
  • Product Type
  • Sales Channel
  • Material Type
  • Technology
  • End Use
Regions Covered
  • Europe
Key Countries Covered
  • Germany
  • France
  • Poland
  • Spain
  • Italy
  • BENELUX
  • Nordics
  • Europe
  • Russia
  • United Kingdom
Key Companies Profiled
  • GSE Integration
  • Systovi
  • STI Norland
  • ESDEC
  • SolTech Energy
  • Renusol
  • Sun'R Power
  • Tamesol
  • Sun Ballast
  • SonnenKraft
  • Photowatt
  • Victron Energy
  • Lorentz Pumps
  • Atersa Group
  • SunPower Corporation
  • Bauder Ltd
  • Armacell Ltd
  • EcoFasten Solar
  • Hilti (Great Britain) Ltd.
  • K2 Systems Ltd
  • Sunfixings Ltd
  • Sunsquare Ltd
  • BayWa r.e. UK Ltd.
  • Clenergy
  • Flexisolar
  • Mounting System GmbH
  • Schletter Group
  • Van der Valk Solar Systems BV
  • UK Solar Generation
  • Schletter Group

Europe Photovoltaic Mounting System Market Segmentation

By Product Type:

  • Rooftop
  • Ground Mounted
  • Carport Mounting Structure

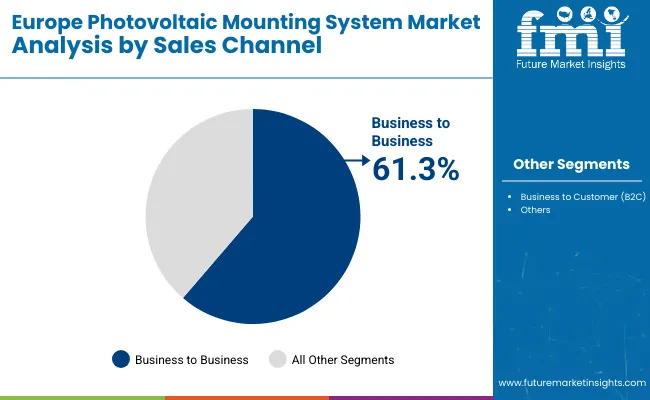
By Sales Channel:

  • Business to business (B2B)
  • Business to Customer (B2C)

By Material Type:

  • Aluminum
  • Steel
  • Others

By Technology:

  • Fixed
  • Tracking

By End Use:

  • Residential,
  • Commercial,
    • Offices
    • Recreational Areas
    • Educational Institution
    • Hospitality
    • Healthcare Facilities
    • Others
  • Industrial,
  • Municipal and Government Facilities,
  • Others

Frequently Asked Questions

How Big is the Europe Photovoltaic Mounting System Market?

The market is valued at US$ 40.6 billion in 2023.

Who are the Leading Europe Photovoltaic Mounting System Market Players?

Systovi, STI Norland, and ESDEC are the leading market players.

What is Restraining the Europe Photovoltaic Mounting System Market?

Changes in government policies and regulations restrain the market.

What is the Key Trend in the Market?

Supportive policies and regulations promote renewable energy, including solar power.

How Big will the Europe Photovoltaic Mounting System Market by 2033?

The market is estimated to reach US$ 178.7 billion by 2033.

Table of Content

1. Executive Summary

    1.1. Europe Market Outlook

    1.2. Demand Side Trends

    1.3. Supply Side Trends

    1.4. Technology Roadmap

    1.5. Analysis and Recommendations

2. Market Overview

    2.1. Market Coverage / Taxonomy

    2.2. Market Definition / Scope / Limitations

3. Key Market Trends

    3.1. Key Trends Impacting the Market

    3.2. Product Innovation / Development Trends

4. Key Success Factors

    4.1. Product Adoption / Usage Analysis

    4.2. Product USP’s / Features

    4.3. Strategic Promotional Strategies

5. Market Demand Analysis 2018 to 2022 and Forecast, 2023 to 2033

    5.1. Historical Market Volume (Units) Analysis, 2018 to 2022

    5.2. Current and Future Market Volume (Units) Projections, 2023 to 2033

    5.3. Y-o-Y Growth Trend Analysis

6. Market - Pricing Analysis

7. Market Demand (in Value or Size in US$ Billion) Analysis 2018 to 2022 and Forecast, 2023 to 2033

    7.1. Historical Market Value (US$ Billion) Analysis, 2018 to 2022

    7.2. Current and Future Market Value (US$ Billion) Projections, 2023 to 2033

        7.2.1. Y-o-Y Growth Trend Analysis

        7.2.2. Absolute $ Opportunity Analysis

8. Market Background

    8.1. Macro-Economic Factors

        8.1.1. Global Economic Growth Outlook

        8.1.2. Global Real GDP Growth

        8.1.3. Global Urbanization Overview

        8.1.4. Global. Population Overview

        8.1.5. Other Macro Economic Factors

    8.2. Forecast Factors - Relevance & Impact

        8.2.1. Europe Urbanization Growth

        8.2.2. GDP Growth

        8.2.3. Environmental regulations

        8.2.4. Investment in Research & Developments

        8.2.5. Key Companies Historical Growth Outlook

        8.2.6. Product Development

        8.2.7. Impact of Regulations

    8.3. Value Chain

        8.3.1. List of Manufacturers

        8.3.2. List of Distributors and Traders

        8.3.3. List of Suppliers

    8.4. Key Regulation and Policies

    8.5. COVID-19 Crisis - Impact Assessment

        8.5.1. Current Statistics

        8.5.2. Short-Mid-Long Term Outlook

        8.5.3. Likely Rebound

    8.6. Market Dynamics

        8.6.1. Drivers

        8.6.2. Restraints

        8.6.3. Opportunity

9. Market Analysis 2018 to 2022 and Forecast 2023 to 2033, By Product Type

    9.1. Introduction / Key Findings

    9.2. Historical Market Size (US$ Billion) and Volume Analysis By Product Type, 2018 to 2022

    9.3. Current and Future Market Size (US$ Billion) and Volume Analysis and Forecast By Product Type, 2023 to 2033

        9.3.1. Rooftop

        9.3.2. Ground-mounted

        9.3.3. Carport Mounting Structure

        9.3.4. Others

    9.4. Market Attractiveness Analysis By Product Type

10. Market Analysis 2018 to 2022 and Forecast 2023 to 2033, By Material Type

    10.1. Introduction / Key Findings

    10.2. Historical Market Size (US$ Billion) and Volume Analysis By Material Type, 2018 to 2022

    10.3. Current and Future Market Size (US$ Billion) and Volume Analysis and Forecast By Material Type, 2023 to 2033

        10.3.1. Aluminum

        10.3.2. Steel

        10.3.3. Others

    10.4. Market Attractiveness Analysis By Material Type

11. Market Analysis 2018 to 2022 and Forecast 2023 to 2033, by End Use

    11.1. Introduction / Key Findings

    11.2. Historical Market Size (US$ Billion) and Volume Analysis By End Use, 2018 to 2022

    11.3. Current and Future Market Size (US$ Billion) and Volume Analysis and Forecast By End Use, 2023 to 2033

        11.3.1. Residential

        11.3.2. Commercial

            11.3.2.1. Offices

            11.3.2.2. Recreational Areas

            11.3.2.3. Educational Institutions

            11.3.2.4. Hospitality

            11.3.2.5. Healthcare Facilities

            11.3.2.6. Others

        11.3.3. Industrial

        11.3.4. Municipal and Government Facilities

        11.3.5. Others

    11.4. Market Attractiveness Analysis By End Use

12. Market Analysis 2018 to 2022 and Forecast 2023 to 2033, by Technology

    12.1. Introduction

    12.2. Historical Market Size (US$ Billion) and Volume Analysis By Technology, 2018 to 2022

    12.3. Current Market Size (US$ Billion) and Volume Analysis and Forecast By Technology, 2023 to 2033

        12.3.1. Fixed

        12.3.2. Tracking

    12.4. Market Attractiveness Analysis By Technology

13. Market Analysis 2018 to 2022 and Forecast 2023 to 2033, by Sales Channel

    13.1. Introduction

    13.2. Historical Market Size (US$ Billion) and Volume Analysis By Sales Channel, 2018 to 2022

    13.3. Current Market Size (US$ Billion) and Volume Analysis and Forecast By Sales Channel, 2023 to 2033

        13.3.1. B2B (Business To Business)

        13.3.2. B2C (Business To Consumer)

    13.4. Market Attractiveness Analysis By Sales Channel

14. Market Analysis 2018 to 2022 and Forecast 2023 to 2033

    14.1. Introduction

    14.2. Pricing Analysis

    14.3. Historical Market Size (US$ Billion) and Volume Trend Analysis by Market Taxonomy, 2018 to 2022

    14.4. Market Size (US$ Billion) and Volume Forecast by Market Taxonomy, 2023 to 2033

        14.4.1. By Country

            14.4.1.1. Germany

            14.4.1.2. France

            14.4.1.3. Poland

            14.4.1.4. Spain

            14.4.1.5. Italy

            14.4.1.6. BENELUX

            14.4.1.7. Nordics

            14.4.1.8. United Kingdom

            14.4.1.9. Russia

            14.4.1.10. Rest of Europe

        14.4.2. By Product Type

        14.4.3. By End Use

        14.4.4. By Material Type

        14.4.5. By Technology

        14.4.6. By Sales Channel

    14.5. Market Attractiveness Analysis

        14.5.1. By Country

        14.5.2. By Product Type

        14.5.3. By End Use

        14.5.4. By Material Type

        14.5.5. By Technology

        14.5.6. By Sales Channel

    14.6. Key Market Participants - Intensity Mapping

    14.7. Drivers and Restraints - Impact Analysis

15. Market Structure Analysis

    15.1. Market Analysis by Tier of Companies (Photovoltaic Mounting System)

    15.2. Market Share Analysis of Top Players

    15.3. Market Presence Analysis

16. Competition Analysis

    16.1. Competition Dashboard

    16.2. Competition Benchmarking

    16.3. Competition Deep Dive

        16.3.1. Nordic Solar

            16.3.1.1. Overview

            16.3.1.2. Product Portfolio

            16.3.1.3. Profitability by Market Segments (Product Type/ Material Type/Technology/End Use/Sales Channel/Region)

            16.3.1.4. Sales Footprint

            16.3.1.5. Strategy Overview

        16.3.2. GSE Integration

            16.3.2.1. Overview

            16.3.2.2. Product Portfolio

            16.3.2.3. Profitability by Market Segments (Product Type/ Material Type/Technology/End Use/Sales Channel/Region)

            16.3.2.4. Sales Footprint

            16.3.2.5. Strategy Overview

        16.3.3. Systovi

            16.3.3.1. Overview

            16.3.3.2. Product Portfolio

            16.3.3.3. Profitability by Market Segments (Product Type/ Material Type/Technology/End Use/Sales Channel/Region)

            16.3.3.4. Sales Footprint

            16.3.3.5. Strategy Overview

        16.3.4. STI Norland

            16.3.4.1. Overview

            16.3.4.2. Product Portfolio

            16.3.4.3. Profitability by Market Segments (Product Type/ Material Type/Technology/End Use/Sales Channel/Region)

            16.3.4.4. Sales Footprint

            16.3.4.5. Strategy Overview

        16.3.5. ESDEC

            16.3.5.1. Overview

            16.3.5.2. Product Portfolio

            16.3.5.3. Profitability by Market Segments (Product Type/ Material Type/Technology/End Use/Sales Channel/Region)

            16.3.5.4. Sales Footprint

            16.3.5.5. Strategy Overview

        16.3.6. SolTech Energy

            16.3.6.1. Overview

            16.3.6.2. Product Portfolio

            16.3.6.3. Profitability by Market Segments (Product Type/ Material Type/Technology/End Use/Sales Channel/Region)

            16.3.6.4. Sales Footprint

            16.3.6.5. Strategy Overview

        16.3.7. Renusol

            16.3.7.1. Overview

            16.3.7.2. Product Portfolio

            16.3.7.3. Profitability by Market Segments (Product Type/ Material Type/Technology/End Use/Sales Channel/Region)

            16.3.7.4. Sales Footprint

            16.3.7.5. Strategy Overview

        16.3.8. Sun'R Power

            16.3.8.1. Overview

            16.3.8.2. Product Portfolio

            16.3.8.3. Profitability by Market Segments (Product Type/ Material Type/Technology/End Use/Sales Channel/Region)

            16.3.8.4. Sales Footprint

            16.3.8.5. Strategy Overview

        16.3.9. Tamesol

            16.3.9.1. Overview

            16.3.9.2. Product Portfolio

            16.3.9.3. Profitability by Market Segments (Product Type/ Material Type/Technology/End Use/Sales Channel/Region)

            16.3.9.4. Sales Footprint

            16.3.9.5. Strategy Overview

        16.3.10. Sun Ballast

            16.3.10.1. Overview

            16.3.10.2. Product Portfolio

            16.3.10.3. Profitability by Market Segments (Product Type/ Material Type/Technology/End Use/Sales Channel/Region)

            16.3.10.4. Sales Footprint

            16.3.10.5. Strategy Overview

        16.3.11. SonnenKraft

            16.3.11.1. Overview

            16.3.11.2. Product Portfolio

            16.3.11.3. Profitability by Market Segments (Product Type/ Material Type/Technology/End Use/Sales Channel/Region)

            16.3.11.4. Sales Footprint

            16.3.11.5. Strategy Overview

        16.3.12. Photowatt

            16.3.12.1. Overview

            16.3.12.2. Product Portfolio

            16.3.12.3. Profitability by Market Segments (Product Type/ Material Type/Technology/End Use/Sales Channel/Region)

            16.3.12.4. Sales Footprint

            16.3.12.5. Strategy Overview

        16.3.13. Victron Energy

            16.3.13.1. Overview

            16.3.13.2. Product Portfolio

            16.3.13.3. Profitability by Market Segments (Product Type/ Material Type/Technology/End Use/Sales Channel/Region)

            16.3.13.4. Sales Footprint

            16.3.13.5. Strategy Overview

        16.3.14. Lorentz Pumps

            16.3.14.1. Overview

            16.3.14.2. Product Portfolio

            16.3.14.3. Profitability by Market Segments (Product Type/ Material Type/Technology/End Use/Sales Channel/Region)

            16.3.14.4. Sales Footprint

            16.3.14.5. Strategy Overview

        16.3.15. Atersa Group

            16.3.15.1. Overview

            16.3.15.2. Product Portfolio

            16.3.15.3. Profitability by Market Segments (Product Type/ Material Type/Technology/End Use/Sales Channel/Region)

            16.3.15.4. Sales Footprint

            16.3.15.5. Strategy Overview

        16.3.16. SunPower Corporation

            16.3.16.1. Overview

            16.3.16.2. Product Portfolio

            16.3.16.3. Profitability by Market Segments (Product Type/ Material Type/Technology/End Use/Sales Channel/Region)

            16.3.16.4. Sales Footprint

            16.3.16.5. Strategy Overview

        16.3.17. Bauder Ltd

            16.3.17.1. Overview

            16.3.17.2. Product Portfolio

            16.3.17.3. Profitability by Market Segments (Product Type/ Material Type/Technology/End Use/Sales Channel/Region)

            16.3.17.4. Sales Footprint

            16.3.17.5. Strategy Overview

        16.3.18. Armacell Ltd

            16.3.18.1. Overview

            16.3.18.2. Product Portfolio

            16.3.18.3. Profitability by Market Segments (Product Type/ Material Type/Technology/End Use/Sales Channel/Region)

            16.3.18.4. Sales Footprint

            16.3.18.5. Strategy Overview

        16.3.19. EcoFasten Solar

            16.3.19.1. Overview

            16.3.19.2. Product Portfolio

            16.3.19.3. Profitability by Market Segments (Product Type/ Material Type/Technology/End Use/Sales Channel/Region)

            16.3.19.4. Sales Footprint

            16.3.19.5. Strategy Overview

        16.3.20. Hilti (Great Britain) Ltd.

            16.3.20.1. Overview

            16.3.20.2. Product Portfolio

            16.3.20.3. Profitability by Market Segments (Product Type/ Material Type/Technology/End Use/Sales Channel/Region)

            16.3.20.4. Sales Footprint

            16.3.20.5. Strategy Overview

        16.3.21. K2 Systems Ltd

            16.3.21.1. Overview

            16.3.21.2. Product Portfolio

            16.3.21.3. Profitability by Market Segments (Product Type/ Material Type/Technology/End Use/Sales Channel/Region)

            16.3.21.4. Sales Footprint

            16.3.21.5. Strategy Overview

        16.3.22. Sunfixings Ltd

            16.3.22.1. Overview

            16.3.22.2. Product Portfolio

            16.3.22.3. Profitability by Market Segments (Product Type/ Material Type/Technology/End Use/Sales Channel/Region)

            16.3.22.4. Sales Footprint

            16.3.22.5. Strategy Overview

        16.3.23. Sunsquare Ltd

            16.3.23.1. Overview

            16.3.23.2. Product Portfolio

            16.3.23.3. Profitability by Market Segments (Product Type/ Material Type/Technology/End Use/Sales Channel/Region)

            16.3.23.4. Sales Footprint

            16.3.23.5. Strategy Overview

        16.3.24. BayWa r.e. UK Ltd.

            16.3.24.1. Overview

            16.3.24.2. Product Portfolio

            16.3.24.3. Profitability by Market Segments (Product Type/ Material Type/Technology/End Use/Sales Channel/Region)

            16.3.24.4. Sales Footprint

            16.3.24.5. Strategy Overview

        16.3.25. Clenergy

            16.3.25.1. Overview

            16.3.25.2. Product Portfolio

            16.3.25.3. Profitability by Market Segments (Product Type/ Material Type/Technology/End Use/Sales Channel/Region)

            16.3.25.4. Sales Footprint

            16.3.25.5. Strategy Overview

        16.3.26. Flexisolar

            16.3.26.1. Overview

            16.3.26.2. Product Portfolio

            16.3.26.3. Profitability by Market Segments (Product Type/ Material Type/Technology/End Use/Sales Channel/Region)

            16.3.26.4. Sales Footprint

            16.3.26.5. Strategy Overview

        16.3.27. Mounting System GmbH

            16.3.27.1. Overview

            16.3.27.2. Product Portfolio

            16.3.27.3. Profitability by Market Segments (Product Type/ Material Type/Technology/End Use/Sales Channel/Region)

            16.3.27.4. Sales Footprint

            16.3.27.5. Strategy Overview

        16.3.28. Schletter Group

            16.3.28.1. Overview

            16.3.28.2. Product Portfolio

            16.3.28.3. Profitability by Market Segments (Product Type/ Material Type/Technology/End Use/Sales Channel/Region)

            16.3.28.4. Sales Footprint

            16.3.28.5. Strategy Overview

        16.3.29. Van der Valk Solar Systems BV

            16.3.29.1. Overview

            16.3.29.2. Product Portfolio

            16.3.29.3. Profitability by Market Segments (Product Type/ Material Type/Technology/End Use/Sales Channel/Region)

            16.3.29.4. Sales Footprint

            16.3.29.5. Strategy Overview

        16.3.30. UK Solar Generation

            16.3.30.1. Overview

            16.3.30.2. Product Portfolio

            16.3.30.3. Profitability by Market Segments (Product Type/ Material Type/Technology/End Use/Sales Channel/Region)

            16.3.30.4. Sales Footprint

            16.3.30.5. Strategy Overview

17. Assumptions and Acronyms Used

18. Research Methodology

Don't pay for what you don't need

Customize your report by selecting specific countries or regions and save 30%!

List of Tables

Table 01: Market Value (US$ Billion) and Volume (000' Units) Historical Data 2018 to 2022 and Forecast 2023 to 2033 by Product Type

Table 02: Market Value (US$ Billion) and Volume (000' Units) Historical Data 2018 to 2022 and Forecast 2023 to 2033 by Material Type

Table 03: Market Value (US$ Billion) and Volume (000' Units) Historical Data 2018 to 2022 and Forecast 2023 to 2033 By Technology

Table 04: Market Value (US$ Billion) and Volume (000' Units) Historical Data 2018 to 2022 and Forecast 2023 to 2033 By Sales Channel

Table 05: Market Volume (000' Units) Historical Data 2018 to 2022 and Forecast 2023 to 2033 by End Use

Table 06: Market Volume (000' Units) Historical Data 2018 to 2022 and Forecast 2023 to 2033 by End Use

Table 07: Market Value (US$ Billion) Historical Data 2018 to 2022 and Forecast 2023 to 2033 by End Use

Table 08: Market Value (US$ Billion) Historical Data 2018 to 2022 and Forecast 2023 to 2033 by End Use

Table 09: Market Volume ('000 Units) Historical Data 2018 to 2022 and Forecast 2023 to 2033 by Region

Table 10: Market Value (US$ Billion) Historical Data 2018 to 2022 and Forecast 2023 to 2033 by Region
Nikhil Kaitwade
Nikhil Kaitwade

Principal Consultant

Talk to Analyst

Find your sweet spots for generating winning opportunities in this market.

List of Charts

Figure 01: Market Historical Volume (Thousand Units), 2018 to 2022

Figure 02: Market Volume (Thousand Units) Forecast, 2023 to 2033

Figure 03: Market Historical Value (US$ Billion), 2018 to 2022

Figure 04: Market Value (US$ Billion) Forecast, 2023 to 2033

Figure 05: Market Absolute $ Opportunity, 2023 to 2033

Figure 06: Market Analysis by Product Type- 2023 & 2033

Figure 07: Market Analysis by Product Type, 2023 to 2033

Figure 08: Market Analysis by Product Type, 2023 to 2033

Figure 09: Market Incremental $ Opportunity 2023 to 2033, by Rooftop

Figure 10: Market Incremental $ Opportunity 2023 to 2033, by Ground Mounted

Figure 11: Market Incremental $ Opportunity 2023 to 2033, by Carport Mounting Structure

Figure 12: Market Incremental $ Opportunity 2023 to 2033, by Others

Figure 13: Market Share and BPS Analysis by Material Type - 2023 & 2033

Figure 14: Market Y-o-Y Growth Projections by Material Type, 2023 to 2033

Figure 15: Market Attractiveness by Material Type, 2023 to 2033

Figure 16: Market Incremental $ Opportunity, 2023 to 2033, by Aluminum

Figure 17: Market Incremental $ Opportunity, 2023 to 2033, by Steel

Figure 18: Market Incremental $ Opportunity, 2023 to 2033, by Others

Figure 19: Market Share and BPS Analysis by Technology - 2023 & 2033

Figure 20: Market Y-o-Y Growth Projections by Technology, 2023 to 2033

Figure 21: Market Attractiveness by Technology, 2023 to 2033

Figure 22: Market Incremental $ Opportunity, 2023 to 2033, by Fixed

Figure 23: Market Incremental $ Opportunity, 2023 to 2033, by Tracking

Figure 24: Market Share and BPS Analysis by Sales Channel - 2023 & 2033

Figure 25: Market Y-o-Y Growth Projections by Sales Channel, 2023 to 2033

Figure 26: Market Attractiveness by Sales Channel, 2023 to 2033

Figure 27: Market Incremental $ Opportunity, 2023 to 2033, by B2B

Figure 28: Market Incremental $ Opportunity, 2023 to 2033, by B2C

Figure 29: Market Share and BPS Analysis by End Use- 2023 & 2033

Figure 30: Market Y-o-Y Growth Projections by End Use, 2023 to 2033

Figure 31: Market Attractiveness by End Use, 2023 to 2033

Figure 32: Market Incremental $ Opportunity, 2023 to 2033, by Residential

Figure 33: Market Incremental $ Opportunity, 2023 to 2033, by Commercial

Figure 34: Market Incremental $ Opportunity, 2023 to 2033, by Industrial

Figure 35: Market Incremental $ Opportunity, 2023 to 2033, by Municipal and Government Facilities

Figure 36: Market Incremental $ Opportunity, 2023 to 2033, by Others

Figure 37: Market Share and BPS Analysis by Region- 2023 & 2033

Figure 38: Y-o-Y Growth Projection by Region, 2023 to 2033

Figure 39: Market Attractiveness Index by Region, 2023 to 2033

Figure 40: Europe Market Incremental $ Opportunity by Region, 2023 to 2033

Explore Industrial Automation Insights

View Reports

Europe Photovoltaic Mounting System Market