Fabric Inspection Machine Market Size and Share Forecast Outlook From 2024 to 2034

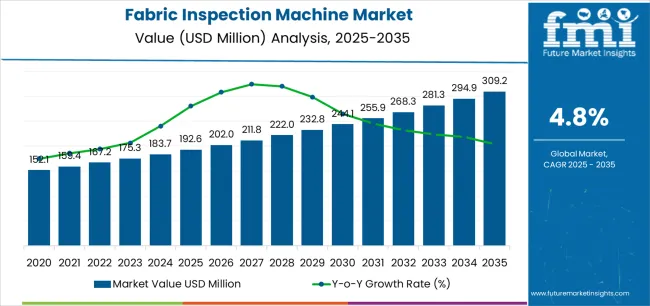
The global fabric inspection machine market size reached USD 174.4 million in 2023. Over the forecast period, fabric inspection machine demand is anticipated to rise at 5.1% CAGR. Total market value is predicted to increase from USD 183.3 million in 2024 to USD 301.4 million in 2034.

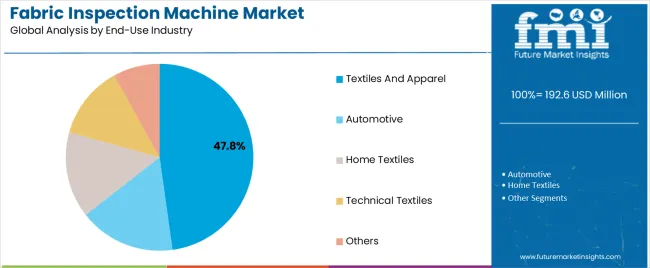
Demand for fabric inspection machines is projected to remain high in the textiles and apparel end-use industry. The latest fabric inspection machine market analysis shows that the textiles and apparel segment is projected to thrive at 5.7% CAGR during the forecast period.

Attributes Key Insights
Fabric Inspection Machine Market Size in 2023 USD 174.4 million
Estimated Fabric Inspection Machine Market Value (2024E) USD 183.3 million
Projected Fabric Inspection Machine Market Revenue (2034F) USD 301.4 million
Value-based Fabric Inspection Machine Market CAGR (2024 to 2034) 5.1%

Top Fabric Inspection Machine Market Dynamics and Industry Trends

  • Continuous march of technological advancements is leading to the development of more sophisticated and efficient fabric inspection systems.
  • Increasing demand for superior quality textiles and trend of automation in manufacturing are propelling the adoption of fabric inspection machines.
  • The need to comply with stringent regulatory standards amplifies the demand for advanced inspection technologies.
  • The fabric inspection machine market is witnessing notable developments that align with industry demands.
  • Integration of artificial intelligence (AI) for enhanced inspection capabilities is expected to be a leading trend.
  • Development of portable and compact fabric-checking machines for greater flexibility is anticipated to push growth.
  • Rapid incorporation of advanced sensors for more precise defect detection reflects the industry's continuous pursuit of sophisticated inspection methods.
  • The fabric inspection machine market presents a dynamic and multifaceted landscape.
  • Fabric inspection systems stand as vital components in ensuring the production of high-quality textiles, thereby sustaining the global demand for top-tier fabric products.

Key Highlights of the Fabric Inspection Machine Market

  • Fabric Inspection System Market to Expand Nearly 1.6X through 2034

The global fabric inspection machine market is predicted to expand around 1.6x through 2034, amid a 2.2% surge in expected CAGR compared to the historical one. Increased industrialization is a key growth driving factor. Burgeoning global industrial activities contribute to heightened demand for fabric inspection machines, especially in sectors like textile.

Ongoing technological advancements, heightened emphasis on quality control in textile production, and automation trends are also expected to boost demand. The expanding global textile industry and the imperative to comply with stringent regulatory standards are set to aid demand.

The aforementioned factors are projected to propel adoption of textile inspection machines as manufacturers seek more efficient and accurate inspection processes. These are expected to align with growing demand for high-quality textiles and the shift toward automation.

Staying abreast of evolving market trends and technological innovations is anticipated to be crucial for stakeholders navigating this dynamic landscape. By 2034, the total fabric inspection machine market revenue is set to reach USD 301.4 million.

  • East Asia to Exhibit Considerable Growth through 2034

East Asia is expected to retain its command in the field of cloth inspection machines during the forecast period. It is set to hold around 41.4% of the global fabric inspection machine market share in 2034.

Robust growth of the textile industry in countries like China and Japan, which are leading manufacturing hubs, is expected to drive demand. Technological innovations and increasing automation in production processes are also anticipated to bolster demand.

A strong commitment to maintaining high-quality standards in textile manufacturing contributes to East Asia's commanding position in the fabric inspection machine market. China is considered one of the largest manufacturers of textiles in the world.

China’s textile industry has developed significantly over the past 20 years, becoming one of the key drivers of the national economy. The country offers low-cost and extensive labor availability to textile manufacturing companies. At the same time, it provides a robust material supply chain and low commercial barriers.

The economic growth in East Asia fosters increased industrial activities and investments, amplifying the need for garment inspection machines in diverse applications. The region's heightened awareness of workplace safety further solidifies its position as a key consumer in the global fabric inspection machine market.

  • Roll-to-roll Inspection Machines to Retain their Dominance

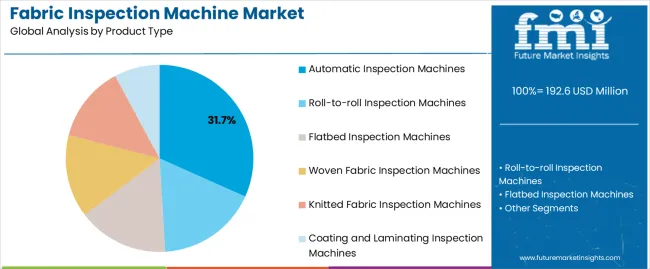
Roll-to-roll inspection machines are expected to dominate the global fabric inspection machine market in 2024. These are anticipated to witness a 5.4% CAGR during the forecast period.

The roll-to-roll tubular fabric inspection machine segment stands as a dominant force in the global fabric inspection machine market, reflecting its widespread adoption in textile manufacturing. The segment's prominence can be attributed to its versatility and efficiency in handling continuous fabric rolls.

Roll-to-roll inspection machines further offer seamless integration into production lines, enabling manufacturers to inspect woven and knitted fabrics. These also provide manufacturers with laminated or coated materials and high precision & speed.

The consistent demand for these machines is set to be fueled by their ability to streamline the inspection process, ensuring the quality and integrity of fabrics on a large scale. Roll-to-roll inspection machines are anticipated to showcase exponential growth as industries increasingly prioritize efficiency and automation.

Comparison of Historical vs Future Outlook for the Fabric Inspection Machine Market (2019 to 2023 vs 2024 to 2034)

Fabric inspection machine sales grew at a CAGR of 2.9% between 2019 to 2023. Total market revenue reached about USD 174.4 million in 2023. In the forecast period, the worldwide fabric inspection machine industry is set to thrive at a CAGR of 5.1%.

Historical CAGR (2019 to 2023) 2.9%
Forecast CAGR (2024 to 2034) 5.1%
  • Between 2019 to 2023, the global fabric inspection machine market faced slow growth.
  • Declining demand was due to economic uncertainties and disruptions caused by the COVID-19 pandemic. It has impacted industrial activities and investment decisions worldwide.
  • The onset of the COVID-19 pandemic led to several factors contributing to slow growth of the global fabric inspection machine market between 2019 to 2023.
  • Widespread lockdowns and restrictions disrupted manufacturing & supply chain operations. These further caused delays and shortages in the production of inspection machines for fabric.

Future Scope of the Fabric Inspection Machine Market

  • Over the forecast period, the global fabric inspection machine market is poised to exhibit healthy growth, totaling a valuation of USD 301.4 million by 2034.
  • Ever-increasing demand for high-quality textiles and advancements in inspection technologies are projected to aid growth.
  • Pervasive trend of automation in manufacturing processes is likely to fuel demand.
  • Industries are prioritizing efficiency, precision, and compliance with stringent quality standards. Hence, fabric inspection machines are set to play a pivotal role in meeting these requirements.
  • The growth underscores the vital role fabric inspection equipment plays in enhancing production efficiency.
  • They are set to help in reducing defects and meeting the evolving expectations of consumers & regulatory standards.

Key Drivers of Growth in the Fabric Inspection Machine Market

Expanding Textile Industry Fuels Demand for Fabric Inspection Equipment

  • The burgeoning textile industry stands as a formidable driver in propelling demand for fabric inspection equipment.
  • Growth of the textile industry, marked by increasing manufacturing activities and surging textile consumption, has spurred the need for quality assurance in production processes.
  • The expanding sector is characterized by the production of diverse textiles for apparel, home furnishings, and industrial applications.
  • It necessitates advanced inspection technologies to ensure the delivery of flawless end-products.
  • As textile manufacturers strive to keep pace with escalating demand, the integration of cloth-checking machines becomes indispensable.
  • The machines play a pivotal role in identifying and rectifying defects in woven and knitted fabrics, ensuring uniformity and adherence to quality standards.
  • With the textile industry embracing automation and efficiency-enhancing measures, fabric inspection machines offer a systematic approach to quality control.
  • The machines are set to help in minimizing defects and optimizing production efficiency.
  • Emphasis on sustainability in textiles accentuates the significance of fabric inspection equipment in ensuring eco-friendly and socially responsible manufacturing practices.
  • As the textile industry expands its horizons, demand for advanced fabric inspection solutions is poised to rise.

Surging Demand for Quality to Propel Fabric Inspection Machine Sales

  • Surging demand for quality stands as a paramount driver, propelling the fabric inspection machine market into a key role across the textile industry.
  • As consumers become increasingly discerning and place a premium on superior products, manufacturers are compelled to meet these heightened expectations.
  • It requires a robust integration of fabric inspection machines throughout the production process.
  • The imperative to deliver high-quality textiles is underscored by consumers seeking durability, aesthetics, and product excellence.
  • Fabric inspection machines play a crucial role in this scenario, meticulously identifying and rectifying defects in woven and knitted fabrics.
  • By ensuring uniformity and adherence to stringent quality standards, these machines contribute significantly to meeting the evolving expectations of consumers.
  • Manufacturers are investing in advanced fabric inspection technologies to fortify their quality control measures.

Technological Advancements Drive the Evolution of Fabric Inspection Machines

  • In the dynamic landscape of fabric inspection machines, technological advancements emerge as a driving force.
  • The market is characterized by a constant quest for improvement, with advancements in sensor technologies, imaging systems, and automation features. These are shaping the development of more sophisticated fabric inspection machines.
  • Continuous innovation ensures that these machines remain at the forefront of efficiency, precision, and functionality.
  • As fabric defect detection technologies evolve, enhanced capabilities, such as faster defect detection, improved accuracy, and ability to handle diverse fabrics seamlessly, rise.
  • Innovations in AI and machine learning contribute to the refinement of inspection processes. These enable the machines to adapt and optimize their performance based on varying production requirements.
  • Integration of cutting-edge technologies not only elevates the performance of knitted fabric inspection machines but also addresses industry challenges.
  • Need for real-time data analysis and the ability to handle large volumes of fabric with speed & precision are met by these machines.

Key Factors Restraining Growth in the Fabric Inspection Machine Market

Limited Adoption of Fabric Inspection Machines in Small-scale Textile Operations

  • Limited adoption of fabric inspection machines in small-scale operations represents a noteworthy restraint in the textile manufacturing landscape.
  • For small-scale textile producers with comparatively lower production volumes, these cutting-edge machines may be perceived as impractical or financially unfeasible.
  • Substantial upfront investments required to procure and implement fabric inspection machines stand as a significant barrier.
  • High initial cost often deters small players from incorporating this advanced technology into their production processes.
  • Small-scale textile companies often operate within tight budget constraints, which makes acquiring expensive fabric inspection machinery a challenging proposition.
  • Cost-benefit analysis may not always favor the integration of these machines, particularly when the production volumes are not substantial enough to justify the initial investment.
  • The perceived impracticality stems from the challenge of achieving a reasonable return on investment within a reasonable timeframe.

Analysis of Top Countries Producing, Formulating, Packaging, Distributing, and Using Fabric Inspection Machines

The table below highlights fabric inspection machine market revenues of several countries. China, the United States, India, and Japan are expected to reach valuations of USD 65.9 million, USD 36.5 million, USD 28.3 million, and USD 24.7 million, respectively, in 2034.

Countries Fabric Inspection Machine Market Revenue (2034)
China USD 65.9 million
United States USD 36.5 million
India USD 28.3 million
Japan USD 24.7 million
Germany USD 14.5 million
United Kingdom USD 7.8 million

The table below shows the estimated growth rates of several countries in the global fabric roll inspection system market. India, China, and the United States are set to record high CAGRs of 4.7%, 3.9%, and 2.8%, respectively, through 2034.

Countries Projected Fabric Inspection Machine Market CAGR (2024 to 2034)
India 4.7%
China 3.9%
United States 2.8%
Japan 2.3%
Germany 1.9%
United Kingdom 1.6%

Business Reorientation in the United States Spurs Fabric Machine Demand

Sales of fabric inspection machines in the United States are projected to soar at a CAGR of around 2.8% during the assessment period. Total valuation in the country is anticipated to reach USD 36.5 million by 2034.

  • The United States textile industry is witnessing a resurgence with a renewed focus on quality and efficiency.
  • Fabric inspection machines play a key role in meeting the rising demand for high-quality textiles by ensuring rigorous quality control throughout the production process.
  • In 2018, in terms of export value, the United States ranked among the top markets globally at USD 23 billion.
  • The garment market in the United States was valued at USD 311 billion in 2019.
  • Leading players in the country are increasingly investing in reassembling their business strategies to compete with their rivals.

China Sees High Digital Multi-function Fabric Inspection Machine Demand

China’s fabric inspection machine market size is projected to reach USD 65.9 million by 2034. Over the assessment period, demand for fabric inspection machines in China is set to rise at 3.9% CAGR.

  • China’s robust textile sector, marked by increased production activities and growing global demand for textiles, has necessitated advanced quality control measures.
  • China's strategic position as a global manufacturing hub has amplified the adoption of these machines to ensure the delivery of impeccable and standardized textile products.
  • China manufactured over 2.77 billion meters of apparel fabric as of December 2023.
  • Over the previous year, the average monthly production of textiles was 2.72 billion meters.

Strict Quality Norms in India Boost Sales of Stretch Fabric Inspection Machines

India's fabric inspection machine market is poised to exhibit a CAGR of 4.7% during the assessment period. It is expected to attain a fabric quality control machine market valuation of USD 28.3 million by 2034.

  • India’s fabric inspection machine market is expanding robustly, fueled by the country's dynamic textile industry.
  • With a burgeoning textile sector and growing global demand for Indian textiles, the need for precise quality control has become paramount.
  • India's textile manufacturing landscape is witnessing significant modernization.
  • Fabric inspection machines are integral to the country’s transformation, ensuring the production of textiles that meet stringent quality standards.

Fabric Inspection Machine Industry Analysis by Top Investment Segments

The section below shows the roll-to-roll inspection machines segment dominating based on product type in the textile inspection equipment market. It is forecast to thrive at 5.6% CAGR between 2024 to 2034.

Based on the end-use industry, the textiles and apparel segment is anticipated to hold a dominant share through 2034. It is set to exhibit a CAGR of 5.1% during the forecast period.

Fabric Inspection cum Rolling Machines to Witness High Demand

Top Segment (Product Type) Roll-to-roll Inspection Machines
Predicted CAGR (2024 to 2034) 5.6%
  • Over the forecast period, demand for roll-to-roll inspection machines is anticipated to rise at a CAGR of 5.6% CAGR.
  • Dominance of roll-to-roll inspection machines in the global fabric inspection machine market is attributed to their unparalleled versatility and efficiency.
  • Roll-to-roll machines excel in handling continuous fabric rolls, offering a seamless and rapid inspection process.
  • Their capability to inspect multiple fabric types, including woven and knitted fabrics, positions them as a universal solution for textile manufacturers.
  • Fabric inspection and rolling machines contribute significantly to maintaining high-quality standards by swiftly identifying defects and irregularities during production.

Textiles and Apparel Industry to Look for Automated Fabric Inspection Machines

Top Segment (End-use Industry) Textiles and Apparel
Projected CAGR (2024 to 2034) 5.1%
  • The textiles and apparel segment is projected to thrive at 5.1% CAGR during the estimated period.
  • Demand for fabric inspection machines remains consistently high in the textiles and apparel industry due to their crucial role in ensuring and enhancing product quality.
  • Textile manufacturers rely on these machines for meticulous inspection, identifying and rectifying defects in fabrics during the production process.
  • The textile and apparel sector, characterized by stringent quality standards and high consumer expectations, necessitates robust quality control measures.
  • Fabric inspection machines offer a systematic approach to detecting flaws, irregularities, or variations in the fabric. These help in ensuring that the end products meet or exceed industry standards.

Competitive Landscape of the Fabric Inspection Machine Market

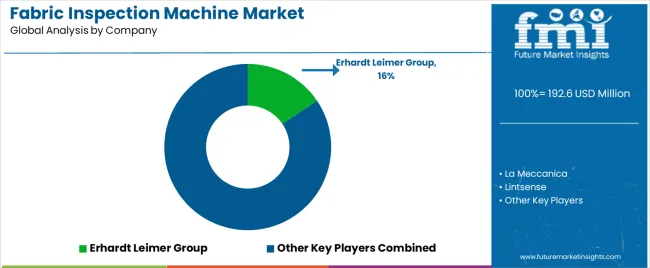
The global fabric inspection machine market is consolidated, with leading players accounting for about 40 to 45% share. La Meccanica, Lintsense, A. Monforts Textilmaschinen GmbH & Co. KG, BST eltromat International GmbH., Erhardt Leimer Group., FEW Textile Machinery Company, Tecnorama, Zhejiang LICHENG Group, and Embee Corporation are the leading manufacturers and suppliers of fabric inspection machines listed in the report.

Leading fabric inspection machine manufacturers are focusing on technological advancements in their existing product lines to attract a large consumer base. They are aiming to develop new production facilities across niche areas. A few other players are engaging in mergers and acquisitions to co-develop innovative systems. They are showcasing their unique products in exhibitions.

Recent Developments in Fabric Inspection Machine Market

  • In May 2023, Erhardt+Leimer Group showcased Elclean modular web cleaning system, Elmeta MDA 1005 / 1006 metal detector, and Elseamtex SI 1001 seam sensor at ITMA 2023. The company also exhibited tension-feeding devices, web-spreading tools, and product guiding systems.
  • In February 2021, Bullmer introduced an AI-based fabric inspection technology called AI 01. The Germany-based firm is the wholly owned subsidiary of Jack Stock, China’s renowned technology firm. The technology would help textile and clothing factories reduce their high defect rate.

Key Coverage in the Fabric Inspection Machine Market Report

  • Fabric Inspection Machines Manufacturers & Suppliers in India
  • AI-based Fabric Inspection System Market Size and Share
  • Latest Fabric Inspection Machines for Textile Mills and Garment Manufacturers
  • Market Size of Tubular Fabric Inspection Machine
  • Global Fabric Inspection Machines Market Forecast
  • Insights into Camera Based Visual Fabric Inspection
  • Semi-automatic Fabric Inspection Machines for Textile Industry
  • Innovative Strategies and Business Segments of Textile Surface Inspection Machine Market
  • Details of Fabric Inspection Machine Manufacturers like Patco Exports Pvt. Ltd., B-Tex Textile Machinery, and Pacorr
  • Market Size of the Tubular Fabric Inspection Machine
  • Information about Adjacent Markets like Fabric Roll Measurement Machine Market, Textile Roll Inspection System Market, Fabric Quality Assessment Machine Market, and Fabric Pattern Inspection System Market

Scope and Coverage of the Fabric Inspection Machine Market Report

Attribute Details
Estimated Fabric Inspection Machine Market Size (2024) USD 183.3 million
Projected Fabric Inspection Machine Market Size (2034) USD 301.4 million
Anticipated Growth Rate of Fabric Inspection Machine Market (2024 to 2034) 5.1% CAGR
Historical Data 2019 to 2023
Forecast Period 2024 to 2034
Quantitative Units Value (USD million) and Volume (units)
Report Coverage Revenue Forecast, Volume Forecast, Company Ranking, Competitive Landscape, Growth Factors, Trends, and Pricing Analysis
Fabric Inspection Machine Market Segments Covered Product Type, Technology, End-use Industry, Region
Regions Covered North America; Latin America; Eastern Europe; Western Europe; East Asia; South Asia Pacific; Middle East Africa
Key Countries Covered United States, Canada, Mexico, Brazil, Germany, Italy, France, United Kingdom, Spain, BENELUX, NORDICS, Poland, Hungary, Balkan and Baltics, Russia, India, Association of Southeast Asian Nations, Australia and New Zealand, China, Japan, South Korea, Kingdom of Saudi Arabia, Other GCC Countries, Türkiye, Other African Union, South Africa
Key Companies Profiled La Meccanica; Lintsense; A. Monforts Textilmaschinen GmbH & Co. KG; BST eltromat International GmbH; Erhardt Leimer Group; FEW Textile Machinery Company; Tecnorama; Carù Srl; Dantex Group; Zhejiang LICHENG Group; Embee Corporation; Yuyao Textile Machinery; Matic; MTS Maschinenbau; PLM Impianti; Chevalerin; Caron Technology; Menzel Maschinenbau

Top Segments Studied in the Fabric Inspection Machine Market

By Product Type:

  • Roll-to-roll Inspection Machines
  • Flatbed Inspection Machines
  • Woven Fabric Inspection Machines
  • Knitted Fabric Inspection machines
  • Coating and Laminating Inspection Machines

By Technology:

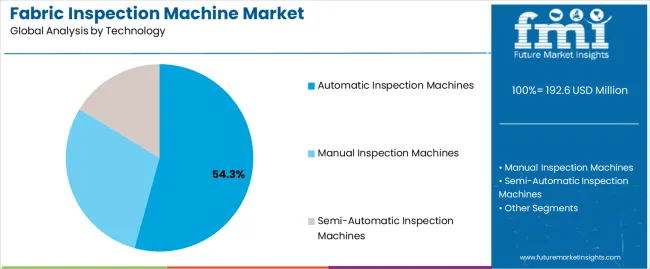
  • Manual Inspection Machines
  • Semi-automatic Inspection Machines
  • Automatic Inspection Machines

By End-use Industry:

  • Textiles and Apparel
  • Automotive
  • Home Textiles
  • Technical Textiles
  • Others

By Region:

  • North America
  • Latin America
  • Eastern Europe
  • Western Europe
  • East Asia
  • South Asia Pacific
  • Middle East Africa

Table of Content

  • 1. Executive Summary
  • 2. Market Overview
  • 3. Key Market Trends
  • 4. Key Success Factors
  • 5. Global Market Demand Analysis 2019 to 2023 and Forecast, 2024 to 2034
  • 6. Global Market - Pricing Analysis
  • 7. Global Market Demand (in Value or Size in US$ million) Analysis 2019 to 2023 and Forecast, 2024 to 2034
  • 8. Market Background
    • 8.1. Macro-Economic Factors
    • 8.2. Forecast Factors - Relevance & Impact
    • 8.3. Value Chain
    • 8.4. Market Dynamics
    • 8.5. Patent Analysis
    • 8.6. PESTLE Analysis
  • 9. Global Market Analysis 2019 to 2023 and Forecast 2024 to 2034, By Product Type
    • 9.1. Roll-to-roll Inspection Machines
    • 9.2. Flatbed Inspection Machines
    • 9.3. Woven Fabric Inspection Machines
    • 9.4. Knitted Fabric Inspection Machines
    • 9.5. Coating and Laminating Inspection Machines
  • 10. Global Market Analysis 2019 to 2023 and Forecast 2024 to 2034, By Technology
    • 10.1. Manual Inspection Machines
    • 10.2. Semi-automatic Inspection Machines
    • 10.3. Automatic Inspection Machines
  • 11. Global Market Analysis 2019 to 2023 and Forecast 2024 to 2034, By End-use Industry
    • 11.1. Textiles and Apparel
    • 11.2. Automotive
    • 11.3. Home Textiles
    • 11.4. Technical Textiles
    • 11.5. Others
  • 12. Global Market Analysis 2019 to 2023 and Forecast 2024 to 2034, By Region
    • 12.1. North America
    • 12.2. Latin America
    • 12.3. East Asia
    • 12.4. South Asia Pacific
    • 12.5. Western Europe
    • 12.6. Eastern Europe
    • 12.7. Middle East and Africa
  • 13. North America Market Analysis 2019 to 2023 and Forecast 2024 to 2034
  • 14. Latin America Market Analysis 2019 to 2023 and Forecast 2024 to 2034
  • 15. East Asia Market Analysis 2019 to 2023 and Forecast 2024 to 2034
  • 16. South Asia Pacific Market Analysis 2019 to 2023 and Forecast 2024 to 2034
  • 17. Western Europe Market Analysis 2019 to 2023 and Forecast 2024 to 2034
  • 18. Eastern Europe Market Analysis 2019 to 2023 and Forecast 2024 to 2034
  • 19. Middle East and Africa Market Analysis 2019 to 2023 and Forecast 2024 to 2034
  • 20. Country-wise Market Analysis
  • 21. Market Structure Analysis
  • 22. Competition Analysis
    • 22.1. La Meccanica
    • 22.2. Lintsense
    • 22.3. A. Monforts Textilmaschinen GmbH & Co. KG
    • 22.4. BST eltromat International GmbH
    • 22.5. Erhardt Leimer Group
    • 22.6. FEW Textile Machinery Company
    • 22.7. Tecnorama
    • 22.8. Carù Srl
    • 22.9. Dantex Group
    • 22.10. Zhejiang LICHENG Group
    • 22.11. Embee Corporation
    • 22.12. Yuyao Textile Machinery
    • 22.13. Matic
    • 22.14. MTS Maschinenbau
    • 22.15. PLM Impianti
    • 22.16. Chevalerin
    • 22.17. Caron Technology
    • 22.18. Menzel Maschinenbau
    • 22.19. Other Key Players
  • 23. Assumptions and Acronyms Used
  • 24. Research Methodology

List of Tables

Table 1: Global Market Value (US$ million) Forecast by Region, 2019 to 2034

Table 2: Global Market Volume (Units) Forecast by Region, 2019 to 2034

Table 3: Global Market Value (US$ million) Forecast by Product Type, 2019 to 2034

Table 4: Global Market Volume (Units) Forecast by Product Type, 2019 to 2034

Table 5: Global Market Value (US$ million) Forecast by Technology Type, 2019 to 2034

Table 6: Global Market Volume (Units) Forecast by Technology Type, 2019 to 2034

Table 7: Global Market Value (US$ million) Forecast by End-use Industry, 2019 to 2034

Table 8: Global Market Volume (Units) Forecast by End-use Industry, 2019 to 2034

Table 9: North America Market Value (US$ million) Forecast by Country, 2019 to 2034

Table 10: North America Market Volume (Units) Forecast by Country, 2019 to 2034

Table 11: North America Market Value (US$ million) Forecast by Product Type, 2019 to 2034

Table 12: North America Market Volume (Units) Forecast by Product Type, 2019 to 2034

Table 13: North America Market Value (US$ million) Forecast by Technology Type, 2019 to 2034

Table 14: North America Market Volume (Units) Forecast by Technology Type, 2019 to 2034

Table 15: North America Market Value (US$ million) Forecast by End-use Industry, 2019 to 2034

Table 16: North America Market Volume (Units) Forecast by End-use Industry, 2019 to 2034

Table 17: Latin America Market Value (US$ million) Forecast by Country, 2019 to 2034

Table 18: Latin America Market Volume (Units) Forecast by Country, 2019 to 2034

Table 19: Latin America Market Value (US$ million) Forecast by Product Type, 2019 to 2034

Table 20: Latin America Market Volume (Units) Forecast by Product Type, 2019 to 2034

Table 21: Latin America Market Value (US$ million) Forecast by Technology Type, 2019 to 2034

Table 22: Latin America Market Volume (Units) Forecast by Technology Type, 2019 to 2034

Table 23: Latin America Market Value (US$ million) Forecast by End-use Industry, 2019 to 2034

Table 24: Latin America Market Volume (Units) Forecast by End-use Industry, 2019 to 2034

Table 25: Western Europe Market Value (US$ million) Forecast by Country, 2019 to 2034

Table 26: Western Europe Market Volume (Units) Forecast by Country, 2019 to 2034

Table 27: Western Europe Market Value (US$ million) Forecast by Product Type, 2019 to 2034

Table 28: Western Europe Market Volume (Units) Forecast by Product Type, 2019 to 2034

Table 29: Western Europe Market Value (US$ million) Forecast by Technology Type, 2019 to 2034

Table 30: Western Europe Market Volume (Units) Forecast by Technology Type, 2019 to 2034

Table 31: Western Europe Market Value (US$ million) Forecast by End-use Industry, 2019 to 2034

Table 32: Western Europe Market Volume (Units) Forecast by End-use Industry, 2019 to 2034

Table 33: Eastern Europe Market Value (US$ million) Forecast by Country, 2019 to 2034

Table 34: Eastern Europe Market Volume (Units) Forecast by Country, 2019 to 2034

Table 35: Eastern Europe Market Value (US$ million) Forecast by Product Type, 2019 to 2034

Table 36: Eastern Europe Market Volume (Units) Forecast by Product Type, 2019 to 2034

Table 37: Eastern Europe Market Value (US$ million) Forecast by Technology Type, 2019 to 2034

Table 38: Eastern Europe Market Volume (Units) Forecast by Technology Type, 2019 to 2034

Table 39: Eastern Europe Market Value (US$ million) Forecast by End-use Industry, 2019 to 2034

Table 40: Eastern Europe Market Volume (Units) Forecast by End-use Industry, 2019 to 2034

Table 41: East Asia Market Value (US$ million) Forecast by Country, 2019 to 2034

Table 42: East Asia Market Volume (Units) Forecast by Country, 2019 to 2034

Table 43: East Asia Market Value (US$ million) Forecast by Product Type, 2019 to 2034

Table 44: East Asia Market Volume (Units) Forecast by Product Type, 2019 to 2034

Table 45: East Asia Market Value (US$ million) Forecast by Technology Type, 2019 to 2034

Table 46: East Asia Market Volume (Units) Forecast by Technology Type, 2019 to 2034

Table 47: East Asia Market Value (US$ million) Forecast by End-use Industry, 2019 to 2034

Table 48: East Asia Market Volume (Units) Forecast by End-use Industry, 2019 to 2034

Table 49: South Asia Pacific Market Value (US$ million) Forecast by Country, 2019 to 2034

Table 50: South Asia Pacific Market Volume (Units) Forecast by Country, 2019 to 2034

Table 51: South Asia Pacific Market Value (US$ million) Forecast by Product Type, 2019 to 2034

Table 52: South Asia Pacific Market Volume (Units) Forecast by Product Type, 2019 to 2034

Table 53: South Asia Pacific Market Value (US$ million) Forecast by Technology Type, 2019 to 2034

Table 54: South Asia Pacific Market Volume (Units) Forecast by Technology Type, 2019 to 2034

Table 55: South Asia Pacific Market Value (US$ million) Forecast by End-use Industry, 2019 to 2034

Table 56: South Asia Pacific Market Volume (Units) Forecast by End-use Industry, 2019 to 2034

Table 57: Middle East & Africa Market Value (US$ million) Forecast by Country, 2019 to 2034

Table 58: Middle East & Africa Market Volume (Units) Forecast by Country, 2019 to 2034

Table 59: Middle East & Africa Market Value (US$ million) Forecast by Product Type, 2019 to 2034

Table 60: Middle East & Africa Market Volume (Units) Forecast by Product Type, 2019 to 2034

Table 61: Middle East & Africa Market Value (US$ million) Forecast by Technology Type, 2019 to 2034

Table 62: Middle East & Africa Market Volume (Units) Forecast by Technology Type, 2019 to 2034

Table 63: Middle East & Africa Market Value (US$ million) Forecast by End-use Industry, 2019 to 2034

Table 64: Middle East & Africa Market Volume (Units) Forecast by End-use Industry, 2019 to 2034

List of Figures

Figure 1: Global Market Value (US$ million) by Product Type, 2024 to 2034

Figure 2: Global Market Value (US$ million) by Technology Type, 2024 to 2034

Figure 3: Global Market Value (US$ million) by End-use Industry, 2024 to 2034

Figure 4: Global Market Value (US$ million) by Region, 2024 to 2034

Figure 5: Global Market Value (US$ million) Analysis by Region, 2019 to 2034

Figure 6: Global Market Volume (Units) Analysis by Region, 2019 to 2034

Figure 7: Global Market Value Share (%) and BPS Analysis by Region, 2024 to 2034

Figure 8: Global Market Y-o-Y Growth (%) Projections by Region, 2024 to 2034

Figure 9: Global Market Value (US$ million) Analysis by Product Type, 2019 to 2034

Figure 10: Global Market Volume (Units) Analysis by Product Type, 2019 to 2034

Figure 11: Global Market Value Share (%) and BPS Analysis by Product Type, 2024 to 2034

Figure 12: Global Market Y-o-Y Growth (%) Projections by Product Type, 2024 to 2034

Figure 13: Global Market Value (US$ million) Analysis by Technology Type, 2019 to 2034

Figure 14: Global Market Volume (Units) Analysis by Technology Type, 2019 to 2034

Figure 15: Global Market Value Share (%) and BPS Analysis by Technology Type, 2024 to 2034

Figure 16: Global Market Y-o-Y Growth (%) Projections by Technology Type, 2024 to 2034

Figure 17: Global Market Value (US$ million) Analysis by End-use Industry, 2019 to 2034

Figure 18: Global Market Volume (Units) Analysis by End-use Industry, 2019 to 2034

Figure 19: Global Market Value Share (%) and BPS Analysis by End-use Industry, 2024 to 2034

Figure 20: Global Market Y-o-Y Growth (%) Projections by End-use Industry, 2024 to 2034

Figure 21: Global Market Attractiveness by Product Type, 2024 to 2034

Figure 22: Global Market Attractiveness by Technology Type, 2024 to 2034

Figure 23: Global Market Attractiveness by End-use Industry, 2024 to 2034

Figure 24: Global Market Attractiveness by Region, 2024 to 2034

Figure 25: North America Market Value (US$ million) by Product Type, 2024 to 2034

Figure 26: North America Market Value (US$ million) by Technology Type, 2024 to 2034

Figure 27: North America Market Value (US$ million) by End-use Industry, 2024 to 2034

Figure 28: North America Market Value (US$ million) by Country, 2024 to 2034

Figure 29: North America Market Value (US$ million) Analysis by Country, 2019 to 2034

Figure 30: North America Market Volume (Units) Analysis by Country, 2019 to 2034

Figure 31: North America Market Value Share (%) and BPS Analysis by Country, 2024 to 2034

Figure 32: North America Market Y-o-Y Growth (%) Projections by Country, 2024 to 2034

Figure 33: North America Market Value (US$ million) Analysis by Product Type, 2019 to 2034

Figure 34: North America Market Volume (Units) Analysis by Product Type, 2019 to 2034

Figure 35: North America Market Value Share (%) and BPS Analysis by Product Type, 2024 to 2034

Figure 36: North America Market Y-o-Y Growth (%) Projections by Product Type, 2024 to 2034

Figure 37: North America Market Value (US$ million) Analysis by Technology Type, 2019 to 2034

Figure 38: North America Market Volume (Units) Analysis by Technology Type, 2019 to 2034

Figure 39: North America Market Value Share (%) and BPS Analysis by Technology Type, 2024 to 2034

Figure 40: North America Market Y-o-Y Growth (%) Projections by Technology Type, 2024 to 2034

Figure 41: North America Market Value (US$ million) Analysis by End-use Industry, 2019 to 2034

Figure 42: North America Market Volume (Units) Analysis by End-use Industry, 2019 to 2034

Figure 43: North America Market Value Share (%) and BPS Analysis by End-use Industry, 2024 to 2034

Figure 44: North America Market Y-o-Y Growth (%) Projections by End-use Industry, 2024 to 2034

Figure 45: North America Market Attractiveness by Product Type, 2024 to 2034

Figure 46: North America Market Attractiveness by Technology Type, 2024 to 2034

Figure 47: North America Market Attractiveness by End-use Industry, 2024 to 2034

Figure 48: North America Market Attractiveness by Country, 2024 to 2034

Figure 49: Latin America Market Value (US$ million) by Product Type, 2024 to 2034

Figure 50: Latin America Market Value (US$ million) by Technology Type, 2024 to 2034

Figure 51: Latin America Market Value (US$ million) by End-use Industry, 2024 to 2034

Figure 52: Latin America Market Value (US$ million) by Country, 2024 to 2034

Figure 53: Latin America Market Value (US$ million) Analysis by Country, 2019 to 2034

Figure 54: Latin America Market Volume (Units) Analysis by Country, 2019 to 2034

Figure 55: Latin America Market Value Share (%) and BPS Analysis by Country, 2024 to 2034

Figure 56: Latin America Market Y-o-Y Growth (%) Projections by Country, 2024 to 2034

Figure 57: Latin America Market Value (US$ million) Analysis by Product Type, 2019 to 2034

Figure 58: Latin America Market Volume (Units) Analysis by Product Type, 2019 to 2034

Figure 59: Latin America Market Value Share (%) and BPS Analysis by Product Type, 2024 to 2034

Figure 60: Latin America Market Y-o-Y Growth (%) Projections by Product Type, 2024 to 2034

Figure 61: Latin America Market Value (US$ million) Analysis by Technology Type, 2019 to 2034

Figure 62: Latin America Market Volume (Units) Analysis by Technology Type, 2019 to 2034

Figure 63: Latin America Market Value Share (%) and BPS Analysis by Technology Type, 2024 to 2034

Figure 64: Latin America Market Y-o-Y Growth (%) Projections by Technology Type, 2024 to 2034

Figure 65: Latin America Market Value (US$ million) Analysis by End-use Industry, 2019 to 2034

Figure 66: Latin America Market Volume (Units) Analysis by End-use Industry, 2019 to 2034

Figure 67: Latin America Market Value Share (%) and BPS Analysis by End-use Industry, 2024 to 2034

Figure 68: Latin America Market Y-o-Y Growth (%) Projections by End-use Industry, 2024 to 2034

Figure 69: Latin America Market Attractiveness by Product Type, 2024 to 2034

Figure 70: Latin America Market Attractiveness by Technology Type, 2024 to 2034

Figure 71: Latin America Market Attractiveness by End-use Industry, 2024 to 2034

Figure 72: Latin America Market Attractiveness by Country, 2024 to 2034

Figure 73: Western Europe Market Value (US$ million) by Product Type, 2024 to 2034

Figure 74: Western Europe Market Value (US$ million) by Technology Type, 2024 to 2034

Figure 75: Western Europe Market Value (US$ million) by End-use Industry, 2024 to 2034

Figure 76: Western Europe Market Value (US$ million) by Country, 2024 to 2034

Figure 77: Western Europe Market Value (US$ million) Analysis by Country, 2019 to 2034

Figure 78: Western Europe Market Volume (Units) Analysis by Country, 2019 to 2034

Figure 79: Western Europe Market Value Share (%) and BPS Analysis by Country, 2024 to 2034

Figure 80: Western Europe Market Y-o-Y Growth (%) Projections by Country, 2024 to 2034

Figure 81: Western Europe Market Value (US$ million) Analysis by Product Type, 2019 to 2034

Figure 82: Western Europe Market Volume (Units) Analysis by Product Type, 2019 to 2034

Figure 83: Western Europe Market Value Share (%) and BPS Analysis by Product Type, 2024 to 2034

Figure 84: Western Europe Market Y-o-Y Growth (%) Projections by Product Type, 2024 to 2034

Figure 85: Western Europe Market Value (US$ million) Analysis by Technology Type, 2019 to 2034

Figure 86: Western Europe Market Volume (Units) Analysis by Technology Type, 2019 to 2034

Figure 87: Western Europe Market Value Share (%) and BPS Analysis by Technology Type, 2024 to 2034

Figure 88: Western Europe Market Y-o-Y Growth (%) Projections by Technology Type, 2024 to 2034

Figure 89: Western Europe Market Value (US$ million) Analysis by End-use Industry, 2019 to 2034

Figure 90: Western Europe Market Volume (Units) Analysis by End-use Industry, 2019 to 2034

Figure 91: Western Europe Market Value Share (%) and BPS Analysis by End-use Industry, 2024 to 2034

Figure 92: Western Europe Market Y-o-Y Growth (%) Projections by End-use Industry, 2024 to 2034

Figure 93: Western Europe Market Attractiveness by Product Type, 2024 to 2034

Figure 94: Western Europe Market Attractiveness by Technology Type, 2024 to 2034

Figure 95: Western Europe Market Attractiveness by End-use Industry, 2024 to 2034

Figure 96: Western Europe Market Attractiveness by Country, 2024 to 2034

Figure 97: Eastern Europe Market Value (US$ million) by Product Type, 2024 to 2034

Figure 98: Eastern Europe Market Value (US$ million) by Technology Type, 2024 to 2034

Figure 99: Eastern Europe Market Value (US$ million) by End-use Industry, 2024 to 2034

Figure 100: Eastern Europe Market Value (US$ million) by Country, 2024 to 2034

Figure 101: Eastern Europe Market Value (US$ million) Analysis by Country, 2019 to 2034

Figure 102: Eastern Europe Market Volume (Units) Analysis by Country, 2019 to 2034

Figure 103: Eastern Europe Market Value Share (%) and BPS Analysis by Country, 2024 to 2034

Figure 104: Eastern Europe Market Y-o-Y Growth (%) Projections by Country, 2024 to 2034

Figure 105: Eastern Europe Market Value (US$ million) Analysis by Product Type, 2019 to 2034

Figure 106: Eastern Europe Market Volume (Units) Analysis by Product Type, 2019 to 2034

Figure 107: Eastern Europe Market Value Share (%) and BPS Analysis by Product Type, 2024 to 2034

Figure 108: Eastern Europe Market Y-o-Y Growth (%) Projections by Product Type, 2024 to 2034

Figure 109: Eastern Europe Market Value (US$ million) Analysis by Technology Type, 2019 to 2034

Figure 110: Eastern Europe Market Volume (Units) Analysis by Technology Type, 2019 to 2034

Figure 111: Eastern Europe Market Value Share (%) and BPS Analysis by Technology Type, 2024 to 2034

Figure 112: Eastern Europe Market Y-o-Y Growth (%) Projections by Technology Type, 2024 to 2034

Figure 113: Eastern Europe Market Value (US$ million) Analysis by End-use Industry, 2019 to 2034

Figure 114: Eastern Europe Market Volume (Units) Analysis by End-use Industry, 2019 to 2034

Figure 115: Eastern Europe Market Value Share (%) and BPS Analysis by End-use Industry, 2024 to 2034

Figure 116: Eastern Europe Market Y-o-Y Growth (%) Projections by End-use Industry, 2024 to 2034

Figure 117: Eastern Europe Market Attractiveness by Product Type, 2024 to 2034

Figure 118: Eastern Europe Market Attractiveness by Technology Type, 2024 to 2034

Figure 119: Eastern Europe Market Attractiveness by End-use Industry, 2024 to 2034

Figure 120: Eastern Europe Market Attractiveness by Country, 2024 to 2034

Figure 121: East Asia Market Value (US$ million) by Product Type, 2024 to 2034

Figure 122: East Asia Market Value (US$ million) by Technology Type, 2024 to 2034

Figure 123: East Asia Market Value (US$ million) by End-use Industry, 2024 to 2034

Figure 124: East Asia Market Value (US$ million) by Country, 2024 to 2034

Figure 125: East Asia Market Value (US$ million) Analysis by Country, 2019 to 2034

Figure 126: East Asia Market Volume (Units) Analysis by Country, 2019 to 2034

Figure 127: East Asia Market Value Share (%) and BPS Analysis by Country, 2024 to 2034

Figure 128: East Asia Market Y-o-Y Growth (%) Projections by Country, 2024 to 2034

Figure 129: East Asia Market Value (US$ million) Analysis by Product Type, 2019 to 2034

Figure 130: East Asia Market Volume (Units) Analysis by Product Type, 2019 to 2034

Figure 131: East Asia Market Value Share (%) and BPS Analysis by Product Type, 2024 to 2034

Figure 132: East Asia Market Y-o-Y Growth (%) Projections by Product Type, 2024 to 2034

Figure 133: East Asia Market Value (US$ million) Analysis by Technology Type, 2019 to 2034

Figure 134: East Asia Market Volume (Units) Analysis by Technology Type, 2019 to 2034

Figure 135: East Asia Market Value Share (%) and BPS Analysis by Technology Type, 2024 to 2034

Figure 136: East Asia Market Y-o-Y Growth (%) Projections by Technology Type, 2024 to 2034

Figure 137: East Asia Market Value (US$ million) Analysis by End-use Industry, 2019 to 2034

Figure 138: East Asia Market Volume (Units) Analysis by End-use Industry, 2019 to 2034

Figure 139: East Asia Market Value Share (%) and BPS Analysis by End-use Industry, 2024 to 2034

Figure 140: East Asia Market Y-o-Y Growth (%) Projections by End-use Industry, 2024 to 2034

Figure 141: East Asia Market Attractiveness by Product Type, 2024 to 2034

Figure 142: East Asia Market Attractiveness by Technology Type, 2024 to 2034

Figure 143: East Asia Market Attractiveness by End-use Industry, 2024 to 2034

Figure 144: East Asia Market Attractiveness by Country, 2024 to 2034

Figure 145: South Asia Pacific Market Value (US$ million) by Product Type, 2024 to 2034

Figure 146: South Asia Pacific Market Value (US$ million) by Technology Type, 2024 to 2034

Figure 147: South Asia Pacific Market Value (US$ million) by End-use Industry, 2024 to 2034

Figure 148: South Asia Pacific Market Value (US$ million) by Country, 2024 to 2034

Figure 149: South Asia Pacific Market Value (US$ million) Analysis by Country, 2019 to 2034

Figure 150: South Asia Pacific Market Volume (Units) Analysis by Country, 2019 to 2034

Figure 151: South Asia Pacific Market Value Share (%) and BPS Analysis by Country, 2024 to 2034

Figure 152: South Asia Pacific Market Y-o-Y Growth (%) Projections by Country, 2024 to 2034

Figure 153: South Asia Pacific Market Value (US$ million) Analysis by Product Type, 2019 to 2034

Figure 154: South Asia Pacific Market Volume (Units) Analysis by Product Type, 2019 to 2034

Figure 155: South Asia Pacific Market Value Share (%) and BPS Analysis by Product Type, 2024 to 2034

Figure 156: South Asia Pacific Market Y-o-Y Growth (%) Projections by Product Type, 2024 to 2034

Figure 157: South Asia Pacific Market Value (US$ million) Analysis by Technology Type, 2019 to 2034

Figure 158: South Asia Pacific Market Volume (Units) Analysis by Technology Type, 2019 to 2034

Figure 159: South Asia Pacific Market Value Share (%) and BPS Analysis by Technology Type, 2024 to 2034

Figure 160: South Asia Pacific Market Y-o-Y Growth (%) Projections by Technology Type, 2024 to 2034

Figure 161: South Asia Pacific Market Value (US$ million) Analysis by End-use Industry, 2019 to 2034

Figure 162: South Asia Pacific Market Volume (Units) Analysis by End-use Industry, 2019 to 2034

Figure 163: South Asia Pacific Market Value Share (%) and BPS Analysis by End-use Industry, 2024 to 2034

Figure 164: South Asia Pacific Market Y-o-Y Growth (%) Projections by End-use Industry, 2024 to 2034

Figure 165: South Asia Pacific Market Attractiveness by Product Type, 2024 to 2034

Figure 166: South Asia Pacific Market Attractiveness by Technology Type, 2024 to 2034

Figure 167: South Asia Pacific Market Attractiveness by End-use Industry, 2024 to 2034

Figure 168: South Asia Pacific Market Attractiveness by Country, 2024 to 2034

Figure 169: Middle East & Africa Market Value (US$ million) by Product Type, 2024 to 2034

Figure 170: Middle East & Africa Market Value (US$ million) by Technology Type, 2024 to 2034

Figure 171: Middle East & Africa Market Value (US$ million) by End-use Industry, 2024 to 2034

Figure 172: Middle East & Africa Market Value (US$ million) by Country, 2024 to 2034

Figure 173: Middle East & Africa Market Value (US$ million) Analysis by Country, 2019 to 2034

Figure 174: Middle East & Africa Market Volume (Units) Analysis by Country, 2019 to 2034

Figure 175: Middle East & Africa Market Value Share (%) and BPS Analysis by Country, 2024 to 2034

Figure 176: Middle East & Africa Market Y-o-Y Growth (%) Projections by Country, 2024 to 2034

Figure 177: Middle East & Africa Market Value (US$ million) Analysis by Product Type, 2019 to 2034

Figure 178: Middle East & Africa Market Volume (Units) Analysis by Product Type, 2019 to 2034

Figure 179: Middle East & Africa Market Value Share (%) and BPS Analysis by Product Type, 2024 to 2034

Figure 180: Middle East & Africa Market Y-o-Y Growth (%) Projections by Product Type, 2024 to 2034

Figure 181: Middle East & Africa Market Value (US$ million) Analysis by Technology Type, 2019 to 2034

Figure 182: Middle East & Africa Market Volume (Units) Analysis by Technology Type, 2019 to 2034

Figure 183: Middle East & Africa Market Value Share (%) and BPS Analysis by Technology Type, 2024 to 2034

Figure 184: Middle East & Africa Market Y-o-Y Growth (%) Projections by Technology Type, 2024 to 2034

Figure 185: Middle East & Africa Market Value (US$ million) Analysis by End-use Industry, 2019 to 2034

Figure 186: Middle East & Africa Market Volume (Units) Analysis by End-use Industry, 2019 to 2034

Figure 187: Middle East & Africa Market Value Share (%) and BPS Analysis by End-use Industry, 2024 to 2034

Figure 188: Middle East & Africa Market Y-o-Y Growth (%) Projections by End-use Industry, 2024 to 2034

Figure 189: Middle East & Africa Market Attractiveness by Product Type, 2024 to 2034

Figure 190: Middle East & Africa Market Attractiveness by Technology Type, 2024 to 2034

Figure 191: Middle East & Africa Market Attractiveness by End-use Industry, 2024 to 2034

Figure 192: Middle East & Africa Market Attractiveness by Country, 2024 to 2034

Frequently Asked Questions

What will the fabric inspection machine market size be in 2024?

The fabric inspection machine market is set to reach USD 183.3 million in 2024.

At what rate will the fabric inspection machine market rise through 2034?

Global fabric inspection machine demand is anticipated to rise at 5.1% CAGR.

What is the expected fabric inspection machine market size in 2034?

The global fabric inspection machine market is set to reach USD 301.4 million by 2034.

Which end-use industry is expected to lead the market?

Textiles and apparel is expected to lead the market during the forecast period.

Who are the leading players in the fabric inspection machine market?

La Meccanica, Lintsense and A. Monforts Textilmaschinen GmbH & Co. KG.

Which machine is used to inspect the fabric quality?

Fabric inspection machine is used in garment production units.

What is the capacity of the fabric inspection machine?

Fabric inspection machines have a capacity of 20,000 meters/day.

What is inspection in textile industry?

It is the systematic checking of fabric to detect defects.

What is 4 point system in fabric inspection?

It assigns 4 penalty points as per the importance, quality, and size of defects.

Explore Similar Insights

Future Market Insights

Fabric Inspection Machine Market