Reports

- Global Locations -

Headquarters

Future Market Insights, Inc.

Christiana Corporate, 200
Continental Drive, Suite 401,
Newark, Delaware - 19713,
United States

T: +1-347-918-3531

Americas

Future Market Insights, Inc.

616 Corporate Way, Suite 2-9018,
Valley Cottage, NY 10989, United States

MEA

Future Market Insights

1602-6 Jumeirah Bay X2 Tower, Plot No: JLT-PH2-X2A,
Jumeirah Lakes Towers, Dubai,
United Arab Emirates

Europe

Future Market Insights

3rd Floor, 207 Regent Street,
W1B 3HH London
United Kingdom

T: + 44 (0) 20 8123 9659

Asia Pacific

Future Market Insights

IndiaLand Global Tech Park, Unit UG-1, Behind Grand HighStreet, Phase 1, Hinjawadi, MH, Pune – 411057, India

Fertility Test Market Overview from 2024 to 2034

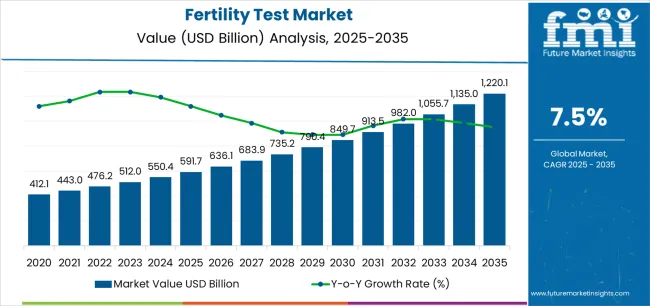
The fertility test market size is expected to develop at a CAGR of 7.9% during the projected period. The growing awareness about infertility and the need for early detection is increasing the sales of fertility test kits. As a result, the market value is projected to increase from US$ 548.4 million in 2024 to US$ 1.2 billion by 2034.

Fertility Test Market Insights and Analysis

  • Many couples today are choosing to delay parenthood until later in life, which can increase the risk of infertility. Consequently, more people are seeking fertility tests to determine their chances of conception and take proactive steps to address any issues.
  • There is a rise in the number of people seeking assisted reproductive technologies (ART). These include procedures like in vitro fertilization (IVF), which can be costly and require significant planning and preparation. Fertility tests can help couples determine if ART is a viable option for them and improve their chances of success.
  • Advancements in technology have also played a significant role in the growth of the fertility test market. The development of more accurate and reliable tests has made it easier for couples to get a clearer picture of their fertility status. For example, home fertility test kits that use saliva or urine samples are now widely available and can provide results within minutes.
  • With many people staying at home during and after the Covid-19 pandemic, there has been a rise in the use of at-home fertility tests. These tests allow people to monitor their fertility from the comfort of their own homes without the need for a doctor's visit.
Attributes Details
Estimated Market Size in 2024 US$ 548.4 million
Forecasted Market Size by 2034 US$ 1.2 billion
Projected Value CAGR (2024 to 2034) 7.9%

Don't pay for what you don't need

Customize your report by selecting specific countries or regions and save 30%!

Challenges for the Fertility Test Market

  • The lack of awareness among potential consumers about the importance of fertility testing is a significant issue. Many people are unaware of the various fertility testing options available to them and the benefits of undergoing such tests. This lack of awareness has resulted in a relatively low demand for fertility testing services, which in turn affects the market's growth.
  • The high cost of fertility testing services limits their adoption. Most fertility testing procedures are expensive and are often not covered by insurance. This cost can discourage potential consumers from seeking fertility testing, further hindering the market's growth.
  • The market is highly competitive, with a large number of players offering similar products and services. This competition makes it difficult for new entrants to establish themselves in the market and gain market share. Established players have an advantage in terms of brand recognition and customer loyalty, making it challenging for new entrants to compete.

Key Opportunities for the Fertility Test Market

The demand for home-based fertility testing kits is on the rise. These kits are cost-effective and offer convenience to users, making them an attractive option for those who prefer to assess their fertility levels in the privacy of their homes. As a result, many companies are focusing on developing innovative and accurate home-based testing kits to meet this demand.

The rise of digital health technology is also creating new opportunities for market players in the fertility testing market. Mobile apps, wearables, and other digital health tools are gaining popularity among consumers. Many companies are developing fertility testing products that can be integrated with these tools.

This integration allows for a more personalized approach to fertility testing, potentially leading to better outcomes for users. Companies that can develop innovative and accurate fertility testing products catering to these trends are likely to be well-positioned for success in this market.

Sabyasachi Ghosh
Sabyasachi Ghosh

Principal Consultant

Talk to Analyst

Find your sweet spots for generating winning opportunities in this market.

Comparative View of Adjacent Markets

Aside from the fertility test market, our analyst has compared reports on two other related markets: the fertility and pregnancy rapid test kit market and the infertility treatment market. These markets are interconnected and can mutually influence each other.

Fertility Test Market:

Attributes Fertility Test Market
Value-based CAGR (2024 to 2034) 7.9%
Market Trends Convenience and privacy driving the surge in at-home fertility test kits
Growth Opportunities Expansion of fertility clinics and specialized healthcare services

Fertility and Pregnancy Rapid Test Kit Market:

Attributes Fertility and Pregnancy Rapid Test Kit Market
Value-based CAGR (2024 to 2034) 4%
Market Trends Growing preference for over-the-counter (OTC) rapid test kits for fertility and pregnancy
Growth Opportunities Adoption of point-of-care testing (POCT) for quick diagnosis and treatment initiation

Infertility Treatment Market:

Attributes Infertility Treatment Market
Value-based CAGR (2024 to 2034) 8%
Market Trends Increasing acceptance and accessibility of in vitro fertilization (IVF) procedures
Growth Opportunities Focus on addressing male infertility through specialized treatment options

Category-wise Insights

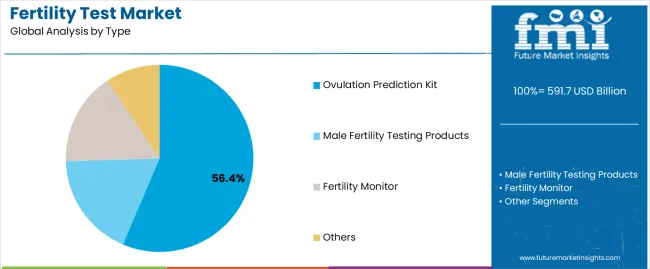
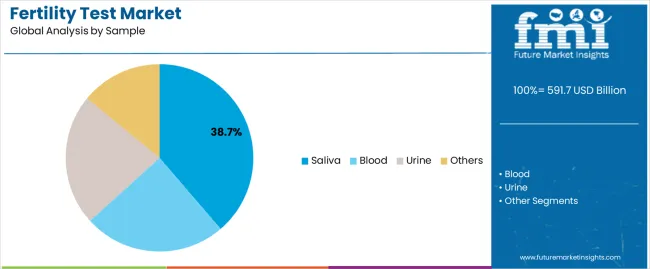
The ovulation prediction kit segment dominates the market by product and is projected to maintain its dominance through 2034, registering a 7.7% CAGR. The saliva segment leads the market in terms of the sample category. This segment is expected to record a CAGR of 7.4% during the forecast period.

Ovulation Prediction Kit Segment Holds Firm Grip on the Market

Attributes Details
Product Ovulation prediction kit
Forecasted CAGR From 2024 to 2034 7.7%

The market is significantly influenced by the dominance of the ovulation prediction kit segment, supported by the following points:

  • Ovulation prediction kits are designed to detect the surge of luteinizing hormone (LH), which occurs 24-36 hours before ovulation. This feature makes them highly accurate in predicting the most fertile days in a woman's menstrual cycle.
  • Compared to other fertility tests, such as basal body temperature monitoring or cervical mucus analysis, ovulation prediction kits are more convenient and less time-consuming.
  • Ovulation prediction kits also boast a higher success rate in helping couples conceive. Consequently, many women prefer ovulation prediction kits over other fertility tests.

Saliva Segment Commands Sample Category Success

Attributes Details
By Sample Saliva
Forecasted CAGR from 2024 to 2034 7.4%

The market is led by the saliva segment within the sample category, a fact reinforced by the following:

  • Saliva tests can be performed at home without the need for a medical professional, and they provide accurate results promptly.
  • Many people prefer saliva tests over other methods, such as blood tests, because they are less invasive and can be more comfortable to perform, making saliva tests popular in the fertility market.

Get the data you need at a Fraction of the cost

Personalize your report by choosing insights you need
and save 40%!

Country-wise insights

Countries Forecasted CAGR from 2024 to 2034
United States 7.6%
United Kingdom 9.1%
China 8.7%
Japan 9.3%
South Korea 9.8%

Delayed Childbearing Spurs Demand for Fertility Tests in the United States

The increasing awareness among people about their reproductive health in the United States is a primary factor contributing to its dominance in the fertility test market. Other supporting factors include:

  • The trend of delaying childbearing has become widespread in the United States, with many couples opting to have children later in life. Around 19% of married women aged 15 to 49 years who have not previously given birth in the United States experience difficulty getting pregnant after one year of trying. Consequently, the risk of infertility increases with age, prompting couples to turn to fertility tests to assess their chances of conceiving.
  • The prevalence of lifestyle-related diseases such as obesity, diabetes, and hypertension is on the rise in the country. These conditions can negatively impact fertility, leading couples to use fertility tests to assess their risk of infertility.
  • Advancements in technology have led to the development of more sophisticated and accurate fertility tests. These tests are more sensitive and can detect subtle changes in reproductive hormones, making it easier for couples to determine their fertility status.

Fertility Test Demand Grows in the United Kingdom as Lifestyle Factors Impact Reproductive Health

The fertility test market in the United Kingdom holds significant growth potential. Factors backing up this growth are:

  • The National Health Service (NHS) in the United Kingdom is renowned as one of the world's largest public health systems. As per NHS statistics, about 1 in 7 couples in the United Kingdom encounter challenges when trying to conceive.
  • As of the fiscal year 2022/23, over 100 fertility clinics were licensed by the Human Fertilisation and Embryology Authority (HFEA) to offer fertility treatment in the United Kingdom, contributing significantly to the growth of the fertility test market.
  • The rise in lifestyle-related factors that can affect fertility. Factors such as obesity, smoking, alcohol consumption, and stress can all have a negative impact on fertility, and people are becoming increasingly aware of this. As a result, they are turning to fertility tests to assess their reproductive health and take appropriate measures to improve their chances of conception.

China's Reproductive Health Center Witnesses High Demand for Fertility Testing

The demand for fertility testing is considerable in China. This growth in the fertility test market can be attributed to the following factors:

  • According to government data, China's fertility rate hit an estimated historic low of 1.09 in 2022, marking the lowest rate among countries with populations exceeding 100 million. This, in turn, increases the demand for fertility-related services.
  • China's one-child policy, which was in place for several decades, has led to a significant decrease in the country's birth rate. As a result, there is growing awareness of the importance of fertility testing and treatment.
  • The government has also played a crucial role in promoting fertility testing and treatment. The reproductive health center operated by the government serves hundreds of thousands of couples seeking these services.

Japan Faces Fertility Testing Surge amidst Stringent Reproductive Technology Regulations

The rise in demand for fertility tests in Japan can be attributed to the country's strict regulations on assisted reproductive technologies. In addition to this, there are several other reasons supporting the expansion of the fertility test market:

  • Japan's persistently low fertility rate, hitting a record low of 1.26 in 2022, is likely to drive an increased demand for fertility tests, reflecting the societal need for comprehensive reproductive health solutions.
  • Japan's stark demographic challenges, with a significant portion of women expected to remain childless, underscore the pressing need for fertility tests. This fuels a growing market driven by individuals seeking reproductive solutions.
  • There are now a variety of at-home fertility testing kits available on the market in Japan, as well as more comprehensive testing options at fertility clinics.

Government Initiatives and Lifestyle Factors Drive South Korea's Fertility Test Boom

The adoption rate of fertility tests in South Korea is significantly higher than in other Asian countries, and this trend is anticipated to continue in the upcoming years. This trend is supported by:

  • South Korea is struggling with the lowest global fertility rate, which dropped to 0.78 in 2022. Many couples are facing difficulties while trying to conceive, and fertility tests have become an essential tool for assessing their chances of having a child. This trend fuels a burgeoning market as individuals seek solutions for reproductive health challenges.
  • The South Korean government's financial incentives for childbirth in 2022, offering up to 5 million won for families with twins, may stimulate interest in fertility tests as individuals explore options to benefit from these initiatives.
  • The increasing prevalence of lifestyle factors that can affect fertility, such as stress, sedentary lifestyles, and poor diet. This has made people more conscious of their health and fertility, leading to a greater demand for fertility tests.

Competitive Landscape

The fertility test market is highly competitive, with several players offering a range of products and services. These companies provide various fertility tests, ranging from prediction kits to sperm count tests. Additionally, several new players in the market are leveraging technology such as artificial intelligence and machine learning to develop advanced fertility testing solutions.

Recent Developments
  • In July 2023, 2San, a reputable global leader in self-diagnostic testing, forged a partnership with Proov to roll out their exclusive, user-friendly at-home fertility tests in handpicked Hy-Vee outlets spanning eight states across the Midwest.
  • In August 2023, Trajan Scientific and Medical supplied CE-IVD registered Mitra® devices to Fertilly, a German start-up that launched Europe's inaugural At-Home Fertility Test Kits employing dried blood microsampling with VAMS® technology. Fertilly's kits are medically certified and made accessible to consumers across Europe.
  • In January 2022, Kindbody, a prominent provider of fertility and family-building care, unveiled Kind at Home, its consumer products division dedicated to assisting individuals throughout their complete reproductive journey. The initiative commenced with the introduction of user-friendly at-home fertility hormone tests catering to both women and men.

Key Fertility Test Market Players

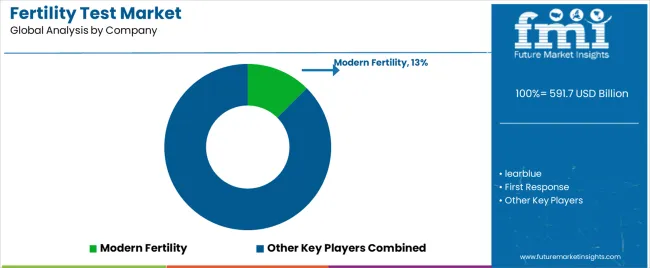
  • learblue
  • First Response
  • Mira
  • AVA
  • Modern Fertility
  • LetsGetChecked
  • Proov
  • Ovuline
  • YO Home Sperm Test
  • Fertility Focus
  • ExSeed Health
  • Sema4
  • Roche
  • Thermo Fisher Scientific
  • Quest Diagnostics

Key Fertility Test Market Segments

By Product:

  • Ovulation prediction kit
  • Male fertility testing products
  • Fertility monitor
  • Others

By Sample:

  • Saliva
  • Blood
  • Urine
  • Others

By Mode of Purchase:

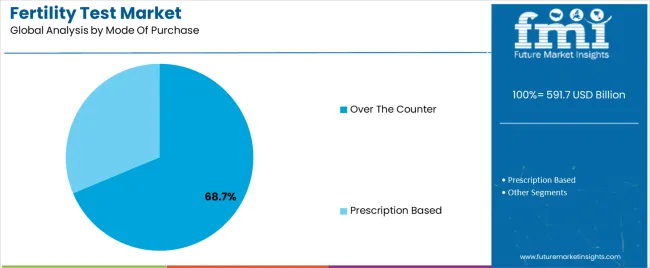
  • Over the counter
  • Prescription based

By Application:

  • Female
  • Male

By End User:

  • Hospitals
  • Homecare settings
  • Fertility clinics
  • Others

By Region:

  • North America
  • Latin America
  • East Asia
  • South Asia
  • Europe
  • Oceania
  • MEA

Frequently Asked Questions

What is China’s Fertility Test Market Outlook?

The market in China is expected to progress at a CAGR of 8.7% through the forecast period.

How Big is the Fertility Test Market as of 2024?

The market is currently valued at around US$ 548.4 million in 2024.

Which Product Segment Contributes More to the Fertility Test Market?

Within the product segment, the ovulation prediction kit segment contributes the most to the market.

What is the United States Fertility Test Market Outlook?

The United States dominates the market, exhibiting a 9.1% CAGR from 2024 to 2034.

What is the Projected Market Value for the Fertility Test by 2034?

The market is set to reach a valuation of around US$ 1.2 billion by 2034.

What is the Projected Growth Rate for the Fertility Test Market?

The market is forecasted to register a CAGR of 7.9% through 2034.

What Was the Historical CAGR of the Fertility Test Market?

Demand for fertility tests increased at a 9.5% CAGR from 2019 to 2023.

Table of Content

1. Executive Summary

    1.1. Global Market Outlook

    1.2. Demand-side Trends

    1.3. Supply-side Trends

    1.4. Technology Roadmap Analysis

    1.5. Analysis and Recommendations

2. Market Overview

    2.1. Market Coverage / Taxonomy

    2.2. Market Definition / Scope / Limitations

3. Market Background

    3.1. Market Dynamics

        3.1.1. Drivers

        3.1.2. Restraints

        3.1.3. Opportunity

        3.1.4. Trends

    3.2. Scenario Forecast

        3.2.1. Demand in Optimistic Scenario

        3.2.2. Demand in Likely Scenario

        3.2.3. Demand in Conservative Scenario

    3.3. Opportunity Map Analysis

    3.4. Investment Feasibility Matrix

    3.5. PESTLE and Porter’s Analysis

    3.6. Regulatory Landscape

        3.6.1. By Key Regions

        3.6.2. By Key Countries

    3.7. Regional Parent Market Outlook

4. Global Market Analysis 2019 to 2023 and Forecast, 2024 to 2034

    4.1. Historical Market Size Value (US$ Million) Analysis, 2019 to 2023

    4.2. Current and Future Market Size Value (US$ Million) Projections, 2024 to 2034

        4.2.1. Y-o-Y Growth Trend Analysis

        4.2.2. Absolute $ Opportunity Analysis

5. Global Market Analysis 2019 to 2023 and Forecast 2024 to 2034, By Product

    5.1. Introduction / Key Findings

    5.2. Historical Market Size Value (US$ Million) Analysis By Product, 2019 to 2023

    5.3. Current and Future Market Size Value (US$ Million) Analysis and Forecast By Product, 2024 to 2034

        5.3.1. Ovulation prediction kit

        5.3.2. Male fertility testing products

        5.3.3. Fertility monitor

        5.3.4. Others

    5.4. Y-o-Y Growth Trend Analysis By Product, 2019 to 2023

    5.5. Absolute $ Opportunity Analysis By Product, 2024 to 2034

6. Global Market Analysis 2019 to 2023 and Forecast 2024 to 2034, By Sample

    6.1. Introduction / Key Findings

    6.2. Historical Market Size Value (US$ Million) Analysis By Sample, 2019 to 2023

    6.3. Current and Future Market Size Value (US$ Million) Analysis and Forecast By Sample, 2024 to 2034

        6.3.1. Saliva

        6.3.2. Blood

        6.3.3. Urine

        6.3.4. Others

    6.4. Y-o-Y Growth Trend Analysis By Sample, 2019 to 2023

    6.5. Absolute $ Opportunity Analysis By Sample, 2024 to 2034

7. Global Market Analysis 2019 to 2023 and Forecast 2024 to 2034, By Mode of Purchase

    7.1. Introduction / Key Findings

    7.2. Historical Market Size Value (US$ Million) Analysis By Mode of Purchase, 2019 to 2023

    7.3. Current and Future Market Size Value (US$ Million) Analysis and Forecast By Mode of Purchase, 2024 to 2034

        7.3.1. Over the counter

        7.3.2. Prescription based

    7.4. Y-o-Y Growth Trend Analysis By Mode of Purchase, 2019 to 2023

    7.5. Absolute $ Opportunity Analysis By Mode of Purchase, 2024 to 2034

8. Global Market Analysis 2019 to 2023 and Forecast 2024 to 2034, By Application

    8.1. Introduction / Key Findings

    8.2. Historical Market Size Value (US$ Million) Analysis By Application, 2019 to 2023

    8.3. Current and Future Market Size Value (US$ Million) Analysis and Forecast By Application, 2024 to 2034

        8.3.1. Female

        8.3.2. Male

    8.4. Y-o-Y Growth Trend Analysis By Application, 2019 to 2023

    8.5. Absolute $ Opportunity Analysis By Application, 2024 to 2034

9. Global Market Analysis 2019 to 2023 and Forecast 2024 to 2034, By End User

    9.1. Introduction / Key Findings

    9.2. Historical Market Size Value (US$ Million) Analysis By End User, 2019 to 2023

    9.3. Current and Future Market Size Value (US$ Million) Analysis and Forecast By End User, 2024 to 2034

        9.3.1. Hospitals

        9.3.2. Homecare settings

        9.3.3. Fertility clinics

        9.3.4. Others'

    9.4. Y-o-Y Growth Trend Analysis By End User, 2019 to 2023

    9.5. Absolute $ Opportunity Analysis By End User, 2024 to 2034

10. Global Market Analysis 2019 to 2023 and Forecast 2024 to 2034, By Region

    10.1. Introduction

    10.2. Historical Market Size Value (US$ Million) Analysis By Region, 2019 to 2023

    10.3. Current Market Size Value (US$ Million) Analysis and Forecast By Region, 2024 to 2034

        10.3.1. North America

        10.3.2. Latin America

        10.3.3. Western Europe

        10.3.4. Eastern Europe

        10.3.5. South Asia and Pacific

        10.3.6. East Asia

        10.3.7. Middle East and Africa

    10.4. Market Attractiveness Analysis By Region

11. North America Market Analysis 2019 to 2023 and Forecast 2024 to 2034, By Country

    11.1. Historical Market Size Value (US$ Million) Trend Analysis By Market Taxonomy, 2019 to 2023

    11.2. Market Size Value (US$ Million) Forecast By Market Taxonomy, 2024 to 2034

        11.2.1. By Country

            11.2.1.1. USA

            11.2.1.2. Canada

        11.2.2. By Product

        11.2.3. By Sample

        11.2.4. By Mode of Purchase

        11.2.5. By Application

        11.2.6. By End User

    11.3. Market Attractiveness Analysis

        11.3.1. By Country

        11.3.2. By Product

        11.3.3. By Sample

        11.3.4. By Mode of Purchase

        11.3.5. By Application

        11.3.6. By End User

    11.4. Key Takeaways

12. Latin America Market Analysis 2019 to 2023 and Forecast 2024 to 2034, By Country

    12.1. Historical Market Size Value (US$ Million) Trend Analysis By Market Taxonomy, 2019 to 2023

    12.2. Market Size Value (US$ Million) Forecast By Market Taxonomy, 2024 to 2034

        12.2.1. By Country

            12.2.1.1. Brazil

            12.2.1.2. Mexico

            12.2.1.3. Rest of Latin America

        12.2.2. By Product

        12.2.3. By Sample

        12.2.4. By Mode of Purchase

        12.2.5. By Application

        12.2.6. By End User

    12.3. Market Attractiveness Analysis

        12.3.1. By Country

        12.3.2. By Product

        12.3.3. By Sample

        12.3.4. By Mode of Purchase

        12.3.5. By Application

        12.3.6. By End User

    12.4. Key Takeaways

13. Western Europe Market Analysis 2019 to 2023 and Forecast 2024 to 2034, By Country

    13.1. Historical Market Size Value (US$ Million) Trend Analysis By Market Taxonomy, 2019 to 2023

    13.2. Market Size Value (US$ Million) Forecast By Market Taxonomy, 2024 to 2034

        13.2.1. By Country

            13.2.1.1. Germany

            13.2.1.2. UK

            13.2.1.3. France

            13.2.1.4. Spain

            13.2.1.5. Italy

            13.2.1.6. Rest of Western Europe

        13.2.2. By Product

        13.2.3. By Sample

        13.2.4. By Mode of Purchase

        13.2.5. By Application

        13.2.6. By End User

    13.3. Market Attractiveness Analysis

        13.3.1. By Country

        13.3.2. By Product

        13.3.3. By Sample

        13.3.4. By Mode of Purchase

        13.3.5. By Application

        13.3.6. By End User

    13.4. Key Takeaways

14. Eastern Europe Market Analysis 2019 to 2023 and Forecast 2024 to 2034, By Country

    14.1. Historical Market Size Value (US$ Million) Trend Analysis By Market Taxonomy, 2019 to 2023

    14.2. Market Size Value (US$ Million) Forecast By Market Taxonomy, 2024 to 2034

        14.2.1. By Country

            14.2.1.1. Poland

            14.2.1.2. Russia

            14.2.1.3. Czech Republic

            14.2.1.4. Romania

            14.2.1.5. Rest of Eastern Europe

        14.2.2. By Product

        14.2.3. By Sample

        14.2.4. By Mode of Purchase

        14.2.5. By Application

        14.2.6. By End User

    14.3. Market Attractiveness Analysis

        14.3.1. By Country

        14.3.2. By Product

        14.3.3. By Sample

        14.3.4. By Mode of Purchase

        14.3.5. By Application

        14.3.6. By End User

    14.4. Key Takeaways

15. South Asia and Pacific Market Analysis 2019 to 2023 and Forecast 2024 to 2034, By Country

    15.1. Historical Market Size Value (US$ Million) Trend Analysis By Market Taxonomy, 2019 to 2023

    15.2. Market Size Value (US$ Million) Forecast By Market Taxonomy, 2024 to 2034

        15.2.1. By Country

            15.2.1.1. India

            15.2.1.2. Bangladesh

            15.2.1.3. Australia

            15.2.1.4. New Zealand

            15.2.1.5. Rest of South Asia and Pacific

        15.2.2. By Product

        15.2.3. By Sample

        15.2.4. By Mode of Purchase

        15.2.5. By Application

        15.2.6. By End User

    15.3. Market Attractiveness Analysis

        15.3.1. By Country

        15.3.2. By Product

        15.3.3. By Sample

        15.3.4. By Mode of Purchase

        15.3.5. By Application

        15.3.6. By End User

    15.4. Key Takeaways

16. East Asia Market Analysis 2019 to 2023 and Forecast 2024 to 2034, By Country

    16.1. Historical Market Size Value (US$ Million) Trend Analysis By Market Taxonomy, 2019 to 2023

    16.2. Market Size Value (US$ Million) Forecast By Market Taxonomy, 2024 to 2034

        16.2.1. By Country

            16.2.1.1. China

            16.2.1.2. Japan

            16.2.1.3. South Korea

        16.2.2. By Product

        16.2.3. By Sample

        16.2.4. By Mode of Purchase

        16.2.5. By Application

        16.2.6. By End User

    16.3. Market Attractiveness Analysis

        16.3.1. By Country

        16.3.2. By Product

        16.3.3. By Sample

        16.3.4. By Mode of Purchase

        16.3.5. By Application

        16.3.6. By End User

    16.4. Key Takeaways

17. Middle East and Africa Market Analysis 2019 to 2023 and Forecast 2024 to 2034, By Country

    17.1. Historical Market Size Value (US$ Million) Trend Analysis By Market Taxonomy, 2019 to 2023

    17.2. Market Size Value (US$ Million) Forecast By Market Taxonomy, 2024 to 2034

        17.2.1. By Country

            17.2.1.1. GCC Countries

            17.2.1.2. South Africa

            17.2.1.3. Israel

            17.2.1.4. Rest of MEA

        17.2.2. By Product

        17.2.3. By Sample

        17.2.4. By Mode of Purchase

        17.2.5. By Application

        17.2.6. By End User

    17.3. Market Attractiveness Analysis

        17.3.1. By Country

        17.3.2. By Product

        17.3.3. By Sample

        17.3.4. By Mode of Purchase

        17.3.5. By Application

        17.3.6. By End User

    17.4. Key Takeaways

18. Key Countries Market Analysis

    18.1. USA

        18.1.1. Pricing Analysis

        18.1.2. Market Share Analysis, 2023

            18.1.2.1. By Product

            18.1.2.2. By Sample

            18.1.2.3. By Mode of Purchase

            18.1.2.4. By Application

            18.1.2.5. By End User

    18.2. Canada

        18.2.1. Pricing Analysis

        18.2.2. Market Share Analysis, 2023

            18.2.2.1. By Product

            18.2.2.2. By Sample

            18.2.2.3. By Mode of Purchase

            18.2.2.4. By Application

            18.2.2.5. By End User

    18.3. Brazil

        18.3.1. Pricing Analysis

        18.3.2. Market Share Analysis, 2023

            18.3.2.1. By Product

            18.3.2.2. By Sample

            18.3.2.3. By Mode of Purchase

            18.3.2.4. By Application

            18.3.2.5. By End User

    18.4. Mexico

        18.4.1. Pricing Analysis

        18.4.2. Market Share Analysis, 2023

            18.4.2.1. By Product

            18.4.2.2. By Sample

            18.4.2.3. By Mode of Purchase

            18.4.2.4. By Application

            18.4.2.5. By End User

    18.5. Germany

        18.5.1. Pricing Analysis

        18.5.2. Market Share Analysis, 2023

            18.5.2.1. By Product

            18.5.2.2. By Sample

            18.5.2.3. By Mode of Purchase

            18.5.2.4. By Application

            18.5.2.5. By End User

    18.6. UK

        18.6.1. Pricing Analysis

        18.6.2. Market Share Analysis, 2023

            18.6.2.1. By Product

            18.6.2.2. By Sample

            18.6.2.3. By Mode of Purchase

            18.6.2.4. By Application

            18.6.2.5. By End User

    18.7. France

        18.7.1. Pricing Analysis

        18.7.2. Market Share Analysis, 2023

            18.7.2.1. By Product

            18.7.2.2. By Sample

            18.7.2.3. By Mode of Purchase

            18.7.2.4. By Application

            18.7.2.5. By End User

    18.8. Spain

        18.8.1. Pricing Analysis

        18.8.2. Market Share Analysis, 2023

            18.8.2.1. By Product

            18.8.2.2. By Sample

            18.8.2.3. By Mode of Purchase

            18.8.2.4. By Application

            18.8.2.5. By End User

    18.9. Italy

        18.9.1. Pricing Analysis

        18.9.2. Market Share Analysis, 2023

            18.9.2.1. By Product

            18.9.2.2. By Sample

            18.9.2.3. By Mode of Purchase

            18.9.2.4. By Application

            18.9.2.5. By End User

    18.10. Poland

        18.10.1. Pricing Analysis

        18.10.2. Market Share Analysis, 2023

            18.10.2.1. By Product

            18.10.2.2. By Sample

            18.10.2.3. By Mode of Purchase

            18.10.2.4. By Application

            18.10.2.5. By End User

    18.11. Russia

        18.11.1. Pricing Analysis

        18.11.2. Market Share Analysis, 2023

            18.11.2.1. By Product

            18.11.2.2. By Sample

            18.11.2.3. By Mode of Purchase

            18.11.2.4. By Application

            18.11.2.5. By End User

    18.12. Czech Republic

        18.12.1. Pricing Analysis

        18.12.2. Market Share Analysis, 2023

            18.12.2.1. By Product

            18.12.2.2. By Sample

            18.12.2.3. By Mode of Purchase

            18.12.2.4. By Application

            18.12.2.5. By End User

    18.13. Romania

        18.13.1. Pricing Analysis

        18.13.2. Market Share Analysis, 2023

            18.13.2.1. By Product

            18.13.2.2. By Sample

            18.13.2.3. By Mode of Purchase

            18.13.2.4. By Application

            18.13.2.5. By End User

    18.14. India

        18.14.1. Pricing Analysis

        18.14.2. Market Share Analysis, 2023

            18.14.2.1. By Product

            18.14.2.2. By Sample

            18.14.2.3. By Mode of Purchase

            18.14.2.4. By Application

            18.14.2.5. By End User

    18.15. Bangladesh

        18.15.1. Pricing Analysis

        18.15.2. Market Share Analysis, 2023

            18.15.2.1. By Product

            18.15.2.2. By Sample

            18.15.2.3. By Mode of Purchase

            18.15.2.4. By Application

            18.15.2.5. By End User

    18.16. Australia

        18.16.1. Pricing Analysis

        18.16.2. Market Share Analysis, 2023

            18.16.2.1. By Product

            18.16.2.2. By Sample

            18.16.2.3. By Mode of Purchase

            18.16.2.4. By Application

            18.16.2.5. By End User

    18.17. New Zealand

        18.17.1. Pricing Analysis

        18.17.2. Market Share Analysis, 2023

            18.17.2.1. By Product

            18.17.2.2. By Sample

            18.17.2.3. By Mode of Purchase

            18.17.2.4. By Application

            18.17.2.5. By End User

    18.18. China

        18.18.1. Pricing Analysis

        18.18.2. Market Share Analysis, 2023

            18.18.2.1. By Product

            18.18.2.2. By Sample

            18.18.2.3. By Mode of Purchase

            18.18.2.4. By Application

            18.18.2.5. By End User

    18.19. Japan

        18.19.1. Pricing Analysis

        18.19.2. Market Share Analysis, 2023

            18.19.2.1. By Product

            18.19.2.2. By Sample

            18.19.2.3. By Mode of Purchase

            18.19.2.4. By Application

            18.19.2.5. By End User

    18.20. South Korea

        18.20.1. Pricing Analysis

        18.20.2. Market Share Analysis, 2023

            18.20.2.1. By Product

            18.20.2.2. By Sample

            18.20.2.3. By Mode of Purchase

            18.20.2.4. By Application

            18.20.2.5. By End User

    18.21. GCC Countries

        18.21.1. Pricing Analysis

        18.21.2. Market Share Analysis, 2023

            18.21.2.1. By Product

            18.21.2.2. By Sample

            18.21.2.3. By Mode of Purchase

            18.21.2.4. By Application

            18.21.2.5. By End User

    18.22. South Africa

        18.22.1. Pricing Analysis

        18.22.2. Market Share Analysis, 2023

            18.22.2.1. By Product

            18.22.2.2. By Sample

            18.22.2.3. By Mode of Purchase

            18.22.2.4. By Application

            18.22.2.5. By End User

    18.23. Israel

        18.23.1. Pricing Analysis

        18.23.2. Market Share Analysis, 2023

            18.23.2.1. By Product

            18.23.2.2. By Sample

            18.23.2.3. By Mode of Purchase

            18.23.2.4. By Application

            18.23.2.5. By End User

19. Market Structure Analysis

    19.1. Competition Dashboard

    19.2. Competition Benchmarking

    19.3. Market Share Analysis of Top Players

        19.3.1. By Regional

        19.3.2. By Product

        19.3.3. By Sample

        19.3.4. By Mode of Purchase

        19.3.5. By Application

        19.3.6. By End User

20. Competition Analysis

    20.1. Competition Deep Dive

        20.1.1. AdvaCare Pharma - (USA)

            20.1.1.1. Overview

            20.1.1.2. Product Portfolio

            20.1.1.3. Profitability by Market Segments

            20.1.1.4. Sales Footprint

            20.1.1.5. Strategy Overview

                20.1.1.5.1. Marketing Strategy

        20.1.2. Prestige Consumer Healthcare, Inc. (USA)

            20.1.2.1. Overview

            20.1.2.2. Product Portfolio

            20.1.2.3. Profitability by Market Segments

            20.1.2.4. Sales Footprint

            20.1.2.5. Strategy Overview

                20.1.2.5.1. Marketing Strategy

        20.1.3. Babystart - (USA)

            20.1.3.1. Overview

            20.1.3.2. Product Portfolio

            20.1.3.3. Profitability by Market Segments

            20.1.3.4. Sales Footprint

            20.1.3.5. Strategy Overview

                20.1.3.5.1. Marketing Strategy

        20.1.4. Fertility Focus Limited (UK)

            20.1.4.1. Overview

            20.1.4.2. Product Portfolio

            20.1.4.3. Profitability by Market Segments

            20.1.4.4. Sales Footprint

            20.1.4.5. Strategy Overview

                20.1.4.5.1. Marketing Strategy

        20.1.5. bioZhena Corporation - (USA)

            20.1.5.1. Overview

            20.1.5.2. Product Portfolio

            20.1.5.3. Profitability by Market Segments

            20.1.5.4. Sales Footprint

            20.1.5.5. Strategy Overview

                20.1.5.5.1. Marketing Strategy

        20.1.6. Prestige Consumer Healthcare, Inc. (USA)

            20.1.6.1. Overview

            20.1.6.2. Product Portfolio

            20.1.6.3. Profitability by Market Segments

            20.1.6.4. Sales Footprint

            20.1.6.5. Strategy Overview

                20.1.6.5.1. Marketing Strategy

        20.1.7. Church & Dwight Co., Inc. (USA)

            20.1.7.1. Overview

            20.1.7.2. Product Portfolio

            20.1.7.3. Profitability by Market Segments

            20.1.7.4. Sales Footprint

            20.1.7.5. Strategy Overview

                20.1.7.5.1. Marketing Strategy

        20.1.8. UEBE Medical GmbH (Germany)

            20.1.8.1. Overview

            20.1.8.2. Product Portfolio

            20.1.8.3. Profitability by Market Segments

            20.1.8.4. Sales Footprint

            20.1.8.5. Strategy Overview

                20.1.8.5.1. Marketing Strategy

        20.1.9. Geratherm Medical AG (Germany)

            20.1.9.1. Overview

            20.1.9.2. Product Portfolio

            20.1.9.3. Profitability by Market Segments

            20.1.9.4. Sales Footprint

            20.1.9.5. Strategy Overview

                20.1.9.5.1. Marketing Strategy

        20.1.10. Valley Electronics AG (Switzerland)

            20.1.10.1. Overview

            20.1.10.2. Product Portfolio

            20.1.10.3. Profitability by Market Segments

            20.1.10.4. Sales Footprint

            20.1.10.5. Strategy Overview

                20.1.10.5.1. Marketing Strategy

        20.1.11. Geratherm Medical AG (Germany)

            20.1.11.1. Overview

            20.1.11.2. Product Portfolio

            20.1.11.3. Profitability by Market Segments

            20.1.11.4. Sales Footprint

            20.1.11.5. Strategy Overview

                20.1.11.5.1. Marketing Strategy

21. Assumptions & Acronyms Used

22. Research Methodology

List of Tables

Table 1: Global Market Value (US$ Million) Forecast by Region, 2019 to 2034

Table 2: Global Market Value (US$ Million) Forecast by Product, 2019 to 2034

Table 3: Global Market Value (US$ Million) Forecast by Sample, 2019 to 2034

Table 4: Global Market Value (US$ Million) Forecast by Mode of Purchase, 2019 to 2034

Table 5: Global Market Value (US$ Million) Forecast by Application, 2019 to 2034

Table 6: Global Market Value (US$ Million) Forecast by End User, 2019 to 2034

Table 7: North America Market Value (US$ Million) Forecast by Country, 2019 to 2034

Table 8: North America Market Value (US$ Million) Forecast by Product, 2019 to 2034

Table 9: North America Market Value (US$ Million) Forecast by Sample, 2019 to 2034

Table 10: North America Market Value (US$ Million) Forecast by Mode of Purchase, 2019 to 2034

Table 11: North America Market Value (US$ Million) Forecast by Application, 2019 to 2034

Table 12: North America Market Value (US$ Million) Forecast by End User, 2019 to 2034

Table 13: Latin America Market Value (US$ Million) Forecast by Country, 2019 to 2034

Table 14: Latin America Market Value (US$ Million) Forecast by Product, 2019 to 2034

Table 15: Latin America Market Value (US$ Million) Forecast by Sample, 2019 to 2034

Table 16: Latin America Market Value (US$ Million) Forecast by Mode of Purchase, 2019 to 2034

Table 17: Latin America Market Value (US$ Million) Forecast by Application, 2019 to 2034

Table 18: Latin America Market Value (US$ Million) Forecast by End User, 2019 to 2034

Table 19: Western Europe Market Value (US$ Million) Forecast by Country, 2019 to 2034

Table 20: Western Europe Market Value (US$ Million) Forecast by Product, 2019 to 2034

Table 21: Western Europe Market Value (US$ Million) Forecast by Sample, 2019 to 2034

Table 22: Western Europe Market Value (US$ Million) Forecast by Mode of Purchase, 2019 to 2034

Table 23: Western Europe Market Value (US$ Million) Forecast by Application, 2019 to 2034

Table 24: Western Europe Market Value (US$ Million) Forecast by End User, 2019 to 2034

Table 25: Eastern Europe Market Value (US$ Million) Forecast by Country, 2019 to 2034

Table 26: Eastern Europe Market Value (US$ Million) Forecast by Product, 2019 to 2034

Table 27: Eastern Europe Market Value (US$ Million) Forecast by Sample, 2019 to 2034

Table 28: Eastern Europe Market Value (US$ Million) Forecast by Mode of Purchase, 2019 to 2034

Table 29: Eastern Europe Market Value (US$ Million) Forecast by Application, 2019 to 2034

Table 30: Eastern Europe Market Value (US$ Million) Forecast by End User, 2019 to 2034

Table 31: South Asia and Pacific Market Value (US$ Million) Forecast by Country, 2019 to 2034

Table 32: South Asia and Pacific Market Value (US$ Million) Forecast by Product, 2019 to 2034

Table 33: South Asia and Pacific Market Value (US$ Million) Forecast by Sample, 2019 to 2034

Table 34: South Asia and Pacific Market Value (US$ Million) Forecast by Mode of Purchase, 2019 to 2034

Table 35: South Asia and Pacific Market Value (US$ Million) Forecast by Application, 2019 to 2034

Table 36: South Asia and Pacific Market Value (US$ Million) Forecast by End User, 2019 to 2034

Table 37: East Asia Market Value (US$ Million) Forecast by Country, 2019 to 2034

Table 38: East Asia Market Value (US$ Million) Forecast by Product, 2019 to 2034

Table 39: East Asia Market Value (US$ Million) Forecast by Sample, 2019 to 2034

Table 40: East Asia Market Value (US$ Million) Forecast by Mode of Purchase, 2019 to 2034

Table 41: East Asia Market Value (US$ Million) Forecast by Application, 2019 to 2034

Table 42: East Asia Market Value (US$ Million) Forecast by End User, 2019 to 2034

Table 43: Middle East and Africa Market Value (US$ Million) Forecast by Country, 2019 to 2034

Table 44: Middle East and Africa Market Value (US$ Million) Forecast by Product, 2019 to 2034

Table 45: Middle East and Africa Market Value (US$ Million) Forecast by Sample, 2019 to 2034

Table 46: Middle East and Africa Market Value (US$ Million) Forecast by Mode of Purchase, 2019 to 2034

Table 47: Middle East and Africa Market Value (US$ Million) Forecast by Application, 2019 to 2034

Table 48: Middle East and Africa Market Value (US$ Million) Forecast by End User, 2019 to 2034

List of Charts

Figure 1: Global Market Value (US$ Million) by Product, 2024 to 2034

Figure 2: Global Market Value (US$ Million) by Sample, 2024 to 2034

Figure 3: Global Market Value (US$ Million) by Mode of Purchase, 2024 to 2034

Figure 4: Global Market Value (US$ Million) by Application, 2024 to 2034

Figure 5: Global Market Value (US$ Million) by End User, 2024 to 2034

Figure 6: Global Market Value (US$ Million) by Region, 2024 to 2034

Figure 7: Global Market Value (US$ Million) Analysis by Region, 2019 to 2034

Figure 8: Global Market Value Share (%) and BPS Analysis by Region, 2024 to 2034

Figure 9: Global Market Y-o-Y Growth (%) Projections by Region, 2024 to 2034

Figure 10: Global Market Value (US$ Million) Analysis by Product, 2019 to 2034

Figure 11: Global Market Value Share (%) and BPS Analysis by Product, 2024 to 2034

Figure 12: Global Market Y-o-Y Growth (%) Projections by Product, 2024 to 2034

Figure 13: Global Market Value (US$ Million) Analysis by Sample, 2019 to 2034

Figure 14: Global Market Value Share (%) and BPS Analysis by Sample, 2024 to 2034

Figure 15: Global Market Y-o-Y Growth (%) Projections by Sample, 2024 to 2034

Figure 16: Global Market Value (US$ Million) Analysis by Mode of Purchase, 2019 to 2034

Figure 17: Global Market Value Share (%) and BPS Analysis by Mode of Purchase, 2024 to 2034

Figure 18: Global Market Y-o-Y Growth (%) Projections by Mode of Purchase, 2024 to 2034

Figure 19: Global Market Value (US$ Million) Analysis by Application, 2019 to 2034

Figure 20: Global Market Value Share (%) and BPS Analysis by Application, 2024 to 2034

Figure 21: Global Market Y-o-Y Growth (%) Projections by Application, 2024 to 2034

Figure 22: Global Market Value (US$ Million) Analysis by End User, 2019 to 2034

Figure 23: Global Market Value Share (%) and BPS Analysis by End User, 2024 to 2034

Figure 24: Global Market Y-o-Y Growth (%) Projections by End User, 2024 to 2034

Figure 25: Global Market Attractiveness by Product, 2024 to 2034

Figure 26: Global Market Attractiveness by Sample, 2024 to 2034

Figure 27: Global Market Attractiveness by Mode of Purchase, 2024 to 2034

Figure 28: Global Market Attractiveness by Application, 2024 to 2034

Figure 29: Global Market Attractiveness by End User, 2024 to 2034

Figure 30: Global Market Attractiveness by Region, 2024 to 2034

Figure 31: North America Market Value (US$ Million) by Product, 2024 to 2034

Figure 32: North America Market Value (US$ Million) by Sample, 2024 to 2034

Figure 33: North America Market Value (US$ Million) by Mode of Purchase, 2024 to 2034

Figure 34: North America Market Value (US$ Million) by Application, 2024 to 2034

Figure 35: North America Market Value (US$ Million) by End User, 2024 to 2034

Figure 36: North America Market Value (US$ Million) by Country, 2024 to 2034

Figure 37: North America Market Value (US$ Million) Analysis by Country, 2019 to 2034

Figure 38: North America Market Value Share (%) and BPS Analysis by Country, 2024 to 2034

Figure 39: North America Market Y-o-Y Growth (%) Projections by Country, 2024 to 2034

Figure 40: North America Market Value (US$ Million) Analysis by Product, 2019 to 2034

Figure 41: North America Market Value Share (%) and BPS Analysis by Product, 2024 to 2034

Figure 42: North America Market Y-o-Y Growth (%) Projections by Product, 2024 to 2034

Figure 43: North America Market Value (US$ Million) Analysis by Sample, 2019 to 2034

Figure 44: North America Market Value Share (%) and BPS Analysis by Sample, 2024 to 2034

Figure 45: North America Market Y-o-Y Growth (%) Projections by Sample, 2024 to 2034

Figure 46: North America Market Value (US$ Million) Analysis by Mode of Purchase, 2019 to 2034

Figure 47: North America Market Value Share (%) and BPS Analysis by Mode of Purchase, 2024 to 2034

Figure 48: North America Market Y-o-Y Growth (%) Projections by Mode of Purchase, 2024 to 2034

Figure 49: North America Market Value (US$ Million) Analysis by Application, 2019 to 2034

Figure 50: North America Market Value Share (%) and BPS Analysis by Application, 2024 to 2034

Figure 51: North America Market Y-o-Y Growth (%) Projections by Application, 2024 to 2034

Figure 52: North America Market Value (US$ Million) Analysis by End User, 2019 to 2034

Figure 53: North America Market Value Share (%) and BPS Analysis by End User, 2024 to 2034

Figure 54: North America Market Y-o-Y Growth (%) Projections by End User, 2024 to 2034

Figure 55: North America Market Attractiveness by Product, 2024 to 2034

Figure 56: North America Market Attractiveness by Sample, 2024 to 2034

Figure 57: North America Market Attractiveness by Mode of Purchase, 2024 to 2034

Figure 58: North America Market Attractiveness by Application, 2024 to 2034

Figure 59: North America Market Attractiveness by End User, 2024 to 2034

Figure 60: North America Market Attractiveness by Country, 2024 to 2034

Figure 61: Latin America Market Value (US$ Million) by Product, 2024 to 2034

Figure 62: Latin America Market Value (US$ Million) by Sample, 2024 to 2034

Figure 63: Latin America Market Value (US$ Million) by Mode of Purchase, 2024 to 2034

Figure 64: Latin America Market Value (US$ Million) by Application, 2024 to 2034

Figure 65: Latin America Market Value (US$ Million) by End User, 2024 to 2034

Figure 66: Latin America Market Value (US$ Million) by Country, 2024 to 2034

Figure 67: Latin America Market Value (US$ Million) Analysis by Country, 2019 to 2034

Figure 68: Latin America Market Value Share (%) and BPS Analysis by Country, 2024 to 2034

Figure 69: Latin America Market Y-o-Y Growth (%) Projections by Country, 2024 to 2034

Figure 70: Latin America Market Value (US$ Million) Analysis by Product, 2019 to 2034

Figure 71: Latin America Market Value Share (%) and BPS Analysis by Product, 2024 to 2034

Figure 72: Latin America Market Y-o-Y Growth (%) Projections by Product, 2024 to 2034

Figure 73: Latin America Market Value (US$ Million) Analysis by Sample, 2019 to 2034

Figure 74: Latin America Market Value Share (%) and BPS Analysis by Sample, 2024 to 2034

Figure 75: Latin America Market Y-o-Y Growth (%) Projections by Sample, 2024 to 2034

Figure 76: Latin America Market Value (US$ Million) Analysis by Mode of Purchase, 2019 to 2034

Figure 77: Latin America Market Value Share (%) and BPS Analysis by Mode of Purchase, 2024 to 2034

Figure 78: Latin America Market Y-o-Y Growth (%) Projections by Mode of Purchase, 2024 to 2034

Figure 79: Latin America Market Value (US$ Million) Analysis by Application, 2019 to 2034

Figure 80: Latin America Market Value Share (%) and BPS Analysis by Application, 2024 to 2034

Figure 81: Latin America Market Y-o-Y Growth (%) Projections by Application, 2024 to 2034

Figure 82: Latin America Market Value (US$ Million) Analysis by End User, 2019 to 2034

Figure 83: Latin America Market Value Share (%) and BPS Analysis by End User, 2024 to 2034

Figure 84: Latin America Market Y-o-Y Growth (%) Projections by End User, 2024 to 2034

Figure 85: Latin America Market Attractiveness by Product, 2024 to 2034

Figure 86: Latin America Market Attractiveness by Sample, 2024 to 2034

Figure 87: Latin America Market Attractiveness by Mode of Purchase, 2024 to 2034

Figure 88: Latin America Market Attractiveness by Application, 2024 to 2034

Figure 89: Latin America Market Attractiveness by End User, 2024 to 2034

Figure 90: Latin America Market Attractiveness by Country, 2024 to 2034

Figure 91: Western Europe Market Value (US$ Million) by Product, 2024 to 2034

Figure 92: Western Europe Market Value (US$ Million) by Sample, 2024 to 2034

Figure 93: Western Europe Market Value (US$ Million) by Mode of Purchase, 2024 to 2034

Figure 94: Western Europe Market Value (US$ Million) by Application, 2024 to 2034

Figure 95: Western Europe Market Value (US$ Million) by End User, 2024 to 2034

Figure 96: Western Europe Market Value (US$ Million) by Country, 2024 to 2034

Figure 97: Western Europe Market Value (US$ Million) Analysis by Country, 2019 to 2034

Figure 98: Western Europe Market Value Share (%) and BPS Analysis by Country, 2024 to 2034

Figure 99: Western Europe Market Y-o-Y Growth (%) Projections by Country, 2024 to 2034

Figure 100: Western Europe Market Value (US$ Million) Analysis by Product, 2019 to 2034

Figure 101: Western Europe Market Value Share (%) and BPS Analysis by Product, 2024 to 2034

Figure 102: Western Europe Market Y-o-Y Growth (%) Projections by Product, 2024 to 2034

Figure 103: Western Europe Market Value (US$ Million) Analysis by Sample, 2019 to 2034

Figure 104: Western Europe Market Value Share (%) and BPS Analysis by Sample, 2024 to 2034

Figure 105: Western Europe Market Y-o-Y Growth (%) Projections by Sample, 2024 to 2034

Figure 106: Western Europe Market Value (US$ Million) Analysis by Mode of Purchase, 2019 to 2034

Figure 107: Western Europe Market Value Share (%) and BPS Analysis by Mode of Purchase, 2024 to 2034

Figure 108: Western Europe Market Y-o-Y Growth (%) Projections by Mode of Purchase, 2024 to 2034

Figure 109: Western Europe Market Value (US$ Million) Analysis by Application, 2019 to 2034

Figure 110: Western Europe Market Value Share (%) and BPS Analysis by Application, 2024 to 2034

Figure 111: Western Europe Market Y-o-Y Growth (%) Projections by Application, 2024 to 2034

Figure 112: Western Europe Market Value (US$ Million) Analysis by End User, 2019 to 2034

Figure 113: Western Europe Market Value Share (%) and BPS Analysis by End User, 2024 to 2034

Figure 114: Western Europe Market Y-o-Y Growth (%) Projections by End User, 2024 to 2034

Figure 115: Western Europe Market Attractiveness by Product, 2024 to 2034

Figure 116: Western Europe Market Attractiveness by Sample, 2024 to 2034

Figure 117: Western Europe Market Attractiveness by Mode of Purchase, 2024 to 2034

Figure 118: Western Europe Market Attractiveness by Application, 2024 to 2034

Figure 119: Western Europe Market Attractiveness by End User, 2024 to 2034

Figure 120: Western Europe Market Attractiveness by Country, 2024 to 2034

Figure 121: Eastern Europe Market Value (US$ Million) by Product, 2024 to 2034

Figure 122: Eastern Europe Market Value (US$ Million) by Sample, 2024 to 2034

Figure 123: Eastern Europe Market Value (US$ Million) by Mode of Purchase, 2024 to 2034

Figure 124: Eastern Europe Market Value (US$ Million) by Application, 2024 to 2034

Figure 125: Eastern Europe Market Value (US$ Million) by End User, 2024 to 2034

Figure 126: Eastern Europe Market Value (US$ Million) by Country, 2024 to 2034

Figure 127: Eastern Europe Market Value (US$ Million) Analysis by Country, 2019 to 2034

Figure 128: Eastern Europe Market Value Share (%) and BPS Analysis by Country, 2024 to 2034

Figure 129: Eastern Europe Market Y-o-Y Growth (%) Projections by Country, 2024 to 2034

Figure 130: Eastern Europe Market Value (US$ Million) Analysis by Product, 2019 to 2034

Figure 131: Eastern Europe Market Value Share (%) and BPS Analysis by Product, 2024 to 2034

Figure 132: Eastern Europe Market Y-o-Y Growth (%) Projections by Product, 2024 to 2034

Figure 133: Eastern Europe Market Value (US$ Million) Analysis by Sample, 2019 to 2034

Figure 134: Eastern Europe Market Value Share (%) and BPS Analysis by Sample, 2024 to 2034

Figure 135: Eastern Europe Market Y-o-Y Growth (%) Projections by Sample, 2024 to 2034

Figure 136: Eastern Europe Market Value (US$ Million) Analysis by Mode of Purchase, 2019 to 2034

Figure 137: Eastern Europe Market Value Share (%) and BPS Analysis by Mode of Purchase, 2024 to 2034

Figure 138: Eastern Europe Market Y-o-Y Growth (%) Projections by Mode of Purchase, 2024 to 2034

Figure 139: Eastern Europe Market Value (US$ Million) Analysis by Application, 2019 to 2034

Figure 140: Eastern Europe Market Value Share (%) and BPS Analysis by Application, 2024 to 2034

Figure 141: Eastern Europe Market Y-o-Y Growth (%) Projections by Application, 2024 to 2034

Figure 142: Eastern Europe Market Value (US$ Million) Analysis by End User, 2019 to 2034

Figure 143: Eastern Europe Market Value Share (%) and BPS Analysis by End User, 2024 to 2034

Figure 144: Eastern Europe Market Y-o-Y Growth (%) Projections by End User, 2024 to 2034

Figure 145: Eastern Europe Market Attractiveness by Product, 2024 to 2034

Figure 146: Eastern Europe Market Attractiveness by Sample, 2024 to 2034

Figure 147: Eastern Europe Market Attractiveness by Mode of Purchase, 2024 to 2034

Figure 148: Eastern Europe Market Attractiveness by Application, 2024 to 2034

Figure 149: Eastern Europe Market Attractiveness by End User, 2024 to 2034

Figure 150: Eastern Europe Market Attractiveness by Country, 2024 to 2034

Figure 151: South Asia and Pacific Market Value (US$ Million) by Product, 2024 to 2034

Figure 152: South Asia and Pacific Market Value (US$ Million) by Sample, 2024 to 2034

Figure 153: South Asia and Pacific Market Value (US$ Million) by Mode of Purchase, 2024 to 2034

Figure 154: South Asia and Pacific Market Value (US$ Million) by Application, 2024 to 2034

Figure 155: South Asia and Pacific Market Value (US$ Million) by End User, 2024 to 2034

Figure 156: South Asia and Pacific Market Value (US$ Million) by Country, 2024 to 2034

Figure 157: South Asia and Pacific Market Value (US$ Million) Analysis by Country, 2019 to 2034

Figure 158: South Asia and Pacific Market Value Share (%) and BPS Analysis by Country, 2024 to 2034

Figure 159: South Asia and Pacific Market Y-o-Y Growth (%) Projections by Country, 2024 to 2034

Figure 160: South Asia and Pacific Market Value (US$ Million) Analysis by Product, 2019 to 2034

Figure 161: South Asia and Pacific Market Value Share (%) and BPS Analysis by Product, 2024 to 2034

Figure 162: South Asia and Pacific Market Y-o-Y Growth (%) Projections by Product, 2024 to 2034

Figure 163: South Asia and Pacific Market Value (US$ Million) Analysis by Sample, 2019 to 2034

Figure 164: South Asia and Pacific Market Value Share (%) and BPS Analysis by Sample, 2024 to 2034

Figure 165: South Asia and Pacific Market Y-o-Y Growth (%) Projections by Sample, 2024 to 2034

Figure 166: South Asia and Pacific Market Value (US$ Million) Analysis by Mode of Purchase, 2019 to 2034

Figure 167: South Asia and Pacific Market Value Share (%) and BPS Analysis by Mode of Purchase, 2024 to 2034

Figure 168: South Asia and Pacific Market Y-o-Y Growth (%) Projections by Mode of Purchase, 2024 to 2034

Figure 169: South Asia and Pacific Market Value (US$ Million) Analysis by Application, 2019 to 2034

Figure 170: South Asia and Pacific Market Value Share (%) and BPS Analysis by Application, 2024 to 2034

Figure 171: South Asia and Pacific Market Y-o-Y Growth (%) Projections by Application, 2024 to 2034

Figure 172: South Asia and Pacific Market Value (US$ Million) Analysis by End User, 2019 to 2034

Figure 173: South Asia and Pacific Market Value Share (%) and BPS Analysis by End User, 2024 to 2034

Figure 174: South Asia and Pacific Market Y-o-Y Growth (%) Projections by End User, 2024 to 2034

Figure 175: South Asia and Pacific Market Attractiveness by Product, 2024 to 2034

Figure 176: South Asia and Pacific Market Attractiveness by Sample, 2024 to 2034

Figure 177: South Asia and Pacific Market Attractiveness by Mode of Purchase, 2024 to 2034

Figure 178: South Asia and Pacific Market Attractiveness by Application, 2024 to 2034

Figure 179: South Asia and Pacific Market Attractiveness by End User, 2024 to 2034

Figure 180: South Asia and Pacific Market Attractiveness by Country, 2024 to 2034

Figure 181: East Asia Market Value (US$ Million) by Product, 2024 to 2034

Figure 182: East Asia Market Value (US$ Million) by Sample, 2024 to 2034

Figure 183: East Asia Market Value (US$ Million) by Mode of Purchase, 2024 to 2034

Figure 184: East Asia Market Value (US$ Million) by Application, 2024 to 2034

Figure 185: East Asia Market Value (US$ Million) by End User, 2024 to 2034

Figure 186: East Asia Market Value (US$ Million) by Country, 2024 to 2034

Figure 187: East Asia Market Value (US$ Million) Analysis by Country, 2019 to 2034

Figure 188: East Asia Market Value Share (%) and BPS Analysis by Country, 2024 to 2034

Figure 189: East Asia Market Y-o-Y Growth (%) Projections by Country, 2024 to 2034

Figure 190: East Asia Market Value (US$ Million) Analysis by Product, 2019 to 2034

Figure 191: East Asia Market Value Share (%) and BPS Analysis by Product, 2024 to 2034

Figure 192: East Asia Market Y-o-Y Growth (%) Projections by Product, 2024 to 2034

Figure 193: East Asia Market Value (US$ Million) Analysis by Sample, 2019 to 2034

Figure 194: East Asia Market Value Share (%) and BPS Analysis by Sample, 2024 to 2034

Figure 195: East Asia Market Y-o-Y Growth (%) Projections by Sample, 2024 to 2034

Figure 196: East Asia Market Value (US$ Million) Analysis by Mode of Purchase, 2019 to 2034

Figure 197: East Asia Market Value Share (%) and BPS Analysis by Mode of Purchase, 2024 to 2034

Figure 198: East Asia Market Y-o-Y Growth (%) Projections by Mode of Purchase, 2024 to 2034

Figure 199: East Asia Market Value (US$ Million) Analysis by Application, 2019 to 2034

Figure 200: East Asia Market Value Share (%) and BPS Analysis by Application, 2024 to 2034

Figure 201: East Asia Market Y-o-Y Growth (%) Projections by Application, 2024 to 2034

Figure 202: East Asia Market Value (US$ Million) Analysis by End User, 2019 to 2034

Figure 203: East Asia Market Value Share (%) and BPS Analysis by End User, 2024 to 2034

Figure 204: East Asia Market Y-o-Y Growth (%) Projections by End User, 2024 to 2034

Figure 205: East Asia Market Attractiveness by Product, 2024 to 2034

Figure 206: East Asia Market Attractiveness by Sample, 2024 to 2034

Figure 207: East Asia Market Attractiveness by Mode of Purchase, 2024 to 2034

Figure 208: East Asia Market Attractiveness by Application, 2024 to 2034

Figure 209: East Asia Market Attractiveness by End User, 2024 to 2034

Figure 210: East Asia Market Attractiveness by Country, 2024 to 2034

Figure 211: Middle East and Africa Market Value (US$ Million) by Product, 2024 to 2034

Figure 212: Middle East and Africa Market Value (US$ Million) by Sample, 2024 to 2034

Figure 213: Middle East and Africa Market Value (US$ Million) by Mode of Purchase, 2024 to 2034

Figure 214: Middle East and Africa Market Value (US$ Million) by Application, 2024 to 2034

Figure 215: Middle East and Africa Market Value (US$ Million) by End User, 2024 to 2034

Figure 216: Middle East and Africa Market Value (US$ Million) by Country, 2024 to 2034

Figure 217: Middle East and Africa Market Value (US$ Million) Analysis by Country, 2019 to 2034

Figure 218: Middle East and Africa Market Value Share (%) and BPS Analysis by Country, 2024 to 2034

Figure 219: Middle East and Africa Market Y-o-Y Growth (%) Projections by Country, 2024 to 2034

Figure 220: Middle East and Africa Market Value (US$ Million) Analysis by Product, 2019 to 2034

Figure 221: Middle East and Africa Market Value Share (%) and BPS Analysis by Product, 2024 to 2034

Figure 222: Middle East and Africa Market Y-o-Y Growth (%) Projections by Product, 2024 to 2034

Figure 223: Middle East and Africa Market Value (US$ Million) Analysis by Sample, 2019 to 2034

Figure 224: Middle East and Africa Market Value Share (%) and BPS Analysis by Sample, 2024 to 2034

Figure 225: Middle East and Africa Market Y-o-Y Growth (%) Projections by Sample, 2024 to 2034

Figure 226: Middle East and Africa Market Value (US$ Million) Analysis by Mode of Purchase, 2019 to 2034

Figure 227: Middle East and Africa Market Value Share (%) and BPS Analysis by Mode of Purchase, 2024 to 2034

Figure 228: Middle East and Africa Market Y-o-Y Growth (%) Projections by Mode of Purchase, 2024 to 2034

Figure 229: Middle East and Africa Market Value (US$ Million) Analysis by Application, 2019 to 2034

Figure 230: Middle East and Africa Market Value Share (%) and BPS Analysis by Application, 2024 to 2034

Figure 231: Middle East and Africa Market Y-o-Y Growth (%) Projections by Application, 2024 to 2034

Figure 232: Middle East and Africa Market Value (US$ Million) Analysis by End User, 2019 to 2034

Figure 233: Middle East and Africa Market Value Share (%) and BPS Analysis by End User, 2024 to 2034

Figure 234: Middle East and Africa Market Y-o-Y Growth (%) Projections by End User, 2024 to 2034

Figure 235: Middle East and Africa Market Attractiveness by Product, 2024 to 2034

Figure 236: Middle East and Africa Market Attractiveness by Sample, 2024 to 2034

Figure 237: Middle East and Africa Market Attractiveness by Mode of Purchase, 2024 to 2034

Figure 238: Middle East and Africa Market Attractiveness by Application, 2024 to 2034

Figure 239: Middle East and Africa Market Attractiveness by End User, 2024 to 2034

Figure 240: Middle East and Africa Market Attractiveness by Country, 2024 to 2034

Recommendations

Healthcare

Fertility and Pregnancy Rapid Test Kit Market

Published : October 2023

Food and Beverage

Fertility Supplements Market

Published : July 2022

Healthcare

Infertility Treatment Market

Published : May 2022

Explore Healthcare Insights

View Reports