The global Fertility Supplement industry is estimated to be worth USD 1,152.2 million by 2025 and is projected to reach USD 2,577.2 million by 2035, reflecting a CAGR of 8.4% over the assessment period 2025 to 2035.
There is an emerging study, especially among manufacturers over the formulation of fertility supplements targeting consumers, who are taking fertility pills. This includes enhanced use of natural compounds like vitamins, minerals, and herbs scientifically known to have hormonal balancing effects.
For example, the most common ingredients used now are folic acid, Zinc, Omega-3 fatty acids, and antioxidants and all of them are aimed to improve the quality of the gametes and hormonal balance. Delivery methods are also seeing innovation trends emerging for global manufacturers.
To increase consumer compliance and convenience companies are creating supplements in the form of gummies, powders, and capsules. Also, most manufacturers are investing in clinical research to ensure they offer functional products hence enhancing the consumers’ confidence and credibility to use.
Enterprises have developed personalized supplemental diets based on the results of a preliminary health check, a person’s lifestyle, and fertility-related issues (if diagnosed). Unlike a generalized approach, attitude to needs increases the chances of formulation or conception.
With an increase in knowledge of reproductive health, the market for fertility supplements is likely to fold further because of continuous research and development of manufacturers together with increased customer uptake of fertility supplements.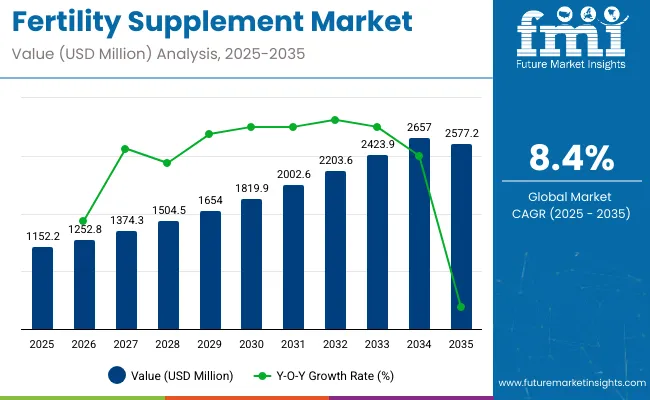
| Attributes | Description |
|---|---|
| Estimated Global Fertility Supplement Industry Size (2025E) | USD 1,152.2 million |
| Projected Global Fertility Supplement Industry Value (2035F) | USD 2,577.2 million |
| Value-based CAGR (2025 to 2035) | 8.4% |
Per capita spending on fertility supplements is increasing globally as more individuals and couples seek non-invasive and supportive approaches to reproductive health. Rising awareness of fertility issues, delayed parenthood, and growing interest in wellness-based solutions have driven demand for vitamins, minerals, and herbal formulations aimed at supporting conception and hormonal balance.
Fertility supplements are subject to government oversight to ensure they are safe, accurately labeled, and manufactured according to established quality standards. These regulations vary by region and aim to protect consumers from misleading claims and unsafe ingredients while supporting access to reliable reproductive health products.
Consumers shift towards organic-based supplements.
The fertility market, where consumers tend to opt for organic-based supplements rather than chemical ones. Companies such as Garden of Life and Fairhaven Health are thereby featuring and formulating organic fertility ingredients that are enriched with whole food and free from synthetic components.
These companies are keen on obtaining raw organic ingredients that are nutritious containing vitamins like folic acid, omega-3 fatty acids, and antioxidants critical in reproductive systems. This has assured the customer of organic formulations giving the products not only an efficiency factor but also a consumerism outlook with customers becoming conscious of environmentally friendly and healthy products in their fertility processes.
Conception supplement and current manufacturers focus.
Today more attention is paid to female fertility supplements as manufacturers respond to consumer demand with specific products for childbearing and avoidance of miscarriage. These brands include Premama and Fertility Blend which are developing special products with necessary nutrients including folic acid, vitamin D, and omega-fatty acids among others.
These nutrients are important in the regulation of hormones, in preparing eggs for fertilization, and in general reproductive ability. At the same time, manufacturers include spices such as the herb of castê and maca root product which has an impact on fertility.
Females need an even more form of care and attention that is required not only for the conception journey but also for women’s reproductive health given new knowledge about the biology of female conception.
Targeted solutions associated with male fertility under global consumer scrutiny.
There is a growing consumer consciousness all over the world when it comes to fertility issues and this has led industries to bring in solutions that are aimed at male fertility. Products by Life Extension and Zahler are currently concentrated on formulations that contain nutrients that help enhance sperm quality, including contents like zinc, selenium, and CoQ10.
Also, plant-based corporals like ashwagandha and maca roots are being used because they are said to boost testosterone and fertility levels. This increasing concentration on the male component in conception is responsive to new social shifts in focus toward the fertility supplement with the significance of the man in conception.
Global sales increased at a CAGR of 7.8% from 2020 to 2024. For the next ten years (2025 to 2035), projections are that expenditure on such products will rise at 8.4% CAGR.
Between 2020 and 2024, one of the developments that had been rapidly progressing was the individual approach to fertility treatments. Companies such as Fairhaven Health started to produce and sell lifestyle products, including customized supplements tested and comprehensively tailored according to the average person’s health profile.
From 2025 to 2035, the future of global fertility supplements seems to have several emerging and ongoing trends. One trend is technological, suggesting that the manufacturers will seek to incorporate applications and online forums for tracking individual fertility and complementary vitamin supplements. It also appears that brands are seeking partnerships with healthcare industries as a way to deepen their credibility and offer full services.
Sustainability will become one of the main trends to watch; accordingly, manufacturers will incorporate environmental features and packaging into their products, especially as more consumers start to become sharp about the environment. In formulation innovation, information gained in the literature will be put into practice by developing a compound formulation that delivers nutrients in their easily incorporated form.
Besides, an increase in plant-based and vegan formulations’ launching will tap into emerging trends in fertility supplements. During this shift, there will be robust calls to educate and to conduct awareness on fertility health as well as targeted Ingredient consumption will play a central role in increasing the demand for fertility supplements.
Tier 1 covers players that possess a high market share and are well-known brands in global fertility supplements. Most of the top companies in this tier are Fairhaven Health, Garden of Life, and Zahler, which sell many products targeting both male and female fertility, with products coming in different forms. The brands here are popular for their research-based creams and lotions that are clinically tested on human bodies.
Through extensive coverage of distribution channels coupled with strong relationships with healthcare professional investors and customers together with deep pockets necessary to finance aggressive marketing strategies, they are capable of dominating space and commanding consumer confidence and are thus powerful players determining market trends.
Tier 2 comprises supplier agencies that have cumulative industry sales. Fertility Blend and Premama is famous brands in this tier that created innovative products dedicated to different segments of the targeted audience, for instance, the feminine cycle or male performance increase.
These companies tend to prize formulation and active ingredients identifiable such as herbal properties and vitamins appropriate for fertility issues. In this regard, Tier 2 brands aim to develop increased market differentiation, while the end consumer gradually becomes more knowledgeable about available products.
Tier 3 now includes minor players and new entrants with products in specific segments of fertility supplements. Mamma Chia and NutraBlast tend to sell organic, plant-based, or special interest products with a focus on reproductive health benefits. Even though their market share is quite small in comparison to the other tier players the existence of these brands in the market is important to product variety and advancements.
They tend to use social media and online promoting tools to target local people, who are looking for natural ways and products to address fertility issues. This tier has the advantage of being able to adapt to the new trends within the consumption pattern for it to effectively compete within the Industry.
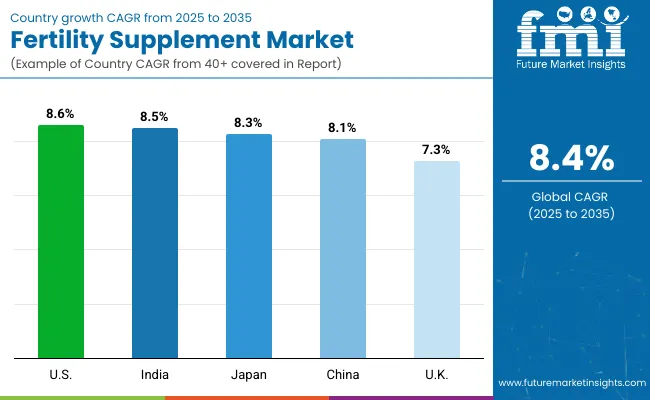
The following table shows the estimated growth rates of the top three territories. The USA, China, and Japan are set to exhibit high consumption, recording CAGRs of 8.6%, 8.1%, and 8.1%, respectively, through 2035.
| Countries | CAGR 2025 to 2035 |
|---|---|
| Japan | 8.3% |
| The USA | 8.6% |
| China | 8.1% |
The USA consumers of fertility supplements are precise about the human products they take and where the raw materials originate from. Such awareness has been realized due to increased issues over health and safety standards in addition to the wake of efficiency measures.
Most people in their reproductive health improvement processes would like to be fully assured that the supplements they are taking are manufactured from quality source ingredients. Therefore, there exists increased transparency in manufacturing processes, which decides for consumers.
With the origin of the food items consumer consume and want brands that give facts regarding the origins of their herbs and nutrients and how they were processed. Such a trend has made manufacturers become more selective in their production process and go for quality control certifications.
Moreover, more customers express their desire for supplements that do not contain artificial ingredients and incorporate substances like omega 3, and flaxseed oil. Consumer are more willing to spend their money not only on products that contain natural and not genetically modified organisms. Such demand has forced many manufacturers in the USA to adopt sustainable attitudes in sourcing and being friendly to the environment.
Recently there has been an entry of many manufacturers from China in the Industry for fertility supplements that contain compounds from traditional Chinese medicine. This has shifted mostly because people in the global society are increasingly turning to natural and holistic healing. Hence through the Chinese herbal medications for centuries there is a wide collection of plants that act as fertility-boosting plants.
These manufacturers are applying ageless wisdom and scientific methods of production in coming up with fertility boosters that can suit everybody. These formulations contain such herbs as Dong Quai, Goji berries, or Poria, each of which is known for its properties that can help regulate the hormonal background and support the process of reproduction.
These products have been made accessible through e-commerce since they also enjoy the convenience of online selling thus ensuring consumers get traditional remedies they would otherwise not find locally. Also, there is an increased usage of natural fertility treatments due to the adverse effects related to synthetic fertility supplements.
Manufacturers are also empowering quality assertions and accountability so that their products conform to global health standards. With increasing consumers’ interest in fertility supplements, these Chinese manufacturers are expected to have a unique place in the emerging industry of reproductive health based on both tradition and scientific evidence taking a role of satisfying consumers’ demand for natural products.
Currently, Japan is struggling to deal with population aging as birth rates decline, making the government come up with measures to boost birth rates. Among these goals are the measures of financial incentives, such as direct payments to child-rearing families to make child-rearing less costly.
Also, the government continues to increase the availability of cheap childcare facilities and soften the rates for them to allow working parents to afford to take their kids to daycare. Procedures for family-friendly baby bonding leave and other supportive government policies have also been improved for both mothers and fathers to be able to take time off work to be with their babies without the risk of losing money.
Further, the government is putting its money through educational activities that sensitize the people on work and family support. These short-term and long-term incentives benefit Japanese citizens as the government creates a baby-friendly environment, for example, by creating places where families stay with children, child centers, and organizing family-friendly events to support child-raising culture.
These strategies are an all-encompassing plan to address the low birth rate in Japan while at the same time spurring suggestions for couples to consider bearing children. Financial, social, and structural issues through which Japan possibly tries to alter its demography and care for future generations.
| Segment | Vitamins & Mineral (By Product Type) |
|---|---|
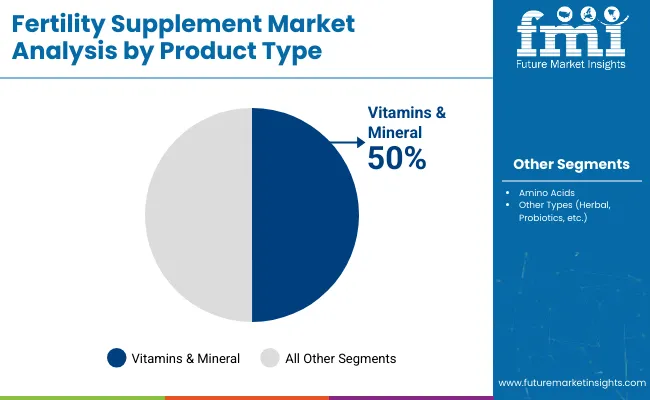
| Value Share (2025) | 50.0% |
There is a steadily growing demand for fertility-based vitamin and mineral supplements around the world as more people become aware of reproductive health and their natural alternatives. Manufacturers are trying to fill the gap in the industries by coming up with uniquely formulated products of traditional herbs mixed with the new nutritional values in the segment.
They also continue to integrate transparency in sourcing and production so that it can cultivate consumer trust. Customer awareness is rising to different aspects such as supplements should be organic, non-GMO, and should be scientifically proven. As such, they are fully investigating ingredients and brands before opting to make a purchase.
The manufacturers are focusing on clinical trials to prove the efficiency of the developed formulations and care for the environment at the same time. In combination, all these steps also indicate a new push in promoting the issue of reproductive health and empowering people with their fertility.
| Segment | Tablets (By Form) |
|---|---|
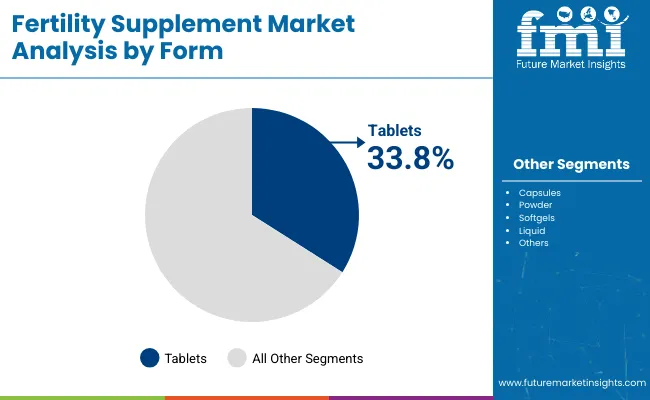
| Value Share (2025) | 33.8% |
Fertility supplements are healthy for women suffering from hormonal ailments related to fertility as they are likely to benefit from additives essential to bring hormonal irregularity in check. Most of these supplements include folic acid, vitamin D, and zinc which are vital in ovulation and regulation of menstruation.
Consequently, for females with conditions such as PCOS or irregular cycles, some supplements will help to control insulin and metabolic function therefore boosting overall ovarian function. Some ingredients that fertility supplements contain, such as omega-3 fatty acids help to decrease inflammation and improve hormonal balance.
Also, natural remedies such as the chasteberry (Vitex) supplements, have been found to regulate the progesterone and estrogen hormones and thus help to treat all symptoms that accompany hormonal disturbances. Other nutrients present in fertility supplements can also shield human reproductive cells from oxidative damage, enhancing fertility.
In conclusion, fertility supplements can be useful in cases of reproductive hormonal diseases, as well as in cases when a woman wants to become pregnant, for enhancement of her chances to do so, and for generally healthy women's problems.
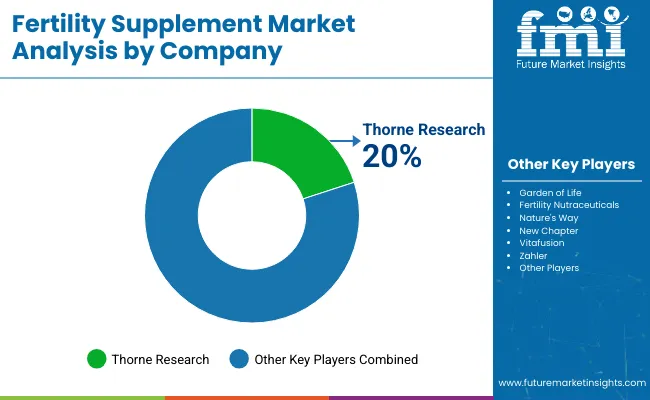
The market for fertility supplements remains concentrated to some extent with key players that are all involved in product development. Currently, it is easier to find a supplement for almost every need a human has given the fact that firms such as Fairhaven Health, Garden of Life, and Vitabiotics focus on supplying supplements within the reproductive system category.
In a facility such as Fairhaven Health, there have been products such as FertilAid that contain vitamins and herbs that help in ovulation and hormone improvements. This made their approach have a lot of backing among the consumers because it was based on scientific analysis.
Another aspect The Garden of Life Company is focused on is organic and GMO-free ingredients, thus the company has a product named Mykind Organics Fertility which causes interest among such clients. Due to their commitment and sheer willpower to ensure only natural and non-chemical components were used, their product range has been well placed for a sector that is fast moving into demanding the truth.
Vitabiotics further came up with Pregnacare as a prenatal supplement, with the ability to help conceive as well as for reproductive health. All their formulations meet preconception requirements and those during pregnancy.
These manufacturers have been able to be innovative in the production of products that have been meeting the needs of the consumer, while at the same time increasing the fertility supplements awareness of reproductive health which in return has helped improve the fecundity rate of most women.
According to the Product Type, the segment has been categorized into Vitamins & Minerals, Amino Acids, and Other Types (Herbal, Probiotics, etc.).
According to the Form, the segment has been categorized into Tablets, Capsules, Powder, Softgels, and Liquid.
As per the Demographic Age, the segment has been categorized into 18 to 24, 25 to 34, 35 to 44, and Above 44.
Industry analysis has been carried out in key countries of North America, Latin America, Europe, East Asia, South Asia, Oceania, and the Middle East & Africa.
The global industry is estimated at a value of USD 1,152.2 million in 2025.
Sales increased at 7.8 % CAGR between 2020 and 2024.
Some of the industry leaders include Garden of Life, Thorne Research, Fertility Nutraceuticals, Nature's Way, New Chapter, Vitafusion, Zahler, MediNatura, and Carlyle.
The North American territory is projected to hold a revenue share of 40.3 % over the forecast period.
The industry is projected to grow at a forecast CAGR of 8.4 % from 2025 to 2035.


Full Research Suite comprises of:
Market outlook & trends analysis
Interviews & case studies
Strategic recommendations
Vendor profiles & capabilities analysis
5-year forecasts
8 regions and 60+ country-level data splits
Market segment data splits
12 months of continuous data updates
DELIVERED AS:
PDF EXCEL ONLINE
Demand for Fertility Supplements in EU Size and Share Forecast Outlook 2025 to 2035
Fertility Test Market Size and Share Forecast Outlook 2025 to 2035
Fertility Pregnancy Rapid Test Kits Market Analysis - Size, Share, and Forecast 2025 to 2035
Fertility Tracking Apps Market
Infertility Drugs Market Analysis - Size, Share & Forecast 2025 to 2035
Infertility Treatment Market Overview - Trends & Growth Forecast 2024 to 2034
Supplements And Nutrition Packaging Market
Supplementary Protectors Market
ACF Supplements Market Size and Share Forecast Outlook 2025 to 2035
Food Supplement Ingredients Market Size and Share Forecast Outlook 2025 to 2035
Viscosupplementation Market Analysis - Size, Share, and Forecast Outlook 2025 to 2035
PDRN Supplements Market Size and Share Forecast Outlook 2025 to 2035
Viscosupplementation Industry Analysis in Europe - Size, Share & Forecast 2025 to 2035
Feed Supplements Market Analysis - Size, Share & Forecast 2025 to 2035
Sleep Supplement Market Size and Share Forecast Outlook 2025 to 2035
Gummy Supplements Market Size and Share Forecast Outlook 2025 to 2035
Fiber Supplements Market Size and Share Forecast Outlook 2025 to 2035
Vegan Supplements Market Analysis by Ingredient Type, Form, Customer Orientation , Sales Channel and Health Concer Through 2035
Analysis and Growth Projections for Green Supplement Business
Andro Supplements Market

Thank you!
You will receive an email from our Business Development Manager. Please be sure to check your SPAM/JUNK folder too.
Chat With
MaRIA