Fluorescent Pigment Market Size and Share Forecast Outlook 2025 to 2035

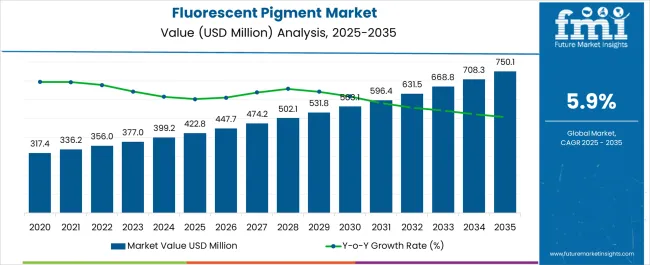
The Fluorescent Pigment Market is estimated to be valued at USD 422.8 million in 2025 and is projected to reach USD 750.1 million by 2035, registering a compound annual growth rate (CAGR) of 5.9% over the forecast period.
Quick Stats for Fluorescent Pigment Market

  • Fluorescent Pigment Market Value (2025): USD 422.8 million
  • Fluorescent Pigment Market Forecast Value (2035): USD 750.1 million
  • Fluorescent Pigment Market Forecast CAGR: 5.9%
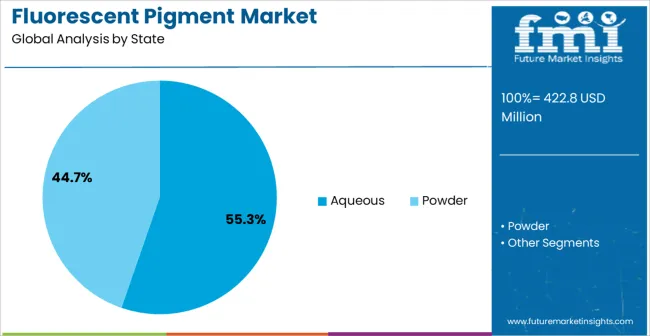
  • Leading Segment in Fluorescent Pigment Market in 2025: Aqueous (55.3%)
  • Key Growth Regions in Fluorescent Pigment Market: North America, Asia-Pacific, Europe
  • Top Key Players in Fluorescent Pigment Market: DayGlo Color Corp., Radiant Color NV, Luminochem, Wanlong Chemical Co., Ltd., Sinloihi Co., Ltd., Aron Universal Limited, Vicome Corp., Hangzhou Aibai Chemical Co., Ltd., Brilliant Group Inc., Wuxi Minghui International Trading Co., Ltd.

Fluorescent Pigment Market Market Value Analysis

Fluorescent Pigment Market Key Takeaways

Metric Value
Fluorescent Pigment Market Estimated Value in (2025 E) USD 422.8 million
Fluorescent Pigment Market Forecast Value in (2035 F) USD 750.1 million
Forecast CAGR (2025 to 2035) 5.9%

Why is the Fluorescent Pigment Market Growing?

The Fluorescent Pigment market is experiencing steady growth, driven by increasing demand across industrial, automotive, and decorative applications. Rising adoption of high-performance pigments in paints, coatings, plastics, and inks is supporting market expansion. The market is being further fueled by advancements in organic fluorescent pigments that offer enhanced color vibrancy, stability, and environmental compatibility.

Regulatory emphasis on reducing hazardous substances has increased the preference for eco-friendly and water-based formulations, which are compatible with sustainable manufacturing processes. Aqueous fluorescent pigments are increasingly preferred due to lower volatile organic compound emissions and ease of integration into industrial processes. Continuous innovations in pigment synthesis, color customization, and lightfastness are enhancing product performance and broadening application scope.

Manufacturers are investing in research and development to deliver tailored solutions for specialized end-use requirements, enabling higher adoption in decorative coatings, security inks, and automotive finishes As industries continue to prioritize quality, sustainability, and regulatory compliance, the Fluorescent Pigment market is expected to witness sustained growth, with innovations in product type and application driving future opportunities.

Segmental Analysis

The fluorescent pigment market is segmented by state, product type, application, and geographic regions. By state, fluorescent pigment market is divided into Aqueous and Powder. In terms of product type, fluorescent pigment market is classified into Organic and Inorganic. Based on application, fluorescent pigment market is segmented into Paint & Coatings, Inks, Plastic, Textiles, Construction, and Others. Regionally, the fluorescent pigment industry is classified into North America, Latin America, Western Europe, Eastern Europe, Balkan & Baltic Countries, Russia & Belarus, Central Asia, East Asia, South Asia & Pacific, and the Middle East & Africa.
Insights into the Aqueous State Segment

Fluorescent Pigment Market Analysis By State

The aqueous state segment is projected to hold 55.3% of the market revenue in 2025, establishing it as the leading state type. Its growth is being driven by the increasing preference for water-based pigment formulations that minimize environmental impact and meet regulatory standards on volatile organic compounds. Aqueous fluorescent pigments offer enhanced dispersibility, compatibility with multiple substrates, and ease of application in industrial processes.

Their adoption is further supported by improved stability, color vibrancy, and resistance to fading under light exposure. Manufacturers are leveraging aqueous formulations to provide sustainable alternatives in coatings, inks, and plastics while reducing processing complexity and operational hazards.

The segment’s prominence is reinforced by rising demand from environmentally conscious end users and sectors emphasizing green production methods With industries increasingly adopting sustainable materials without compromising performance, aqueous fluorescent pigments are expected to maintain their leading position, supported by continuous innovation in formulation, processing, and application versatility.
Insights into the Organic Product Type Segment

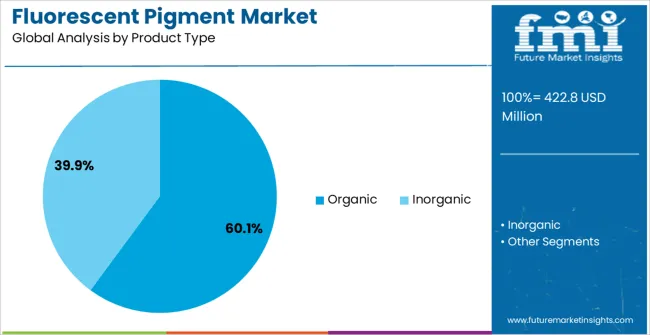
Fluorescent Pigment Market Analysis By Product Type

The organic product type segment is anticipated to account for 60.1% of the market revenue in 2025, making it the largest product type category. Its dominance is being driven by superior color intensity, tunable chromatic properties, and compatibility with diverse industrial applications. Organic fluorescent pigments provide high brightness, lightfastness, and chemical stability, making them preferred choices for high-performance paints, coatings, and printing inks.

Technological advancements in organic pigment synthesis and purification have further improved product reliability and safety. The ability to deliver vibrant and durable colors in eco-friendly formulations has strengthened market adoption.

Increasing application in automotive finishes, decorative coatings, and specialty inks is further supporting segment growth As manufacturers focus on sustainable yet high-performance pigment solutions, organic fluorescent pigments are expected to retain their leadership, driven by continuous research and development, expanding end-use adoption, and growing preference for environmentally compatible materials.
Insights into the Paint & Coatings Application Segment

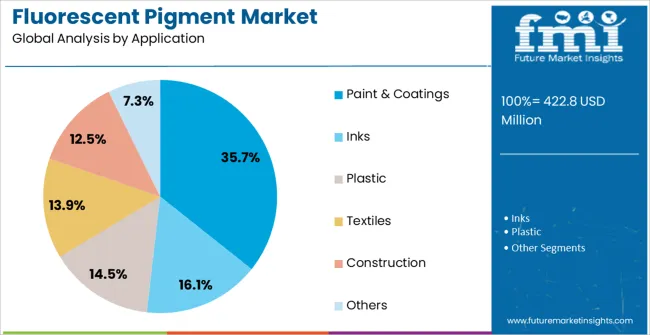
Fluorescent Pigment Market Analysis By Application

The paint and coatings application segment is projected to hold 35.7% of the market revenue in 2025, establishing it as the leading application area. Growth is driven by the increasing demand for visually appealing and high-performance finishes in construction, automotive, and decorative industries. Fluorescent pigments enhance color vibrancy, brightness, and durability, making them ideal for premium paints and coatings.

Adoption is further supported by innovations in water-based and eco-friendly formulations, which meet regulatory compliance and environmental sustainability standards. Manufacturers are increasingly integrating fluorescent pigments to achieve unique aesthetic effects, improve visual appeal, and provide functional benefits such as UV visibility and safety markings.

The segment’s growth is also reinforced by rising investments in urban infrastructure, commercial projects, and consumer-focused decorative applications As industries continue to prioritize aesthetics, durability, and regulatory compliance, the paint and coatings segment is expected to remain the primary driver of market growth, supported by technological innovations and broader adoption across commercial and industrial applications.

Market Overview

Fluorescent Pigment Market: Introduction

Fluorescent pigments are generally referred to pigments that are capable to absorb both the types of visible and non-visible electromagnetic waves and radiations and further to discharge them rapidly as energy of expected or desired wavelength. These pigments also shine in a highly specific color when light of expected wavelength is discharged on it.

On the commercial scale, the consumption of fluorescent pigment has been witnessed in numerous number of applications, such as formulation of paint and coating solution, inks, and textiles to name a few. Commercially, there are two types of fluorescent pigments used in the market, i.e., organic and inorganic, which synthesis from different sources.

Organic fluorescent pigment type is synthesized through natural and synthetic raw materials, on the other hand, inorganic fluorescent pigments are synthesized through mixing of different metal oxides. Both the types are commercially available in powder and dispersion form, tailor-made according to the end-user industry needs.

Most of the fluorescent pigments are capable to withstand in the demanding applications through its notable attributes such as able to withstand with bad climate conditions, high temperature, resistance against heat and different chemicals. These attributes help the adoption of these fluorescent pigments in different applications. Likewise, these fluorescent pigments find its adoption even in the automotive industry as a colorant for engineering plastics.
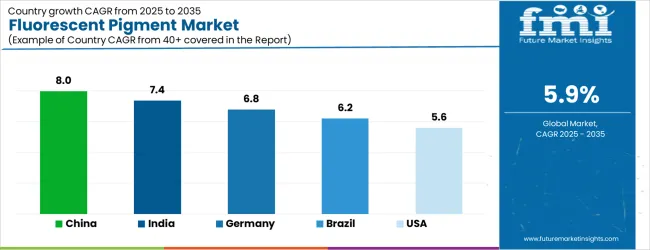
Analysis of Fluorescent Pigment Market By Key Countries

Fluorescent Pigment Market Cagr Analysis By Country

Country CAGR
China 8.0%
India 7.4%
Germany 6.8%
Brazil 6.2%
USA 5.6%
UK 5.0%
Japan 4.4%

Country-wise Analysis

The Fluorescent Pigment Market is expected to register a CAGR of 5.9% during the forecast period, exhibiting varied country level momentum. China leads with the highest CAGR of 8.0%, followed by India at 7.4%. Developed markets such as Germany, France, and the UK continue to expand steadily, while the USA is likely to grow at consistent rates. Japan posts the lowest CAGR at 4.4%, yet still underscores a broadly positive trajectory for the global Fluorescent Pigment Market. In 2024, Germany held a dominant revenue in the Western Europe market and is expected to grow with a CAGR of 6.8%. The USA Fluorescent Pigment Market is estimated to be valued at USD 153.1 million in 2025 and is anticipated to reach a valuation of USD 153.1 million by 2035. Sales are projected to rise at a CAGR of 0.0% over the forecast period between 2025 and 2035. While Japan and South Korea markets are estimated to be valued at USD 19.7 million and USD 11.4 million respectively in 2025.
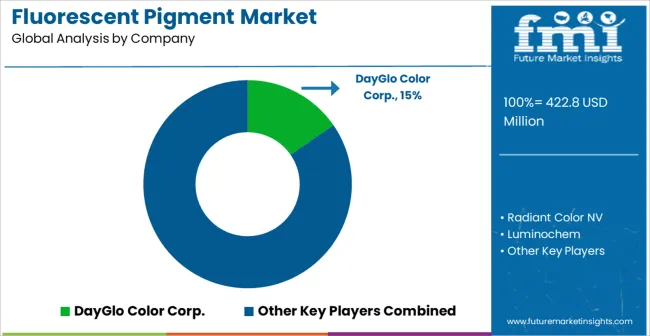
Key Players in the Fluorescent Pigment Market

Fluorescent Pigment Market Analysis By Company

  • DayGlo Color Corp.
  • Radiant Color NV
  • Luminochem
  • Wanlong Chemical Co., Ltd.
  • Sinloihi Co., Ltd.
  • Aron Universal Limited
  • Vicome Corp.
  • Hangzhou Aibai Chemical Co., Ltd.
  • Brilliant Group Inc.
  • Wuxi Minghui International Trading Co., Ltd.

Scope of the Report

Item Value
Quantitative Units USD 422.8 Million
State Aqueous and Powder
Product Type Organic and Inorganic
Application Paint & Coatings, Inks, Plastic, Textiles, Construction, and Others
Regions Covered North America, Europe, Asia-Pacific, Latin America, Middle East & Africa
Country Covered United States, Canada, Germany, France, United Kingdom, China, Japan, India, Brazil, South Africa
Key Companies Profiled DayGlo Color Corp., Radiant Color NV, Luminochem, Wanlong Chemical Co., Ltd., Sinloihi Co., Ltd., Aron Universal Limited, Vicome Corp., Hangzhou Aibai Chemical Co., Ltd., Brilliant Group Inc., and Wuxi Minghui International Trading Co., Ltd.

Fluorescent Pigment Market by Segments

State:

  • Aqueous
  • Powder

Product Type:

  • Organic
  • Inorganic

Application:

  • Paint & Coatings
  • Inks
  • Plastic
  • Textiles
  • Construction
  • Others

Region:

  • North America
    • USA
    • Canada
    • Mexico
  • Latin America
    • Brazil
    • Chile
    • Rest of Latin America
  • Western Europe
    • Germany
    • UK
    • Italy
    • Spain
    • France
    • Nordic
    • BENELUX
    • Rest of Western Europe
  • Eastern Europe
    • Russia
    • Poland
    • Hungary
    • Balkan & Baltic
    • Rest of Eastern Europe
  • East Asia
    • China
    • Japan
    • South Korea
  • South Asia and Pacific
    • India
    • ASEAN
    • Australia & New Zealand
    • Rest of South Asia and Pacific
  • Middle East & Africa
    • Kingdom of Saudi Arabia
    • Other GCC Countries
    • Turkiye
    • South Africa
    • Other African Union
    • Rest of Middle East & Africa

Table of Content

  1. Executive Summary
    • Global Market Outlook
    • Demand-side Trends
    • Supply-side Trends
    • Technology Roadmap Analysis
    • Analysis and Recommendations
  2. Market Overview
    • Market Coverage / Taxonomy
    • Market Definition / Scope / Limitations
  3. Market Background
    • Market Dynamics
      • Drivers
      • Restraints
      • Opportunity
      • Trends
    • Scenario Forecast
      • Demand in Optimistic Scenario
      • Demand in Likely Scenario
      • Demand in Conservative Scenario
    • Opportunity Map Analysis
    • Product Life Cycle Analysis
    • Supply Chain Analysis
    • Investment Feasibility Matrix
    • Value Chain Analysis
    • PESTLE and Porter’s Analysis
    • Regulatory Landscape
    • Regional Parent Market Outlook
    • Production and Consumption Statistics
    • Import and Export Statistics
  4. Global Market Analysis 2020 to 2024 and Forecast, 2025 to 2035
    • Historical Market Size Value (USD Million) Analysis, 2020 to 2024
    • Current and Future Market Size Value (USD Million) Projections, 2025 to 2035
      • Y-o-Y Growth Trend Analysis
      • Absolute $ Opportunity Analysis
  5. Global Market Pricing Analysis 2020 to 2024 and Forecast 2025 to 2035
  6. Global Market Analysis 2020 to 2024 and Forecast 2025 to 2035, By State
    • Introduction / Key Findings
    • Historical Market Size Value (USD Million) Analysis By State , 2020 to 2024
    • Current and Future Market Size Value (USD Million) Analysis and Forecast By State , 2025 to 2035
      • Aqueous
      • Powder
    • Y-o-Y Growth Trend Analysis By State , 2020 to 2024
    • Absolute $ Opportunity Analysis By State , 2025 to 2035
  7. Global Market Analysis 2020 to 2024 and Forecast 2025 to 2035, By Product Type
    • Introduction / Key Findings
    • Historical Market Size Value (USD Million) Analysis By Product Type, 2020 to 2024
    • Current and Future Market Size Value (USD Million) Analysis and Forecast By Product Type, 2025 to 2035
      • Organic
      • Inorganic
    • Y-o-Y Growth Trend Analysis By Product Type, 2020 to 2024
    • Absolute $ Opportunity Analysis By Product Type, 2025 to 2035
  8. Global Market Analysis 2020 to 2024 and Forecast 2025 to 2035, By Application
    • Introduction / Key Findings
    • Historical Market Size Value (USD Million) Analysis By Application, 2020 to 2024
    • Current and Future Market Size Value (USD Million) Analysis and Forecast By Application, 2025 to 2035
      • Paint & Coatings
      • Inks
      • Plastic
      • Textiles
      • Construction
      • Others
    • Y-o-Y Growth Trend Analysis By Application, 2020 to 2024
    • Absolute $ Opportunity Analysis By Application, 2025 to 2035
  9. Global Market Analysis 2020 to 2024 and Forecast 2025 to 2035, By Region
    • Introduction
    • Historical Market Size Value (USD Million) Analysis By Region, 2020 to 2024
    • Current Market Size Value (USD Million) Analysis and Forecast By Region, 2025 to 2035
      • North America
      • Latin America
      • Western Europe
      • Eastern Europe
      • East Asia
      • South Asia and Pacific
      • Middle East & Africa
    • Market Attractiveness Analysis By Region
  10. North America Market Analysis 2020 to 2024 and Forecast 2025 to 2035, By Country
    • Historical Market Size Value (USD Million) Trend Analysis By Market Taxonomy, 2020 to 2024
    • Market Size Value (USD Million) Forecast By Market Taxonomy, 2025 to 2035
      • By Country
        • USA
        • Canada
        • Mexico
      • By State
      • By Product Type
      • By Application
    • Market Attractiveness Analysis
      • By Country
      • By State
      • By Product Type
      • By Application
    • Key Takeaways
  11. Latin America Market Analysis 2020 to 2024 and Forecast 2025 to 2035, By Country
    • Historical Market Size Value (USD Million) Trend Analysis By Market Taxonomy, 2020 to 2024
    • Market Size Value (USD Million) Forecast By Market Taxonomy, 2025 to 2035
      • By Country
        • Brazil
        • Chile
        • Rest of Latin America
      • By State
      • By Product Type
      • By Application
    • Market Attractiveness Analysis
      • By Country
      • By State
      • By Product Type
      • By Application
    • Key Takeaways
  12. Western Europe Market Analysis 2020 to 2024 and Forecast 2025 to 2035, By Country
    • Historical Market Size Value (USD Million) Trend Analysis By Market Taxonomy, 2020 to 2024
    • Market Size Value (USD Million) Forecast By Market Taxonomy, 2025 to 2035
      • By Country
        • Germany
        • UK
        • Italy
        • Spain
        • France
        • Nordic
        • BENELUX
        • Rest of Western Europe
      • By State
      • By Product Type
      • By Application
    • Market Attractiveness Analysis
      • By Country
      • By State
      • By Product Type
      • By Application
    • Key Takeaways
  13. Eastern Europe Market Analysis 2020 to 2024 and Forecast 2025 to 2035, By Country
    • Historical Market Size Value (USD Million) Trend Analysis By Market Taxonomy, 2020 to 2024
    • Market Size Value (USD Million) Forecast By Market Taxonomy, 2025 to 2035
      • By Country
        • Russia
        • Poland
        • Hungary
        • Balkan & Baltic
        • Rest of Eastern Europe
      • By State
      • By Product Type
      • By Application
    • Market Attractiveness Analysis
      • By Country
      • By State
      • By Product Type
      • By Application
    • Key Takeaways
  14. East Asia Market Analysis 2020 to 2024 and Forecast 2025 to 2035, By Country
    • Historical Market Size Value (USD Million) Trend Analysis By Market Taxonomy, 2020 to 2024
    • Market Size Value (USD Million) Forecast By Market Taxonomy, 2025 to 2035
      • By Country
        • China
        • Japan
        • South Korea
      • By State
      • By Product Type
      • By Application
    • Market Attractiveness Analysis
      • By Country
      • By State
      • By Product Type
      • By Application
    • Key Takeaways
  15. South Asia and Pacific Market Analysis 2020 to 2024 and Forecast 2025 to 2035, By Country
    • Historical Market Size Value (USD Million) Trend Analysis By Market Taxonomy, 2020 to 2024
    • Market Size Value (USD Million) Forecast By Market Taxonomy, 2025 to 2035
      • By Country
        • India
        • ASEAN
        • Australia & New Zealand
        • Rest of South Asia and Pacific
      • By State
      • By Product Type
      • By Application
    • Market Attractiveness Analysis
      • By Country
      • By State
      • By Product Type
      • By Application
    • Key Takeaways
  16. Middle East & Africa Market Analysis 2020 to 2024 and Forecast 2025 to 2035, By Country
    • Historical Market Size Value (USD Million) Trend Analysis By Market Taxonomy, 2020 to 2024
    • Market Size Value (USD Million) Forecast By Market Taxonomy, 2025 to 2035
      • By Country
        • Kingdom of Saudi Arabia
        • Other GCC Countries
        • Turkiye
        • South Africa
        • Other African Union
        • Rest of Middle East & Africa
      • By State
      • By Product Type
      • By Application
    • Market Attractiveness Analysis
      • By Country
      • By State
      • By Product Type
      • By Application
    • Key Takeaways
  17. Key Countries Market Analysis
    • USA
      • Pricing Analysis
      • Market Share Analysis, 2024
        • By State
        • By Product Type
        • By Application
    • Canada
      • Pricing Analysis
      • Market Share Analysis, 2024
        • By State
        • By Product Type
        • By Application
    • Mexico
      • Pricing Analysis
      • Market Share Analysis, 2024
        • By State
        • By Product Type
        • By Application
    • Brazil
      • Pricing Analysis
      • Market Share Analysis, 2024
        • By State
        • By Product Type
        • By Application
    • Chile
      • Pricing Analysis
      • Market Share Analysis, 2024
        • By State
        • By Product Type
        • By Application
    • Germany
      • Pricing Analysis
      • Market Share Analysis, 2024
        • By State
        • By Product Type
        • By Application
    • UK
      • Pricing Analysis
      • Market Share Analysis, 2024
        • By State
        • By Product Type
        • By Application
    • Italy
      • Pricing Analysis
      • Market Share Analysis, 2024
        • By State
        • By Product Type
        • By Application
    • Spain
      • Pricing Analysis
      • Market Share Analysis, 2024
        • By State
        • By Product Type
        • By Application
    • France
      • Pricing Analysis
      • Market Share Analysis, 2024
        • By State
        • By Product Type
        • By Application
    • India
      • Pricing Analysis
      • Market Share Analysis, 2024
        • By State
        • By Product Type
        • By Application
    • ASEAN
      • Pricing Analysis
      • Market Share Analysis, 2024
        • By State
        • By Product Type
        • By Application
    • Australia & New Zealand
      • Pricing Analysis
      • Market Share Analysis, 2024
        • By State
        • By Product Type
        • By Application
    • China
      • Pricing Analysis
      • Market Share Analysis, 2024
        • By State
        • By Product Type
        • By Application
    • Japan
      • Pricing Analysis
      • Market Share Analysis, 2024
        • By State
        • By Product Type
        • By Application
    • South Korea
      • Pricing Analysis
      • Market Share Analysis, 2024
        • By State
        • By Product Type
        • By Application
    • Russia
      • Pricing Analysis
      • Market Share Analysis, 2024
        • By State
        • By Product Type
        • By Application
    • Poland
      • Pricing Analysis
      • Market Share Analysis, 2024
        • By State
        • By Product Type
        • By Application
    • Hungary
      • Pricing Analysis
      • Market Share Analysis, 2024
        • By State
        • By Product Type
        • By Application
    • Kingdom of Saudi Arabia
      • Pricing Analysis
      • Market Share Analysis, 2024
        • By State
        • By Product Type
        • By Application
    • Turkiye
      • Pricing Analysis
      • Market Share Analysis, 2024
        • By State
        • By Product Type
        • By Application
    • South Africa
      • Pricing Analysis
      • Market Share Analysis, 2024
        • By State
        • By Product Type
        • By Application
  18. Market Structure Analysis
    • Competition Dashboard
    • Competition Benchmarking
    • Market Share Analysis of Top Players
      • By Regional
      • By State
      • By Product Type
      • By Application
  19. Competition Analysis
    • Competition Deep Dive
      • DayGlo Color Corp.
        • Overview
        • Product Portfolio
        • Profitability by Market Segments (Product/Age /Sales Channel/Region)
        • Sales Footprint
        • Strategy Overview
          • Marketing Strategy
          • Product Strategy
          • Channel Strategy
      • Radiant Color NV
      • Luminochem
      • Wanlong Chemical Co., Ltd.
      • Sinloihi Co., Ltd.
      • Aron Universal Limited
      • Vicome Corp.
      • Hangzhou Aibai Chemical Co., Ltd.
      • Brilliant Group Inc.
      • Wuxi Minghui International Trading Co., Ltd.
  20. Assumptions & Acronyms Used
  21. Research Methodology

List of Tables

  • Table 1: Global Market Value (USD Million) Forecast by Region, 2020-2035
  • Table 2: Global Market Value (USD Million) Forecast by State , 2020-2035
  • Table 3: Global Market Value (USD Million) Forecast by Product Type, 2020-2035
  • Table 4: Global Market Value (USD Million) Forecast by Application, 2020-2035
  • Table 5: North America Market Value (USD Million) Forecast by Country, 2020-2035
  • Table 6: North America Market Value (USD Million) Forecast by State , 2020-2035
  • Table 7: North America Market Value (USD Million) Forecast by Product Type, 2020-2035
  • Table 8: North America Market Value (USD Million) Forecast by Application, 2020-2035
  • Table 9: Latin America Market Value (USD Million) Forecast by Country, 2020-2035
  • Table 10: Latin America Market Value (USD Million) Forecast by State , 2020-2035
  • Table 11: Latin America Market Value (USD Million) Forecast by Product Type, 2020-2035
  • Table 12: Latin America Market Value (USD Million) Forecast by Application, 2020-2035
  • Table 13: Western Europe Market Value (USD Million) Forecast by Country, 2020-2035
  • Table 14: Western Europe Market Value (USD Million) Forecast by State , 2020-2035
  • Table 15: Western Europe Market Value (USD Million) Forecast by Product Type, 2020-2035
  • Table 16: Western Europe Market Value (USD Million) Forecast by Application, 2020-2035
  • Table 17: Eastern Europe Market Value (USD Million) Forecast by Country, 2020-2035
  • Table 18: Eastern Europe Market Value (USD Million) Forecast by State , 2020-2035
  • Table 19: Eastern Europe Market Value (USD Million) Forecast by Product Type, 2020-2035
  • Table 20: Eastern Europe Market Value (USD Million) Forecast by Application, 2020-2035
  • Table 21: East Asia Market Value (USD Million) Forecast by Country, 2020-2035
  • Table 22: East Asia Market Value (USD Million) Forecast by State , 2020-2035
  • Table 23: East Asia Market Value (USD Million) Forecast by Product Type, 2020-2035
  • Table 24: East Asia Market Value (USD Million) Forecast by Application, 2020-2035
  • Table 25: South Asia and Pacific Market Value (USD Million) Forecast by Country, 2020-2035
  • Table 26: South Asia and Pacific Market Value (USD Million) Forecast by State , 2020-2035
  • Table 27: South Asia and Pacific Market Value (USD Million) Forecast by Product Type, 2020-2035
  • Table 28: South Asia and Pacific Market Value (USD Million) Forecast by Application, 2020-2035
  • Table 29: Middle East & Africa Market Value (USD Million) Forecast by Country, 2020-2035
  • Table 30: Middle East & Africa Market Value (USD Million) Forecast by State , 2020-2035
  • Table 31: Middle East & Africa Market Value (USD Million) Forecast by Product Type, 2020-2035
  • Table 32: Middle East & Africa Market Value (USD Million) Forecast by Application, 2020-2035

List of Figures

  • Figure 1: Global Market Pricing Analysis
  • Figure 2: Global Market Value (USD Million) Forecast 2020-2035
  • Figure 3: Global Market Value Share and BPS Analysis by State , 2025 and 2035
  • Figure 4: Global Market Y-o-Y Growth Comparison by State , 2025-2035
  • Figure 5: Global Market Attractiveness Analysis by State
  • Figure 6: Global Market Value Share and BPS Analysis by Product Type, 2025 and 2035
  • Figure 7: Global Market Y-o-Y Growth Comparison by Product Type, 2025-2035
  • Figure 8: Global Market Attractiveness Analysis by Product Type
  • Figure 9: Global Market Value Share and BPS Analysis by Application, 2025 and 2035
  • Figure 10: Global Market Y-o-Y Growth Comparison by Application, 2025-2035
  • Figure 11: Global Market Attractiveness Analysis by Application
  • Figure 12: Global Market Value (USD Million) Share and BPS Analysis by Region, 2025 and 2035
  • Figure 13: Global Market Y-o-Y Growth Comparison by Region, 2025-2035
  • Figure 14: Global Market Attractiveness Analysis by Region
  • Figure 15: North America Market Incremental Dollar Opportunity, 2025-2035
  • Figure 16: Latin America Market Incremental Dollar Opportunity, 2025-2035
  • Figure 17: Western Europe Market Incremental Dollar Opportunity, 2025-2035
  • Figure 18: Eastern Europe Market Incremental Dollar Opportunity, 2025-2035
  • Figure 19: East Asia Market Incremental Dollar Opportunity, 2025-2035
  • Figure 20: South Asia and Pacific Market Incremental Dollar Opportunity, 2025-2035
  • Figure 21: Middle East & Africa Market Incremental Dollar Opportunity, 2025-2035
  • Figure 22: North America Market Value Share and BPS Analysis by Country, 2025 and 2035
  • Figure 23: North America Market Value Share and BPS Analysis by State , 2025 and 2035
  • Figure 24: North America Market Y-o-Y Growth Comparison by State , 2025-2035
  • Figure 25: North America Market Attractiveness Analysis by State
  • Figure 26: North America Market Value Share and BPS Analysis by Product Type, 2025 and 2035
  • Figure 27: North America Market Y-o-Y Growth Comparison by Product Type, 2025-2035
  • Figure 28: North America Market Attractiveness Analysis by Product Type
  • Figure 29: North America Market Value Share and BPS Analysis by Application, 2025 and 2035
  • Figure 30: North America Market Y-o-Y Growth Comparison by Application, 2025-2035
  • Figure 31: North America Market Attractiveness Analysis by Application
  • Figure 32: Latin America Market Value Share and BPS Analysis by Country, 2025 and 2035
  • Figure 33: Latin America Market Value Share and BPS Analysis by State , 2025 and 2035
  • Figure 34: Latin America Market Y-o-Y Growth Comparison by State , 2025-2035
  • Figure 35: Latin America Market Attractiveness Analysis by State
  • Figure 36: Latin America Market Value Share and BPS Analysis by Product Type, 2025 and 2035
  • Figure 37: Latin America Market Y-o-Y Growth Comparison by Product Type, 2025-2035
  • Figure 38: Latin America Market Attractiveness Analysis by Product Type
  • Figure 39: Latin America Market Value Share and BPS Analysis by Application, 2025 and 2035
  • Figure 40: Latin America Market Y-o-Y Growth Comparison by Application, 2025-2035
  • Figure 41: Latin America Market Attractiveness Analysis by Application
  • Figure 42: Western Europe Market Value Share and BPS Analysis by Country, 2025 and 2035
  • Figure 43: Western Europe Market Value Share and BPS Analysis by State , 2025 and 2035
  • Figure 44: Western Europe Market Y-o-Y Growth Comparison by State , 2025-2035
  • Figure 45: Western Europe Market Attractiveness Analysis by State
  • Figure 46: Western Europe Market Value Share and BPS Analysis by Product Type, 2025 and 2035
  • Figure 47: Western Europe Market Y-o-Y Growth Comparison by Product Type, 2025-2035
  • Figure 48: Western Europe Market Attractiveness Analysis by Product Type
  • Figure 49: Western Europe Market Value Share and BPS Analysis by Application, 2025 and 2035
  • Figure 50: Western Europe Market Y-o-Y Growth Comparison by Application, 2025-2035
  • Figure 51: Western Europe Market Attractiveness Analysis by Application
  • Figure 52: Eastern Europe Market Value Share and BPS Analysis by Country, 2025 and 2035
  • Figure 53: Eastern Europe Market Value Share and BPS Analysis by State , 2025 and 2035
  • Figure 54: Eastern Europe Market Y-o-Y Growth Comparison by State , 2025-2035
  • Figure 55: Eastern Europe Market Attractiveness Analysis by State
  • Figure 56: Eastern Europe Market Value Share and BPS Analysis by Product Type, 2025 and 2035
  • Figure 57: Eastern Europe Market Y-o-Y Growth Comparison by Product Type, 2025-2035
  • Figure 58: Eastern Europe Market Attractiveness Analysis by Product Type
  • Figure 59: Eastern Europe Market Value Share and BPS Analysis by Application, 2025 and 2035
  • Figure 60: Eastern Europe Market Y-o-Y Growth Comparison by Application, 2025-2035
  • Figure 61: Eastern Europe Market Attractiveness Analysis by Application
  • Figure 62: East Asia Market Value Share and BPS Analysis by Country, 2025 and 2035
  • Figure 63: East Asia Market Value Share and BPS Analysis by State , 2025 and 2035
  • Figure 64: East Asia Market Y-o-Y Growth Comparison by State , 2025-2035
  • Figure 65: East Asia Market Attractiveness Analysis by State
  • Figure 66: East Asia Market Value Share and BPS Analysis by Product Type, 2025 and 2035
  • Figure 67: East Asia Market Y-o-Y Growth Comparison by Product Type, 2025-2035
  • Figure 68: East Asia Market Attractiveness Analysis by Product Type
  • Figure 69: East Asia Market Value Share and BPS Analysis by Application, 2025 and 2035
  • Figure 70: East Asia Market Y-o-Y Growth Comparison by Application, 2025-2035
  • Figure 71: East Asia Market Attractiveness Analysis by Application
  • Figure 72: South Asia and Pacific Market Value Share and BPS Analysis by Country, 2025 and 2035
  • Figure 73: South Asia and Pacific Market Value Share and BPS Analysis by State , 2025 and 2035
  • Figure 74: South Asia and Pacific Market Y-o-Y Growth Comparison by State , 2025-2035
  • Figure 75: South Asia and Pacific Market Attractiveness Analysis by State
  • Figure 76: South Asia and Pacific Market Value Share and BPS Analysis by Product Type, 2025 and 2035
  • Figure 77: South Asia and Pacific Market Y-o-Y Growth Comparison by Product Type, 2025-2035
  • Figure 78: South Asia and Pacific Market Attractiveness Analysis by Product Type
  • Figure 79: South Asia and Pacific Market Value Share and BPS Analysis by Application, 2025 and 2035
  • Figure 80: South Asia and Pacific Market Y-o-Y Growth Comparison by Application, 2025-2035
  • Figure 81: South Asia and Pacific Market Attractiveness Analysis by Application
  • Figure 82: Middle East & Africa Market Value Share and BPS Analysis by Country, 2025 and 2035
  • Figure 83: Middle East & Africa Market Value Share and BPS Analysis by State , 2025 and 2035
  • Figure 84: Middle East & Africa Market Y-o-Y Growth Comparison by State , 2025-2035
  • Figure 85: Middle East & Africa Market Attractiveness Analysis by State
  • Figure 86: Middle East & Africa Market Value Share and BPS Analysis by Product Type, 2025 and 2035
  • Figure 87: Middle East & Africa Market Y-o-Y Growth Comparison by Product Type, 2025-2035
  • Figure 88: Middle East & Africa Market Attractiveness Analysis by Product Type
  • Figure 89: Middle East & Africa Market Value Share and BPS Analysis by Application, 2025 and 2035
  • Figure 90: Middle East & Africa Market Y-o-Y Growth Comparison by Application, 2025-2035
  • Figure 91: Middle East & Africa Market Attractiveness Analysis by Application
  • Figure 92: Global Market - Tier Structure Analysis
  • Figure 93: Global Market - Company Share Analysis

Frequently Asked Questions

How big is the fluorescent pigment market in 2025?

The global fluorescent pigment market is estimated to be valued at USD 422.8 million in 2025.

What will be the size of fluorescent pigment market in 2035?

The market size for the fluorescent pigment market is projected to reach USD 750.1 million by 2035.

How much will be the fluorescent pigment market growth between 2025 and 2035?

The fluorescent pigment market is expected to grow at a 5.9% CAGR between 2025 and 2035.

What are the key product types in the fluorescent pigment market?

The key product types in fluorescent pigment market are aqueous and powder.

Which product type segment to contribute significant share in the fluorescent pigment market in 2025?

In terms of product type, organic segment to command 60.1% share in the fluorescent pigment market in 2025.

Explore Similar Insights

Future Market Insights

Fluorescent Pigment Market

Chat With MaRIA

Chat With

MaRIA

Hi There, I am MaRIA, Your Market Research Intelligence Assistant. How may I help you?