Fluorescent Skincare Compounds Market Size and Share Forecast Outlook 2025 to 2035

A valuation of USD 780.3 million is projected for the Fluorescent Skincare Compounds Market in 2025, with the figure anticipated to reach USD 2,709.4 million by 2035. This reflects an expansion of USD 1,929.1 million over the decade, equal to a 248% rise. The trajectory represents a CAGR of 13.3% during the forecast period, highlighting robust industry momentum.

From 2025 to 2030, the market is expected to expand from USD 780.3 million to USD 1,454.0 million, an addition of USD 673.7 million. This phase contributes 35% of the decade’s total growth, supported by early consumer adoption of instant radiance products and a rising inclination toward clean-label claims.
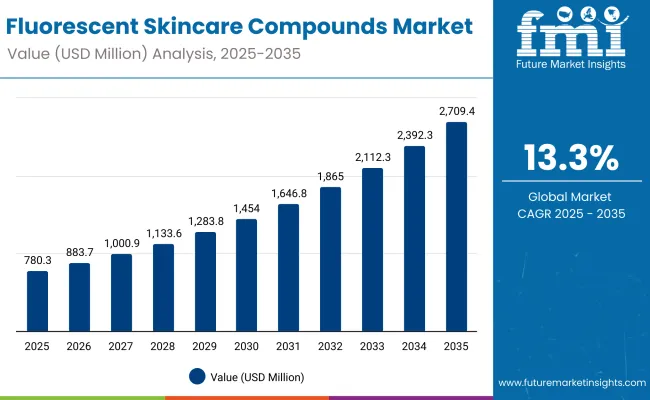
Quick Stats for Fluorescent Skincare Compounds Market

  • Market Value (2025): USD 780.3 Million
  • Market Forecast Value (2035): USD 2,709.4 Million
  • Market Forecast CAGR (2025 to 2035): 13.3%
  • Leading Segment in 2025: Instant radiance/“tone-up” (52.5%)
  • Key Growth Regions: Asia-Pacific, North America, Europe
  • Top Key Players: L’Oréal, Shiseido, MAC Cosmetics, NYX, Huda Beauty, KVD Beauty, ColourPop, Kryolan, Mehron, Make Up For Ever

Fluorescent Skincare Compounds Market

Fluorescent Skincare Compounds Market Key Takeaways

Metric Value
Fluorescent Skincare Compounds Market Estimated Value In (2025E) USD 780.3 million
Fluorescent Skincare Compounds Market Forecast Value In (2035F) USD 2,709.4 million
Forecast CAGR (2025 to 2035) 13.3%

The latter half of the decade, spanning 2030 to 2035, is projected to deliver an even sharper growth curve, with the market rising from USD 1,454.0 million to USD 2,709.4 million. This period adds USD 1,255.4 million, contributing 65% of the total growth, driven by wider accessibility, stronger adoption across emerging economies, and the integration of bio-derived actives into mainstream formulations.

Instant radiance or “tone-up” solutions are expected to dominate with a 52.5% share in 2025, underpinned by strong demand for quick-effect products. In product type, primers are forecast to lead with 49.4% share, indicating their prominence as a base for multifunctional skincare routines. These dominant categories are expected to maintain influence throughout the decade, while evolving claims such as clean-label and fragrance-free are anticipated to further reshape consumer preferences and accelerate future market expansion.

From 2020 to 2024, momentum in fluorescent formulations was gradually established, setting the foundation for rapid growth from 2025 onward. By 2025, demand for instant radiance-driven skincare is expected to lead market adoption, while primers are projected to dominate product preferences. Competitive positioning is anticipated to shift as clean-label claims and bio-derived actives gain strength, fostering differentiation in a fragmented landscape.

Over the forecast period, the market is expected to transition toward broader ingredient innovation, with regional leaders in Asia-Pacific spearheading global adoption. Leading brands are projected to enhance their competitive edge by leveraging science-backed claims, digital engagement strategies, and sustained R&D investments, while emerging labels are expected to compete through ethical positioning and niche appeal.

Why The Fluorescent Skincare Compounds Market is growing?

Growth in the fluorescent skincare compounds market is being driven by the rising consumer preference for instant radiance solutions that deliver quick aesthetic results while maintaining skincare benefits. The appeal of optical brightening and tone-up effects has been amplified by social media trends and the pursuit of flawless skin appearance.

Increasing alignment with clean-label, dermatologist-tested, and vegan claims is reinforcing consumer trust, enabling wider adoption across both premium and mass-market channels. Strong advances in bio-derived actives and encapsulated pigments are being integrated into formulations, allowing brands to differentiate through innovation and sustainability.

Expansion is also being supported by robust demand in emerging Asian markets, where beauty culture and digital engagement are accelerating product uptake. E-commerce platforms are further amplifying accessibility, enhancing visibility for both global and niche brands. As multifunctional and science-backed solutions gain traction, the market is expected to sustain double-digit growth over the forecast horizon.

Segmental Analysis

Segmentation of the Fluorescent Skincare Compounds Market has been structured to reflect evolving consumer behaviors and technological advancements in formulation science. The market is divided into function, claim, and product type, each highlighting critical adoption drivers. Functional segmentation underlines consumer preference for instant radiance, which has gained traction as beauty routines prioritize immediate results.

Claim-based segmentation emphasizes the growing demand for clean-label and ethical products, driven by rising transparency and safety awareness. Product type segmentation highlights the balance between primers and other skincare essentials, reflecting how consumers integrate fluorescent compounds into daily routines. Each of these categories provides a forward-looking view of the market, offering insights into shifting consumer inclinations and the role of innovation in shaping future demand.
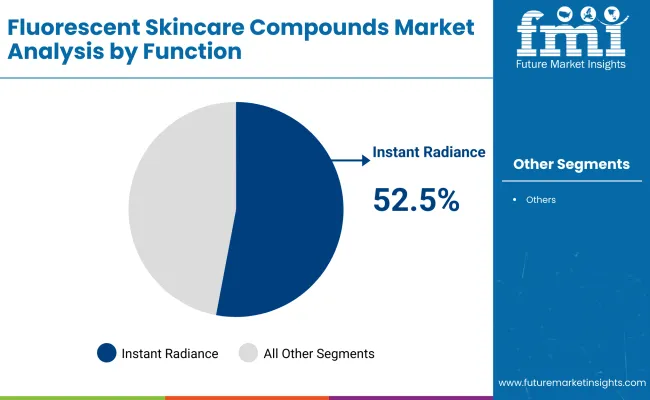
Insights into the Function Segment with Instant Radiance Leading in Market Share

Fluorescent Skincare Compounds Market By Function

Segment Market Value Share, 2025
Instant radiance/“tone-up” 52.5%
Others 47.5%

Instant radiance/“tone-up” is expected to lead the function segment with a 52.5% share in 2025, equivalent to USD 410.1 million, while other functions hold 47.5% share worth USD 370.45 million.

The segment’s dominance is being reinforced by the consumer preference for products that deliver instant results without compromising skincare benefits. Broader functions, such as UV coverage tracking and optical blur, are sustaining adoption as multi-purpose claims gain attention. With beauty standards shifting toward quick transformation, the function mix is expected to evolve further.
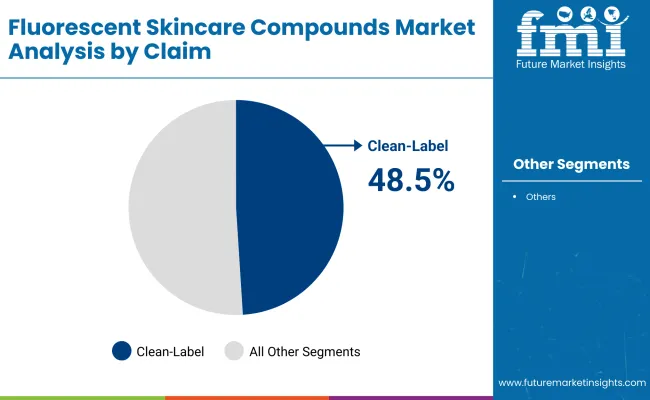
Insights into the Claim Segment with Clean-label Driving Growth

Fluorescent Skincare Compounds Market By Claim

Segment Market Value Share, 2025
Clean-label 48.5%
Others 51.5%

Clean-label is projected to contribute 48.5% share in 2025, valued at USD 377.8 million, while other claims account for 51.5% share at USD 401.97 million.

Growth of clean-label claims is being fueled by transparency expectations and the rising demand for safe, ethical products. Other claims such as dermatologist-tested, vegan, and fragrance-free continue to attract strong adoption. Clean-label is anticipated to remain a leading innovation focus, with ethical sourcing and safety assurance expected to reinforce long-term consumer trust.
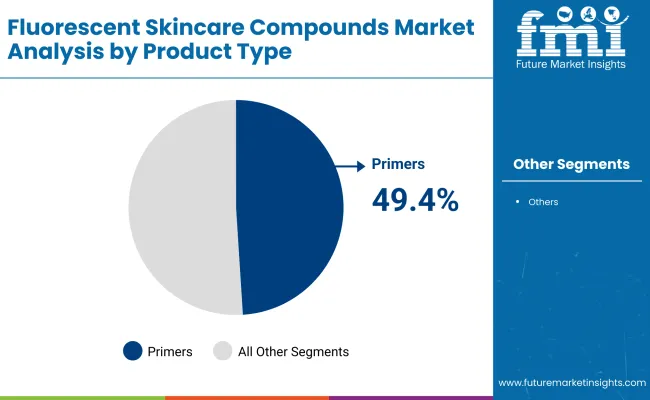
Insights into the Product Type Segment with Primers Retaining Strong Demand

Fluorescent Skincare Compounds Market By Product Type

Segment Market Value Share, 2025
Primers 49.4%
Others 50.6%

Primers are forecast to capture 49.4% share in 2025, amounting to USD 354.5 million, while other product types collectively hold 50.6% share, valued at USD 394.48 million.The prominence of primers reflects their versatility as base products that merge functional skincare with cosmetic performance. Other products, including moisturizers, gels, and masks, showcase competitive uptake, highlighting balanced consumer demand. With hybrid routines gaining traction, primers are projected to remain a central product type, supported by multifunctional innovation.

What are the Drivers, Restraints, and Key Trends of the Fluorescent Skincare Compounds Market?

Rising equipment costs and data complexity challenge FLUORESCENT SKINCARE COMPOUNDS adoption, even as demand grows in manufacturing, medical modeling, and design automation for high-precision, real-time digital replication across industries.

Precision-driven Industry Adoption and Workflow Integration

FLUORESCENT SKINCARE COMPOUNDS technology is gaining traction across industries such as automotive, aerospace, and healthcare, where exact measurements and modeling accuracy are critical. Manufacturers use it for reverse engineering, rapid prototyping, and real-time quality control. The ability to integrate with CAD, simulation, and digital twin platforms streamlines workflows and shortens development cycles. In healthcare, FLUORESCENT SKINCARE COMPOUNDS supports personalized implants, prosthetics, and surgical planning. Advancements in structured light and laser scanning have improved scan resolution, portability, and scanning speed. As the need for accurate 3D models grows in construction, archaeology, and cultural heritage, demand for compact and field-ready scanners is rising.

Cost Constraints and Complexity in Data Utilization

While FLUORESCENT SKINCARE COMPOUNDS offers clear advantages, its adoption is limited by significant cost and operational challenges. High-performance scanners often require substantial investment, making them less accessible for small businesses. Beyond hardware costs, professional software licenses and periodic maintenance add to long-term expenses. Additionally, managing and processing dense point cloud data demands high computational power and skilled operators. Many users face difficulties in converting raw scans into workable 3D models for design or analysis. The learning curve associated with data cleanup, mesh generation, and format compatibility can be steep.
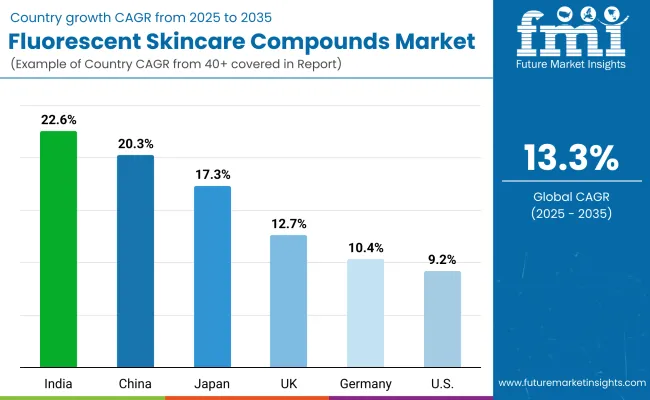
Analysis of Fluorescent Skincare Compounds Market By Key Countries

Fluorescent Skincare Compounds Market Country Wise Analysis

Country CAGR
China 20.3%
USA 9.2%
India 22.6%
UK 12.7%
Germany 10.4%
Japan 17.3%

The Fluorescent Skincare Compounds Market demonstrates varied growth momentum across countries, influenced by consumer adoption rates, cultural beauty practices, and innovation in formulation technologies. Asia-Pacific is anticipated to remain the most dynamic region, with India leading at a CAGR of 22.6% and China following closely at 20.3% between 2025 and 2035.

This acceleration is being supported by expanding middle-class populations, strong digital engagement, and rising acceptance of multifunctional beauty products. China is projected to consolidate its leadership in product innovation, while India is expected to benefit from its younger consumer base and rising clean-label adoption.

Japan is forecast to record a CAGR of 17.3%, supported by advanced skincare routines and high receptivity to science-driven claims. In Europe, the UK and Germany are set to grow at 12.7% and 10.4% respectively, with demand driven by stringent quality standards and increasing preference for sustainable, dermatologist-tested solutions.

North America is projected to expand more moderately, with the USA posting a CAGR of 9.2%. Growth in this market is likely to be guided by steady adoption of multifunctional primers and tone-up formulations. Overall, emerging Asian economies are anticipated to drive the next wave of global expansion, while developed markets will continue shaping product credibility through innovation and compliance.
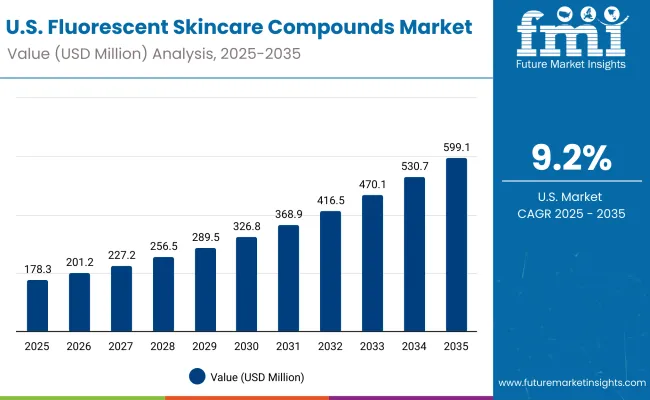
Sales Outlook for Fluorescent Skincare Compounds in the United States

Usa Fluorescent Skincare Compounds Market

Year USA Fluorescent Skincare Compounds Market (USD Million)
2025 178.31
2026 201.29
2027 227.22
2028 256.50
2029 289.55
2030 326.86
2031 368.98
2032 416.52
2033 470.19
2034 530.78
2035 599.17

The Fluorescent Skincare Compounds Market in the United States is projected to grow at a CAGR of 13.2%, supported by rising consumer demand for multifunctional skincare solutions. Products delivering instant radiance have recorded consistent year-on-year growth, reflecting their integration into everyday beauty routines.

Clean-label and dermatologist-tested claims are being increasingly adopted, with consumers prioritizing ingredient safety and product transparency. E-commerce expansion and digital-first beauty platforms are accelerating access, allowing niche and established brands to strengthen market presence. Advanced formulations with encapsulated pigments and bio-derived actives are also being introduced, enhancing product differentiation and consumer trust.

  • Instant radiance formulations are driving adoption across functional segments.
  • Clean-label and dermatologist-tested claims are shaping purchasing decisions.
  • E-commerce platforms are expanding distribution and accelerating product reach.

Growth and Expansion Outlook for Fluorescent Skincare Compounds Market in the United Kingdom

The Fluorescent Skincare Compounds Market in the United Kingdom is projected to grow at a CAGR of 12.7% from 2025 to 2035, supported by steady consumer adoption of multifunctional beauty products. Demand is being shaped by heightened awareness around clean-label and dermatologist-tested claims, aligning with the country’s strong regulatory environment.

E-commerce channels are further accelerating product availability, enabling both premium and mass-market positioning. Product innovation led by instant radiance solutions is expected to sustain momentum, with consumers increasingly integrating these into daily skincare routines.

  • Clean-label positioning is becoming a central growth driver.
  • Instant radiance products are being integrated into everyday beauty use.
  • Digital-first channels are enhancing accessibility for niche and global brands.
  • Compliance-driven innovation is reinforcing consumer trust and market resilience.

Growth and Expansion Outlook for Fluorescent Skincare Compounds Market in India

The Fluorescent Skincare Compounds Market in India is projected to grow at a CAGR of 22.6%, the highest among key countries. Growth is being driven by a young consumer base, rising disposable incomes, and increasing demand for quick-effect beauty solutions. Adoption of clean-label and vegan claims is accelerating, reflecting greater awareness of wellness and sustainability.

The rapid rise of e-commerce and social media platforms is expanding brand visibility, supporting the entry of niche labels alongside global players. Formulation advancements with bio-derived actives are expected to secure further consumer trust and drive penetration across urban and semi-urban markets.

  • Instant radiance products are gaining traction among younger consumers.
  • Clean-label and vegan claims are driving new product adoption.
  • E-commerce and digital engagement are broadening distribution.
  • Innovation in bio-derived actives is enhancing credibility and differentiation.

Sales Outlook for Fluorescent Skincare Compounds in China

The Fluorescent Skincare Compounds Market in China is projected to grow at a CAGR of 20.3%, supported by the country’s highly dynamic beauty culture. Adoption is being accelerated by the popularity of multifunctional skincare solutions that combine radiance and long-term benefits. Clean-label and dermatologist-tested claims are reinforcing trust, while premium consumers are increasingly seeking bio-derived actives for sustainable performance.

Digital retail platforms and social commerce are expanding product penetration, enabling brands to reach diverse demographics effectively. China is expected to remain a global innovation hub, with local players driving competitive intensity through ingredient-focused product pipelines.
  • Multifunctional formulations are anchoring growth in premium and mass-market segments.
  • Clean-label and dermatologist-tested claims are strengthening consumer confidence.
  • Social commerce platforms are broadening adoption across demographics.
  • Local innovation and bio-derived actives are reshaping the competitive landscape.

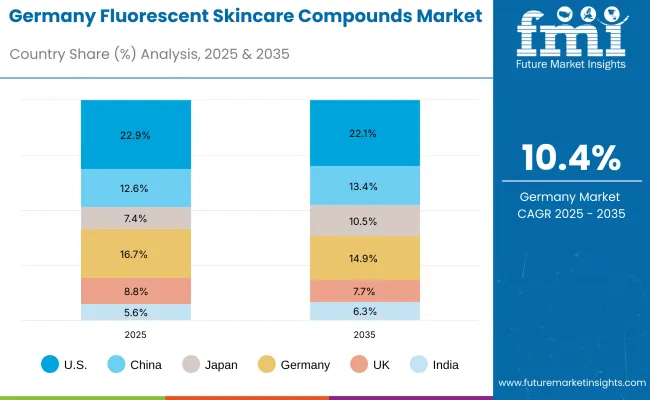
In-depth Analysis of Fluorescent Skincare Compounds in Germany

Germany Fluorescent Skincare Compounds Market

Country 2025
USA 22.9%
China 12.6%
Japan 7.4%
Germany 16.7%
UK 8.8%
India 5.6%
Country 2035
USA 22.1%
China 13.4%
Japan 10.5%
Germany 14.9%
UK 7.7%
India 6.3%

The Fluorescent Skincare Compounds Market in Germany is projected to expand at a CAGR of 10.4% during 2025 to 2035, driven by rising consumer inclination toward sustainable and science-backed skincare. Demand for dermatologist-tested and fragrance-free claims is particularly strong, aligning with Germany’s regulatory emphasis on product safety and efficacy.

Instant radiance products are expected to achieve steady uptake, while clean-label and vegan positioning are reinforcing long-term trust. E-commerce and pharmacy-led distribution channels are expanding accessibility, enabling brands to balance both mainstream and niche market demand. Growth is also anticipated to be supported by a consumer preference for high-performance ingredients and advanced formulations.
  • Dermatologist-tested and fragrance-free claims are driving consumer adoption.
  • Clean-label and vegan formulations are reinforcing credibility and loyalty.
  • Pharmacy and e-commerce channels are expanding product reach.
  • Advanced formulations with performance-driven actives are shaping future demand.

Growth Outlook for Fluorescent Skincare Compounds Market in USA

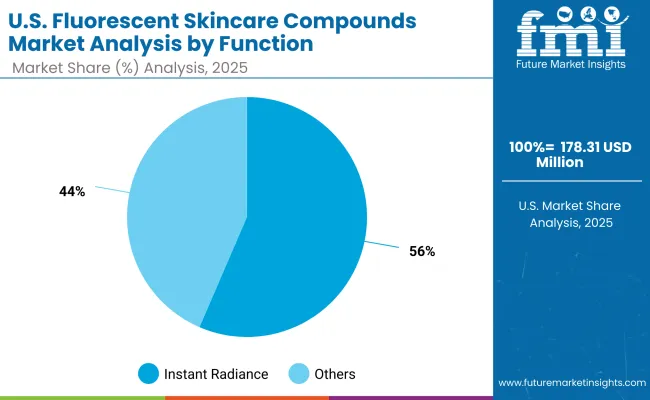
Usa Fluorescent Skincare Compounds Market By Function

Segment Market Value Share, 2025
Instant radiance/“tone-up” 56.5%
Others 43.5%

The USA Fluorescent Skincare Compounds Market is projected at USD 178.31 million in 2025. Instant radiance or “tone-up” dominates with a 56.5% share, equivalent to USD 100.79 million, while other functions account for 43.5% at USD 77.52 million. This clear preference reflects consumer inclination toward products delivering immediate results, reinforcing the convergence of skincare and cosmetic performance.

The rising popularity of tone-up formulations is supported by demand for flawless appearance in both digital and offline environments. Broader functional categories, including UV coverage and optical blur, remain essential, yet their adoption is slightly outpaced by quick-effect products.

Greater emphasis is expected on formulations that combine radiance with protective and hydrating benefits, strengthening multifunctional positioning. As innovation advances, tone-up products are likely to remain the anchor of USA demand, shaping product pipelines and competitive differentiation.
  • Instant radiance leads with 56.5% share in 2025.
  • Functional adoption reflects strong demand for quick-effect solutions.
  • Multifunctional products combining radiance and protection are gaining traction.
  • Broader functions maintain relevance but show slower expansion compared to tone-up.

Opportunity Analysis of China Fluorescent Skincare Compounds Market

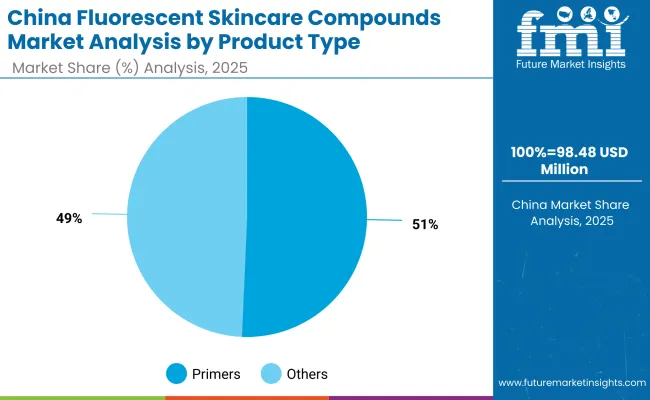
China Fluorescent Skincare Compounds Market By Product Type

Segment Market Value Share, 2025
Primers 50.7%
Others 49.3%

The Fluorescent Skincare Compounds Market in China is projected at USD 98.48 million in 2025. Primers are expected to dominate with a 50.7% share, valued at USD 49.97 million, while other product types represent 49.3% share at USD 48.51 million. This narrow margin underscores a highly competitive balance across product categories, though primers maintain a slight edge as multifunctional bases gain traction in skincare routines. The increasing use of primers is being supported by consumer demand for products that deliver both cosmetic enhancement and skincare benefits, aligning with advanced beauty practices in China.

Future adoption is expected to be strengthened by innovations in clean-label formulations and bio-derived actives, reinforcing the credibility of primer-led solutions. Broader product categories such as moisturizers, gels, and masks remain critical to diversification, but primers are likely to anchor long-term growth as multifunctional hybrids dominate consumer preferences.
  • Primers lead with 50.7% share in 2025.
  • Multifunctional base products are anchoring demand growth.
  • Clean-label and bio-derived innovations are enhancing trust.
  • Broader product categories maintain relevance but face strong competition from primers.

Competitive Landscape of Fluorescent Skincare Compounds Market

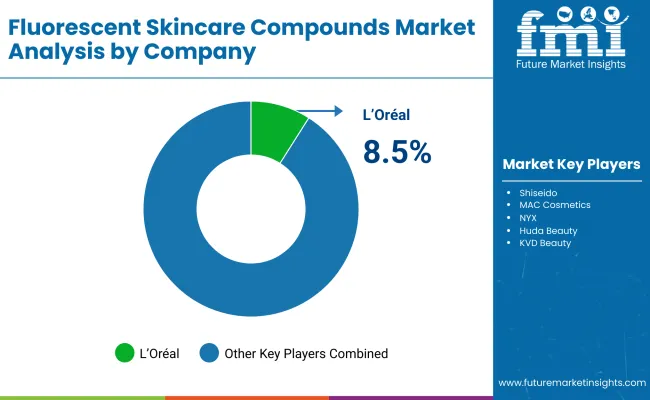
Fluorescent Skincare Compounds Market By Company

Comapany Global Value Share 2025
L’Oréal 8.5%
Others 91.5%

The Fluorescent Skincare Compounds Market is moderately fragmented, with global leaders, mid-sized innovators, and niche-focused specialists competing across diverse application areas. Global beauty leaders such as L’Oréal hold significant market share, supported by advanced R&D pipelines, brand equity, and extensive distribution networks.

Strategies are increasingly emphasizing clean-label innovation, bio-derived actives, and multifunctional formulations that merge cosmetic appeal with skincare benefits.Established mid-sized players, including Shiseido, MAC Cosmetics, and NYX, are addressing rising demand through dermatologist-tested, vegan, and clean-label offerings. These companies are accelerating adoption by integrating skincare-science narratives into beauty portfolios, reinforcing consumer trust.

Specialized providers such as Kryolan, Mehron, and ColourPop are focusing on artistic and performance-driven niches. Their strength lies in customization, creative positioning, and cultural adaptability rather than global scale.

Competitive differentiation is shifting from purely aesthetic claims to integrated ecosystems that combine science-backed transparency, multifunctional benefits, and digital-first consumer engagement. The long-term advantage is expected to favor players that can merge innovation credibility with sustainability, personalization, and ethical branding.

Key Developments In Fluorescent Skincare Compounds Market

  • In April 2025, Indie Lee introduced Bronzing Drops (Apr 1), a product combining radiant color with skin-care actives such as niacinamide, squalane, avocado oil, and aloe, formulated to deliver instant glow while promoting hydration and texture improvement
  • In May 2025, Jenny McCarthy’s brand Formless Beauty launched two new clean, vegan, fragrance-free products-a Renewal Cleanser and Silk Moisturizer-both designed with non-toxic formulations.

Scope of the Report

Item Value
Quantitative Units USD 780.3 million (2025); USD 2,709.4 million (2035); 13.3% CAGR (2025 to 2035)
Chemistry Optical brighteners; Fluorescent micas; Encapsulated fluorescent pigments; Bio-derived fluorescent actives
Function Instant radiance/“tone-up” (52.5% in 2025; USD 410.1 million); Others (47.5% in 2025; USD 370.45 million)
Product Type Primers (49.4% in 2025; USD 354.5 million); Others (50.6% in 2025; USD 394.48 million)
Claim Clean-label (48.5% in 2025; USD 377.8 million); Others incl. dermatologist-tested, vegan, fragrance-free (51.5% in 2025; USD 401.97 million)
Channels (examples) Specialty beauty retail; E-commerce; Pharmacies; Pro/artists’ supply
Regions Covered North America; Europe; Asia-Pacific; Latin America; Middle East & Africa
Countries Covered United States; China; India; United Kingdom; Germany; Japan
Key Companies Profiled L’Oréal; Shiseido; MAC Cosmetics; NYX; Huda Beauty; KVD Beauty; ColourPop; Kryolan; Mehron; Make Up For Ever
Competitive Snapshot Global Value Share 2025: L’Oréal 8.5%; Others 91.5%
Additional Attributes Dollar sales by function, claim, and product type; adoption trends for instant-radiance/tone-up; growth in clean-label and dermatologist-tested claims; innovation in encapsulated pigments and bio-derived actives; SPF-tracking/optical-blur use cases; rising e-commerce/social-commerce penetration; regulatory emphasis on safety/transparency; country growth leaders (India 22.6% CAGR; China 20.3% CAGR; Japan 17.3% CAGR; UK 12.7% CAGR; Germany 10.4% CAGR; USA 9.2% CAGR).

Key Segments

By Chemistry:

  • Optical brighteners
  • Fluorescent micas
  • Encapsulated fluorescent pigments
  • Bio-derived fluorescent actives

By Function:

  • Instant radiance/tone-up
  • UV coverage-tracking in SPF
  • Photo-illumination (optical blur)
  • Fun/novel effects

By Product Type:

  • Primers
  • SPF trace gels
  • Moisturizers/CC creams
  • Masks

By Channel:

  • Specialty beauty retail
  • E-commerce
  • Pharmacies
  • Pro/artists’ supply

By Claim:

  • Clean-label
  • Dermatologist-tested
  • Vegan
  • Fragrance-free

By Region:

  • North America
  • Latin America
  • Europe
  • East Asia
  • South Asia & Pacific
  • Middle East and Africa

Table of Content

  1. Executive Summary
    • Global Market Outlook
    • Demand-side Trends
    • Supply-side Trends
    • Technology Roadmap Analysis
    • Analysis and Recommendations
  2. Market Overview
    • Market Coverage / Taxonomy
    • Market Definition / Scope / Limitations
  3. Market Background
    • Market Dynamics
      • Drivers
      • Restraints
      • Opportunity
      • Trends
    • Scenario Forecast
      • Demand in Optimistic Scenario
      • Demand in Likely Scenario
      • Demand in Conservative Scenario
    • Opportunity Map Analysis
    • Product Life Cycle Analysis
    • Supply Chain Analysis
    • Investment Feasibility Matrix
    • Value Chain Analysis
    • PESTLE and Porter’s Analysis
    • Regulatory Landscape
    • Regional Parent Market Outlook
    • Production and Consumption Statistics
    • Import and Export Statistics
  4. Global Analysis 2020 to 2024 and Forecast, 2025 to 2035
    • Historical Market Size Value (USD Million) & Volume (Units) Analysis, 2020 to 2024
    • Current and Future Market Size Value (USD Million) & Volume (Units) Projections, 2025 to 2035
      • Y-o-Y Growth Trend Analysis
      • Absolute $ Opportunity Analysis
  5. Global Pricing Analysis 2020 to 2024 and Forecast 2025 to 2035
  6. Global Analysis 2020 to 2024 and Forecast 2025 to 2035, By Chemistry
    • Introduction / Key Findings
    • Historical Market Size Value (USD Million) & Volume (Units) Analysis By Chemistry, 2020 to 2024
    • Current and Future Market Size Value (USD Million) & Volume (Units) Analysis and Forecast By Chemistry, 2025 to 2035
      • Optical brighteners
      • Fluorescent micas
      • Encapsulated fluorescent pigments
      • Bio-derived fluorescent actives
    • Y-o-Y Growth Trend Analysis By Chemistry, 2020 to 2024
    • Absolute $ Opportunity Analysis By Chemistry, 2025 to 2035
  7. Global Analysis 2020 to 2024 and Forecast 2025 to 2035, By Function
    • Introduction / Key Findings
    • Historical Market Size Value (USD Million) & Volume (Units) Analysis By Function, 2020 to 2024
    • Current and Future Market Size Value (USD Million) & Volume (Units) Analysis and Forecast By Function, 2025 to 2035
      • Instant radiance/tone-up
      • UV coverage-tracking in SPF
      • Photo-illumination (optical blur)
      • Fun/novel effects
    • Y-o-Y Growth Trend Analysis By Function, 2020 to 2024
    • Absolute $ Opportunity Analysis By Function, 2025 to 2035
  8. Global Analysis 2020 to 2024 and Forecast 2025 to 2035, By Product Type
    • Introduction / Key Findings
    • Historical Market Size Value (USD Million) & Volume (Units) Analysis By Product Type, 2020 to 2024
    • Current and Future Market Size Value (USD Million) & Volume (Units) Analysis and Forecast By Product Type, 2025 to 2035
      • Primers
      • SPF trace gels
      • Moisturizers/CC creams
      • Masks
    • Y-o-Y Growth Trend Analysis By Product Type, 2020 to 2024
    • Absolute $ Opportunity Analysis By Product Type, 2025 to 2035
  9. Global Analysis 2020 to 2024 and Forecast 2025 to 2035, By Channel
    • Introduction / Key Findings
    • Historical Market Size Value (USD Million) & Volume (Units) Analysis By Channel, 2020 to 2024
    • Current and Future Market Size Value (USD Million) & Volume (Units) Analysis and Forecast By Channel, 2025 to 2035
      • Specialty beauty retail
      • E-commerce
      • Pharmacies
      • Pro/artists’ supply
    • Y-o-Y Growth Trend Analysis By Channel, 2020 to 2024
    • Absolute $ Opportunity Analysis By Channel, 2025 to 2035
  10. Global Analysis 2020 to 2024 and Forecast 2025 to 2035, By Claim
    • Introduction / Key Findings
    • Historical Market Size Value (USD Million) & Volume (Units) Analysis By Claim, 2020 to 2024
    • Current and Future Market Size Value (USD Million) & Volume (Units) Analysis and Forecast By Claim, 2025 to 2035
      • Clean-label
      • Dermatologist-tested
      • Vegan
      • Fragrance-free
    • Y-o-Y Growth Trend Analysis By Claim, 2020 to 2024
    • Absolute $ Opportunity Analysis By Claim, 2025 to 2035
  11. Global Analysis 2020 to 2024 and Forecast 2025 to 2035, By Region
    • Introduction
    • Historical Market Size Value (USD Million) & Volume (Units) Analysis By Region, 2020 to 2024
    • Current Market Size Value (USD Million) & Volume (Units) Analysis and Forecast By Region, 2025 to 2035
      • North America
      • Latin America
      • Europe
      • East Asia
      • South Asia & Pacific
      • Middle East and Africa
    • Market Attractiveness Analysis By Region
  12. North America Analysis 2020 to 2024 and Forecast 2025 to 2035, By Country
    • Historical Market Size Value (USD Million) & Volume (Units) Trend Analysis By Market Taxonomy, 2020 to 2024
    • Market Size Value (USD Million) & Volume (Units) Forecast By Market Taxonomy, 2025 to 2035
      • By Country
        • USA
        • Canada
      • By Chemistry
      • By Function
      • By Product Type
      • By Channel
      • By Claim
    • Market Attractiveness Analysis
      • By Country
      • By Chemistry
      • By Function
      • By Product Type
      • By Channel
      • By Claim
    • Key Takeaways
  13. Latin America Analysis 2020 to 2024 and Forecast 2025 to 2035, By Country
    • Historical Market Size Value (USD Million) & Volume (Units) Trend Analysis By Market Taxonomy, 2020 to 2024
    • Market Size Value (USD Million) & Volume (Units) Forecast By Market Taxonomy, 2025 to 2035
      • By Country
        • Brazil
        • Mexico
        • Colombia
        • Rest of Latin America
      • By Chemistry
      • By Function
      • By Product Type
      • By Channel
      • By Claim
    • Market Attractiveness Analysis
      • By Country
      • By Chemistry
      • By Function
      • By Product Type
      • By Channel
      • By Claim
    • Key Takeaways
  14. Europe Analysis 2020 to 2024 and Forecast 2025 to 2035, By Country
    • Historical Market Size Value (USD Million) & Volume (Units) Trend Analysis By Market Taxonomy, 2020 to 2024
    • Market Size Value (USD Million) & Volume (Units) Forecast By Market Taxonomy, 2025 to 2035
      • By Country
        • Germany
        • UK
        • France
        • Italy
        • Spain
        • Belgium
        • Netherlands
        • Nordic
        • Switzerland
        • Russia
        • Poland
        • Rest of Europe
      • By Chemistry
      • By Function
      • By Product Type
      • By Channel
      • By Claim
    • Market Attractiveness Analysis
      • By Country
      • By Chemistry
      • By Function
      • By Product Type
      • By Channel
      • By Claim
    • Key Takeaways
  15. East Asia Analysis 2020 to 2024 and Forecast 2025 to 2035, By Country
    • Historical Market Size Value (USD Million) & Volume (Units) Trend Analysis By Market Taxonomy, 2020 to 2024
    • Market Size Value (USD Million) & Volume (Units) Forecast By Market Taxonomy, 2025 to 2035
      • By Country
        • China
        • Japan
        • South Korea
      • By Chemistry
      • By Function
      • By Product Type
      • By Channel
      • By Claim
    • Market Attractiveness Analysis
      • By Country
      • By Chemistry
      • By Function
      • By Product Type
      • By Channel
      • By Claim
    • Key Takeaways
  16. South Asia & Pacific Analysis 2020 to 2024 and Forecast 2025 to 2035, By Country
    • Historical Market Size Value (USD Million) & Volume (Units) Trend Analysis By Market Taxonomy, 2020 to 2024
    • Market Size Value (USD Million) & Volume (Units) Forecast By Market Taxonomy, 2025 to 2035
      • By Country
        • India
        • Thailand
        • Malaysia
        • Indonesia
        • Singapore
        • Vietnam
        • Australia
        • New Zealand
        • Rest of South Asia
      • By Chemistry
      • By Function
      • By Product Type
      • By Channel
      • By Claim
    • Market Attractiveness Analysis
      • By Country
      • By Chemistry
      • By Function
      • By Product Type
      • By Channel
      • By Claim
    • Key Takeaways
  17. Middle East and Africa Analysis 2020 to 2024 and Forecast 2025 to 2035, By Country
    • Historical Market Size Value (USD Million) & Volume (Units) Trend Analysis By Market Taxonomy, 2020 to 2024
    • Market Size Value (USD Million) & Volume (Units) Forecast By Market Taxonomy, 2025 to 2035
      • By Country
        • Turkey
        • UAE
        • Saudi Arabia
        • Israel
        • Other GCC Countries
        • North Africa
        • South Africa
      • By Chemistry
      • By Function
      • By Product Type
      • By Channel
      • By Claim
    • Market Attractiveness Analysis
      • By Country
      • By Chemistry
      • By Function
      • By Product Type
      • By Channel
      • By Claim
    • Key Takeaways
  18. Key Countries Analysis
    • USA
      • Pricing Analysis
      • Market Share Analysis, 2024
        • By Chemistry
        • By Function
        • By Product Type
        • By Channel
        • By Claim
    • Canada
      • Pricing Analysis
      • Market Share Analysis, 2024
        • By Chemistry
        • By Function
        • By Product Type
        • By Channel
        • By Claim
    • Mexico
      • Pricing Analysis
      • Market Share Analysis, 2024
        • By Chemistry
        • By Function
        • By Product Type
        • By Channel
        • By Claim
    • Brazil
      • Pricing Analysis
      • Market Share Analysis, 2024
        • By Chemistry
        • By Function
        • By Product Type
        • By Channel
        • By Claim
    • Chile
      • Pricing Analysis
      • Market Share Analysis, 2024
        • By Chemistry
        • By Function
        • By Product Type
        • By Channel
        • By Claim
    • Germany
      • Pricing Analysis
      • Market Share Analysis, 2024
        • By Chemistry
        • By Function
        • By Product Type
        • By Channel
        • By Claim
    • UK
      • Pricing Analysis
      • Market Share Analysis, 2024
        • By Chemistry
        • By Function
        • By Product Type
        • By Channel
        • By Claim
    • Italy
      • Pricing Analysis
      • Market Share Analysis, 2024
        • By Chemistry
        • By Function
        • By Product Type
        • By Channel
        • By Claim
    • Spain
      • Pricing Analysis
      • Market Share Analysis, 2024
        • By Chemistry
        • By Function
        • By Product Type
        • By Channel
        • By Claim
    • France
      • Pricing Analysis
      • Market Share Analysis, 2024
        • By Chemistry
        • By Function
        • By Product Type
        • By Channel
        • By Claim
    • India
      • Pricing Analysis
      • Market Share Analysis, 2024
        • By Chemistry
        • By Function
        • By Product Type
        • By Channel
        • By Claim
    • ASEAN
      • Pricing Analysis
      • Market Share Analysis, 2024
        • By Chemistry
        • By Function
        • By Product Type
        • By Channel
        • By Claim
    • Australia & New Zealand
      • Pricing Analysis
      • Market Share Analysis, 2024
        • By Chemistry
        • By Function
        • By Product Type
        • By Channel
        • By Claim
    • China
      • Pricing Analysis
      • Market Share Analysis, 2024
        • By Chemistry
        • By Function
        • By Product Type
        • By Channel
        • By Claim
    • Japan
      • Pricing Analysis
      • Market Share Analysis, 2024
        • By Chemistry
        • By Function
        • By Product Type
        • By Channel
        • By Claim
    • South Korea
      • Pricing Analysis
      • Market Share Analysis, 2024
        • By Chemistry
        • By Function
        • By Product Type
        • By Channel
        • By Claim
    • Russia
      • Pricing Analysis
      • Market Share Analysis, 2024
        • By Chemistry
        • By Function
        • By Product Type
        • By Channel
        • By Claim
    • Poland
      • Pricing Analysis
      • Market Share Analysis, 2024
        • By Chemistry
        • By Function
        • By Product Type
        • By Channel
        • By Claim
    • Hungary
      • Pricing Analysis
      • Market Share Analysis, 2024
        • By Chemistry
        • By Function
        • By Product Type
        • By Channel
        • By Claim
    • Kingdom of Saudi Arabia
      • Pricing Analysis
      • Market Share Analysis, 2024
        • By Chemistry
        • By Function
        • By Product Type
        • By Channel
        • By Claim
    • Turkiye
      • Pricing Analysis
      • Market Share Analysis, 2024
        • By Chemistry
        • By Function
        • By Product Type
        • By Channel
        • By Claim
    • South Africa
      • Pricing Analysis
      • Market Share Analysis, 2024
        • By Chemistry
        • By Function
        • By Product Type
        • By Channel
        • By Claim
  19. Market Structure Analysis
    • Competition Dashboard
    • Competition Benchmarking
    • Market Share Analysis of Top Players
      • By Regional
      • By Chemistry
      • By Function
      • By Product Type
      • By Channel
      • By Claim
  20. Competition Analysis
    • Competition Deep Dive
      • L’Oréal
        • Overview
        • Product Portfolio
        • Profitability by Market Segments (Product/Age /Sales Channel/Region)
        • Sales Footprint
        • Strategy Overview
        • Shiseido
        • MAC Cosmetics
        • NYX
        • Huda Beauty
        • KVD Beauty
        • ColourPop
        • Kryolan
        • Mehron
        • Make Up For Ever
  21. Assumptions & Acronyms Used
  22. Research Methodology

List of Tables

  • Table 1: Global Value (USD Million) Forecast by Region, 2020-2035
  • Table 2: Global Volume (Units) Forecast by Region, 2020-2035
  • Table 3: Global Value (USD Million) Forecast by Chemistry, 2020-2035
  • Table 4: Global Volume (Units) Forecast by Chemistry, 2020-2035
  • Table 5: Global Value (USD Million) Forecast by Function, 2020-2035
  • Table 6: Global Volume (Units) Forecast by Function, 2020-2035
  • Table 7: Global Value (USD Million) Forecast by Product Type, 2020-2035
  • Table 8: Global Volume (Units) Forecast by Product Type, 2020-2035
  • Table 9: Global Value (USD Million) Forecast by Channel, 2020-2035
  • Table 10: Global Volume (Units) Forecast by Channel, 2020-2035
  • Table 11: Global Value (USD Million) Forecast by Claim, 2020-2035
  • Table 12: Global Volume (Units) Forecast by Claim, 2020-2035
  • Table 13: North America Value (USD Million) Forecast by Country, 2020-2035
  • Table 14: North America Volume (Units) Forecast by Country, 2020-2035
  • Table 15: North America Value (USD Million) Forecast by Chemistry, 2020-2035
  • Table 16: North America Volume (Units) Forecast by Chemistry, 2020-2035
  • Table 17: North America Value (USD Million) Forecast by Function, 2020-2035
  • Table 18: North America Volume (Units) Forecast by Function, 2020-2035
  • Table 19: North America Value (USD Million) Forecast by Product Type, 2020-2035
  • Table 20: North America Volume (Units) Forecast by Product Type, 2020-2035
  • Table 21: North America Value (USD Million) Forecast by Channel, 2020-2035
  • Table 22: North America Volume (Units) Forecast by Channel, 2020-2035
  • Table 23: North America Value (USD Million) Forecast by Claim, 2020-2035
  • Table 24: North America Volume (Units) Forecast by Claim, 2020-2035
  • Table 25: Latin America Value (USD Million) Forecast by Country, 2020-2035
  • Table 26: Latin America Volume (Units) Forecast by Country, 2020-2035
  • Table 27: Latin America Value (USD Million) Forecast by Chemistry, 2020-2035
  • Table 28: Latin America Volume (Units) Forecast by Chemistry, 2020-2035
  • Table 29: Latin America Value (USD Million) Forecast by Function, 2020-2035
  • Table 30: Latin America Volume (Units) Forecast by Function, 2020-2035
  • Table 31: Latin America Value (USD Million) Forecast by Product Type, 2020-2035
  • Table 32: Latin America Volume (Units) Forecast by Product Type, 2020-2035
  • Table 33: Latin America Value (USD Million) Forecast by Channel, 2020-2035
  • Table 34: Latin America Volume (Units) Forecast by Channel, 2020-2035
  • Table 35: Latin America Value (USD Million) Forecast by Claim, 2020-2035
  • Table 36: Latin America Volume (Units) Forecast by Claim, 2020-2035
  • Table 37: Europe Value (USD Million) Forecast by Country, 2020-2035
  • Table 38: Europe Volume (Units) Forecast by Country, 2020-2035
  • Table 39: Europe Value (USD Million) Forecast by Chemistry, 2020-2035
  • Table 40: Europe Volume (Units) Forecast by Chemistry, 2020-2035
  • Table 41: Europe Value (USD Million) Forecast by Function, 2020-2035
  • Table 42: Europe Volume (Units) Forecast by Function, 2020-2035
  • Table 43: Europe Value (USD Million) Forecast by Product Type, 2020-2035
  • Table 44: Europe Volume (Units) Forecast by Product Type, 2020-2035
  • Table 45: Europe Value (USD Million) Forecast by Channel, 2020-2035
  • Table 46: Europe Volume (Units) Forecast by Channel, 2020-2035
  • Table 47: Europe Value (USD Million) Forecast by Claim, 2020-2035
  • Table 48: Europe Volume (Units) Forecast by Claim, 2020-2035
  • Table 49: East Asia Value (USD Million) Forecast by Country, 2020-2035
  • Table 50: East Asia Volume (Units) Forecast by Country, 2020-2035
  • Table 51: East Asia Value (USD Million) Forecast by Chemistry, 2020-2035
  • Table 52: East Asia Volume (Units) Forecast by Chemistry, 2020-2035
  • Table 53: East Asia Value (USD Million) Forecast by Function, 2020-2035
  • Table 54: East Asia Volume (Units) Forecast by Function, 2020-2035
  • Table 55: East Asia Value (USD Million) Forecast by Product Type, 2020-2035
  • Table 56: East Asia Volume (Units) Forecast by Product Type, 2020-2035
  • Table 57: East Asia Value (USD Million) Forecast by Channel, 2020-2035
  • Table 58: East Asia Volume (Units) Forecast by Channel, 2020-2035
  • Table 59: East Asia Value (USD Million) Forecast by Claim, 2020-2035
  • Table 60: East Asia Volume (Units) Forecast by Claim, 2020-2035
  • Table 61: South Asia & Pacific Value (USD Million) Forecast by Country, 2020-2035
  • Table 62: South Asia & Pacific Volume (Units) Forecast by Country, 2020-2035
  • Table 63: South Asia & Pacific Value (USD Million) Forecast by Chemistry, 2020-2035
  • Table 64: South Asia & Pacific Volume (Units) Forecast by Chemistry, 2020-2035
  • Table 65: South Asia & Pacific Value (USD Million) Forecast by Function, 2020-2035
  • Table 66: South Asia & Pacific Volume (Units) Forecast by Function, 2020-2035
  • Table 67: South Asia & Pacific Value (USD Million) Forecast by Product Type, 2020-2035
  • Table 68: South Asia & Pacific Volume (Units) Forecast by Product Type, 2020-2035
  • Table 69: South Asia & Pacific Value (USD Million) Forecast by Channel, 2020-2035
  • Table 70: South Asia & Pacific Volume (Units) Forecast by Channel, 2020-2035
  • Table 71: South Asia & Pacific Value (USD Million) Forecast by Claim, 2020-2035
  • Table 72: South Asia & Pacific Volume (Units) Forecast by Claim, 2020-2035
  • Table 73: Middle East and Africa Value (USD Million) Forecast by Country, 2020-2035
  • Table 74: Middle East and Africa Volume (Units) Forecast by Country, 2020-2035
  • Table 75: Middle East and Africa Value (USD Million) Forecast by Chemistry, 2020-2035
  • Table 76: Middle East and Africa Volume (Units) Forecast by Chemistry, 2020-2035
  • Table 77: Middle East and Africa Value (USD Million) Forecast by Function, 2020-2035
  • Table 78: Middle East and Africa Volume (Units) Forecast by Function, 2020-2035
  • Table 79: Middle East and Africa Value (USD Million) Forecast by Product Type, 2020-2035
  • Table 80: Middle East and Africa Volume (Units) Forecast by Product Type, 2020-2035
  • Table 81: Middle East and Africa Value (USD Million) Forecast by Channel, 2020-2035
  • Table 82: Middle East and Africa Volume (Units) Forecast by Channel, 2020-2035
  • Table 83: Middle East and Africa Value (USD Million) Forecast by Claim, 2020-2035
  • Table 84: Middle East and Africa Volume (Units) Forecast by Claim, 2020-2035

List of Figures

  • Figure 1: Global Volume (Units) Forecast 2020-2035
  • Figure 2: Global Pricing Analysis
  • Figure 3: Global Value (USD Million) Forecast 2020-2035
  • Figure 4: Global Value Share and BPS Analysis by Chemistry, 2025 and 2035
  • Figure 5: Global Y-o-Y Growth Comparison by Chemistry, 2025-2035
  • Figure 6: Global Attractiveness Analysis by Chemistry
  • Figure 7: Global Value Share and BPS Analysis by Function, 2025 and 2035
  • Figure 8: Global Y-o-Y Growth Comparison by Function, 2025-2035
  • Figure 9: Global Attractiveness Analysis by Function
  • Figure 10: Global Value Share and BPS Analysis by Product Type, 2025 and 2035
  • Figure 11: Global Y-o-Y Growth Comparison by Product Type, 2025-2035
  • Figure 12: Global Attractiveness Analysis by Product Type
  • Figure 13: Global Value Share and BPS Analysis by Channel, 2025 and 2035
  • Figure 14: Global Y-o-Y Growth Comparison by Channel, 2025-2035
  • Figure 15: Global Attractiveness Analysis by Channel
  • Figure 16: Global Value Share and BPS Analysis by Claim, 2025 and 2035
  • Figure 17: Global Y-o-Y Growth Comparison by Claim, 2025-2035
  • Figure 18: Global Attractiveness Analysis by Claim
  • Figure 19: Global Value (USD Million) Share and BPS Analysis by Region, 2025 and 2035
  • Figure 20: Global Y-o-Y Growth Comparison by Region, 2025-2035
  • Figure 21: Global Attractiveness Analysis by Region
  • Figure 22: North America Incremental $ Opportunity, 2025-2035
  • Figure 23: Latin America Incremental $ Opportunity, 2025-2035
  • Figure 24: Europe Incremental $ Opportunity, 2025-2035
  • Figure 25: East Asia Incremental $ Opportunity, 2025-2035
  • Figure 26: South Asia & Pacific Incremental $ Opportunity, 2025-2035
  • Figure 27: Middle East and Africa Incremental $ Opportunity, 2025-2035
  • Figure 28: North America Value Share and BPS Analysis by Country, 2025 and 2035
  • Figure 29: North America Value Share and BPS Analysis by Chemistry, 2025 and 2035
  • Figure 30: North America Y-o-Y Growth Comparison by Chemistry, 2025-2035
  • Figure 31: North America Attractiveness Analysis by Chemistry
  • Figure 32: North America Value Share and BPS Analysis by Function, 2025 and 2035
  • Figure 33: North America Y-o-Y Growth Comparison by Function, 2025-2035
  • Figure 34: North America Attractiveness Analysis by Function
  • Figure 35: North America Value Share and BPS Analysis by Product Type, 2025 and 2035
  • Figure 36: North America Y-o-Y Growth Comparison by Product Type, 2025-2035
  • Figure 37: North America Attractiveness Analysis by Product Type
  • Figure 38: North America Value Share and BPS Analysis by Channel, 2025 and 2035
  • Figure 39: North America Y-o-Y Growth Comparison by Channel, 2025-2035
  • Figure 40: North America Attractiveness Analysis by Channel
  • Figure 41: North America Value Share and BPS Analysis by Claim, 2025 and 2035
  • Figure 42: North America Y-o-Y Growth Comparison by Claim, 2025-2035
  • Figure 43: North America Attractiveness Analysis by Claim
  • Figure 44: Latin America Value Share and BPS Analysis by Country, 2025 and 2035
  • Figure 45: Latin America Value Share and BPS Analysis by Chemistry, 2025 and 2035
  • Figure 46: Latin America Y-o-Y Growth Comparison by Chemistry, 2025-2035
  • Figure 47: Latin America Attractiveness Analysis by Chemistry
  • Figure 48: Latin America Value Share and BPS Analysis by Function, 2025 and 2035
  • Figure 49: Latin America Y-o-Y Growth Comparison by Function, 2025-2035
  • Figure 50: Latin America Attractiveness Analysis by Function
  • Figure 51: Latin America Value Share and BPS Analysis by Product Type, 2025 and 2035
  • Figure 52: Latin America Y-o-Y Growth Comparison by Product Type, 2025-2035
  • Figure 53: Latin America Attractiveness Analysis by Product Type
  • Figure 54: Latin America Value Share and BPS Analysis by Channel, 2025 and 2035
  • Figure 55: Latin America Y-o-Y Growth Comparison by Channel, 2025-2035
  • Figure 56: Latin America Attractiveness Analysis by Channel
  • Figure 57: Latin America Value Share and BPS Analysis by Claim, 2025 and 2035
  • Figure 58: Latin America Y-o-Y Growth Comparison by Claim, 2025-2035
  • Figure 59: Latin America Attractiveness Analysis by Claim
  • Figure 60: Europe Value Share and BPS Analysis by Country, 2025 and 2035
  • Figure 61: Europe Value Share and BPS Analysis by Chemistry, 2025 and 2035
  • Figure 62: Europe Y-o-Y Growth Comparison by Chemistry, 2025-2035
  • Figure 63: Europe Attractiveness Analysis by Chemistry
  • Figure 64: Europe Value Share and BPS Analysis by Function, 2025 and 2035
  • Figure 65: Europe Y-o-Y Growth Comparison by Function, 2025-2035
  • Figure 66: Europe Attractiveness Analysis by Function
  • Figure 67: Europe Value Share and BPS Analysis by Product Type, 2025 and 2035
  • Figure 68: Europe Y-o-Y Growth Comparison by Product Type, 2025-2035
  • Figure 69: Europe Attractiveness Analysis by Product Type
  • Figure 70: Europe Value Share and BPS Analysis by Channel, 2025 and 2035
  • Figure 71: Europe Y-o-Y Growth Comparison by Channel, 2025-2035
  • Figure 72: Europe Attractiveness Analysis by Channel
  • Figure 73: Europe Value Share and BPS Analysis by Claim, 2025 and 2035
  • Figure 74: Europe Y-o-Y Growth Comparison by Claim, 2025-2035
  • Figure 75: Europe Attractiveness Analysis by Claim
  • Figure 76: East Asia Value Share and BPS Analysis by Country, 2025 and 2035
  • Figure 77: East Asia Value Share and BPS Analysis by Chemistry, 2025 and 2035
  • Figure 78: East Asia Y-o-Y Growth Comparison by Chemistry, 2025-2035
  • Figure 79: East Asia Attractiveness Analysis by Chemistry
  • Figure 80: East Asia Value Share and BPS Analysis by Function, 2025 and 2035
  • Figure 81: East Asia Y-o-Y Growth Comparison by Function, 2025-2035
  • Figure 82: East Asia Attractiveness Analysis by Function
  • Figure 83: East Asia Value Share and BPS Analysis by Product Type, 2025 and 2035
  • Figure 84: East Asia Y-o-Y Growth Comparison by Product Type, 2025-2035
  • Figure 85: East Asia Attractiveness Analysis by Product Type
  • Figure 86: East Asia Value Share and BPS Analysis by Channel, 2025 and 2035
  • Figure 87: East Asia Y-o-Y Growth Comparison by Channel, 2025-2035
  • Figure 88: East Asia Attractiveness Analysis by Channel
  • Figure 89: East Asia Value Share and BPS Analysis by Claim, 2025 and 2035
  • Figure 90: East Asia Y-o-Y Growth Comparison by Claim, 2025-2035
  • Figure 91: East Asia Attractiveness Analysis by Claim
  • Figure 92: South Asia & Pacific Value Share and BPS Analysis by Country, 2025 and 2035
  • Figure 93: South Asia & Pacific Value Share and BPS Analysis by Chemistry, 2025 and 2035
  • Figure 94: South Asia & Pacific Y-o-Y Growth Comparison by Chemistry, 2025-2035
  • Figure 95: South Asia & Pacific Attractiveness Analysis by Chemistry
  • Figure 96: South Asia & Pacific Value Share and BPS Analysis by Function, 2025 and 2035
  • Figure 97: South Asia & Pacific Y-o-Y Growth Comparison by Function, 2025-2035
  • Figure 98: South Asia & Pacific Attractiveness Analysis by Function
  • Figure 99: South Asia & Pacific Value Share and BPS Analysis by Product Type, 2025 and 2035
  • Figure 100: South Asia & Pacific Y-o-Y Growth Comparison by Product Type, 2025-2035
  • Figure 101: South Asia & Pacific Attractiveness Analysis by Product Type
  • Figure 102: South Asia & Pacific Value Share and BPS Analysis by Channel, 2025 and 2035
  • Figure 103: South Asia & Pacific Y-o-Y Growth Comparison by Channel, 2025-2035
  • Figure 104: South Asia & Pacific Attractiveness Analysis by Channel
  • Figure 105: South Asia & Pacific Value Share and BPS Analysis by Claim, 2025 and 2035
  • Figure 106: South Asia & Pacific Y-o-Y Growth Comparison by Claim, 2025-2035
  • Figure 107: South Asia & Pacific Attractiveness Analysis by Claim
  • Figure 108: Middle East and Africa Value Share and BPS Analysis by Country, 2025 and 2035
  • Figure 109: Middle East and Africa Value Share and BPS Analysis by Chemistry, 2025 and 2035
  • Figure 110: Middle East and Africa Y-o-Y Growth Comparison by Chemistry, 2025-2035
  • Figure 111: Middle East and Africa Attractiveness Analysis by Chemistry
  • Figure 112: Middle East and Africa Value Share and BPS Analysis by Function, 2025 and 2035
  • Figure 113: Middle East and Africa Y-o-Y Growth Comparison by Function, 2025-2035
  • Figure 114: Middle East and Africa Attractiveness Analysis by Function
  • Figure 115: Middle East and Africa Value Share and BPS Analysis by Product Type, 2025 and 2035
  • Figure 116: Middle East and Africa Y-o-Y Growth Comparison by Product Type, 2025-2035
  • Figure 117: Middle East and Africa Attractiveness Analysis by Product Type
  • Figure 118: Middle East and Africa Value Share and BPS Analysis by Channel, 2025 and 2035
  • Figure 119: Middle East and Africa Y-o-Y Growth Comparison by Channel, 2025-2035
  • Figure 120: Middle East and Africa Attractiveness Analysis by Channel
  • Figure 121: Middle East and Africa Value Share and BPS Analysis by Claim, 2025 and 2035
  • Figure 122: Middle East and Africa Y-o-Y Growth Comparison by Claim, 2025-2035
  • Figure 123: Middle East and Africa Attractiveness Analysis by Claim
  • Figure 124: Global - Tier Structure Analysis
  • Figure 125: Global - Company Share Analysis

Frequently Asked Questions

How big is the Fluorescent Skincare Compounds Market in 2025?

The global Fluorescent Skincare Compounds Market is estimated to be valued at USD 780.3 million in 2025.

What will be the size of the Fluorescent Skincare Compounds Market in 2035?

The market size for the Fluorescent Skincare Compounds Market is projected to reach USD 2,709.4 million by 2035.

How much will be the Fluorescent Skincare Compounds Market growth between 2025 and 2035?

The Fluorescent Skincare Compounds Market is expected to grow at a 13.3% CAGR between 2025 and 2035.

What are the key product types in the Fluorescent Skincare Compounds Market?

The key product types in the Fluorescent Skincare Compounds Market are primers, moisturizers/CC creams, SPF trace gels, masks, and other formulations.

Which function segment will contribute significant share in the Fluorescent Skincare Compounds Market in 2025?

In terms of function, the instant radiance/'tone-up' segment is projected to command 52.5% share in 2025, making it the leading functional category.

Explore Similar Insights

Future Market Insights

Fluorescent Skincare Compounds Market

Chat With

MaRIA

Hi There, I am MaRIA, Your Market Research Intelligence Assistant. How may I help you?