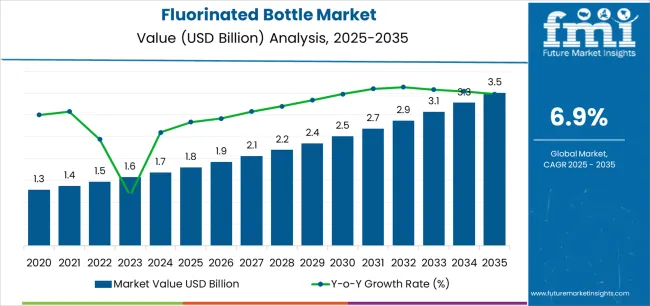
The fluorinated bottle market is valued at USD 1.8 billion in 2025 and is projected to reach USD 3.5 billion by 2035, rising at a 6.9% CAGR, adding USD 1.7 billion in total. The scale and pace of expansion align with accelerating pharmaceutical and specialty chemical industry evolution across drug development, laboratory research, and high-purity manufacturing sectors, where bottle performance influences product integrity, shelf-life stability, and regulatory compliance. Between 2025 and 2030, the market increases to USD 2.5 billion, contributing 41.2% of decade growth as pharmaceutical companies adopt advanced barrier packaging systems and replace conventional plastic containers in critical applications. The larger 58.8% contribution during 2030-2035 reflects deeper integration of ultra-high barrier technologies, enhanced surface treatments, and specialized fluoropolymer coatings supporting demanding applications in biopharmaceuticals, analytical standards, and semiconductor-grade chemicals.
Material type segmentation reinforces these performance priorities: fluorinated HDPE bottles hold ~60% share due to superior chemical resistance characteristics and established pharmaceutical industry acceptance workflows, while fluorinated PET bottles at ~25% offer enhanced clarity properties in applications requiring visual inspection or UV protection within laboratory and analytical environments. By application, pharmaceutical packaging leads with ~50%, followed by laboratory & analytical at ~30% and specialty chemicals at ~15%, reflecting widespread adoption across drug storage, reagent packaging, and high-purity chemical containment.
Geographically, the market is led by USA (7.5% CAGR) and Germany (7.1% CAGR), supported by pharmaceutical manufacturing concentration, advanced chemical industry infrastructure, and specialty packaging innovation capabilities. China (6.8%) and Japan (6.4%) sustain growth through pharmaceutical manufacturing expansion and precision laboratory equipment development, while Switzerland (7.2%), UK (6.6%), and France (6.3%) grow through biopharmaceutical sector advancement rather than basic manufacturing volume increases. Competitive structure remains moderately consolidated, with Thermo Fisher Scientific, Corning Inc., and BÜRKLE GmbH collectively holding 35-45% share, while regional manufacturers such as Wheaton Industries, DWK Life Sciences, and Vitlab compete through specialized bottle configurations, ultra-clean manufacturing processes, and pharmaceutical validation support near major research and production facilities.
Production facilities targeting pharmaceutical applications encounter fewer regulatory obstacles compared to consumer packaging segments, as medical and laboratory applications receive regulatory consideration for essential use designations. Manufacturing operations serving chemical storage, agricultural applications, and industrial processing markets face variable restrictions depending on regional implementation timelines and specific fluorination technologies employed. Asian markets including Japan have restricted specific PFAS compounds like PFOS and PFOA in manufacturing and import activities, though broader fluorinated bottle applications remain less regulated compared to European approaches.
Market dynamics reflect increasing regulatory scrutiny of chemical storage practices combined with growing awareness of cross-contamination risks that favor specialized fluorinated containers over conventional alternatives. Industries emphasizing product quality, regulatory compliance, and contamination prevention continue expanding their adoption of fluorinated bottles despite premium pricing compared to standard plastic containers. The integration of smart packaging technologies, traceability systems, and sustainability considerations represents emerging value propositions that manufacturers leverage to differentiate their offerings in competitive markets.
The plastic packaging market is the largest contributor, accounting for about 30-35%. Fluorinated bottles are used primarily for their enhanced barrier properties, which make them suitable for storing products that require protection from oxygen, moisture, and UV light.
These bottles are especially in demand in industries such as food and beverages, pharmaceuticals, and personal care, where the preservation of product integrity is critical. The food and beverage packaging market contributes roughly 20-25%, as fluorinated bottles are used to package sensitive liquids such as juices, oils, and sauces, where shelf-life extension is essential.
The pharmaceutical packaging market adds around 15-20%, with fluorinated bottles being preferred for packaging medications, particularly those that are sensitive to environmental factors like temperature and moisture.
The personal care and cosmetics market provides about 10-12%, driven by the increasing use of fluorinated bottles for packaging high-end cosmetic products, lotions, and perfumes that require additional protection against external contaminants. The chemical packaging market accounts for approximately 8-10%, as fluorinated bottles are utilized for storing a range of chemicals that are reactive or require higher levels of containment.
| Metric | Value |
|---|---|
| Estimated Value in (2025E) | USD 1.8 billion |
| Forecast Value in (2035F) | USD 3.5 billion |
| Forecast CAGR (2025 to 2035) | 6.9% |
Market expansion is being supported by the increasing global demand for agrochemical packaging solutions and the corresponding need for container systems that can provide superior chemical resistance and product integrity protection while enabling extended storage stability and contamination prevention across various agrochemical and pharmaceutical formulation applications.
Modern chemical manufacturing facilities and agrochemical producers are increasingly focused on implementing packaging solutions that can protect formulation quality, prevent permeation losses, and provide consistent barrier performance throughout complex distribution networks.
Fluorinated bottle packaging's proven ability to deliver exceptional resistance to aggressive chemicals, enable formulation preservation through barrier enhancement, and support regulatory compliance make them essential container formats for contemporary agrochemical packaging and pharmaceutical intermediate storage operations.
The growing emphasis on formulation stability and product efficacy is driving demand for fluorinated bottles that can support chemical compatibility requirements, improve storage performance, and enable advanced barrier formats. Manufacturers' preference for containers that combine effective protection with processing efficiency and handling safety is creating opportunities for innovative fluorinated bottle implementations.
The rising influence of specialty agrochemical production and pharmaceutical intermediate markets is also contributing to increased demand for fluorinated bottles that can provide permeation resistance, moisture protection, and dimensional stability across diverse product categories.
The fluorinated bottle market is poised for rapid growth and transformation. As industries across agrochemicals, pharmaceuticals, industrial chemicals, and specialty fluids seek containers that deliver exceptional chemical resistance, barrier performance, and formulation protection, fluorinated bottles are gaining prominence not just as functional packaging but as strategic enablers of product stability and quality assurance.
Rising agrochemical consumption in Asia-Pacific and expanding pharmaceutical manufacturing markets globally amplify demand, while manufacturers are leveraging innovations in fluorination treatment precision, multi-layer barrier technologies, and advanced polymer compounds.
Pathways like custom fluorination profiles, pharmaceutical-grade barrier systems, and application-specific polymer formulations promise strong margin uplift, especially in high-value segments. Geographic expansion and vertical integration will capture volume, particularly where local manufacturing capabilities and agrochemical industry proximity are critical. Regulatory pressures around chemical packaging requirements, barrier performance standards, agrochemical container regulations, and pharmaceutical packaging specifications give structural support.
The market is segmented by capacity, fluorination type, bottle material, application, end-use industry, closure compatibility, and region. By capacity, the market is divided into below 100ml, 100-500ml, 500ml-1L, 1L-5L, and above 5L. By fluorination type, it covers plasma fluorination, gas phase fluorination, liquid phase fluorination, and others.
By bottle material, it includes HDPE (High-Density Polyethylene), PET (Polyethylene Terephthalate), PP (Polypropylene), and others. By application, it includes agrochemicals, pharmaceuticals, industrial chemicals, automotive fluids, and others.
By end-use industry, it is categorized into agriculture & crop protection, pharmaceutical & life sciences, chemical manufacturing, automotive & transportation, and others. By closure compatibility, it covers screw caps, child-resistant closures, and tamper-evident closures. Regionally, the market is divided into North America, Europe, East Asia, South Asia & Pacific, Latin America, and the Middle East & Africa.
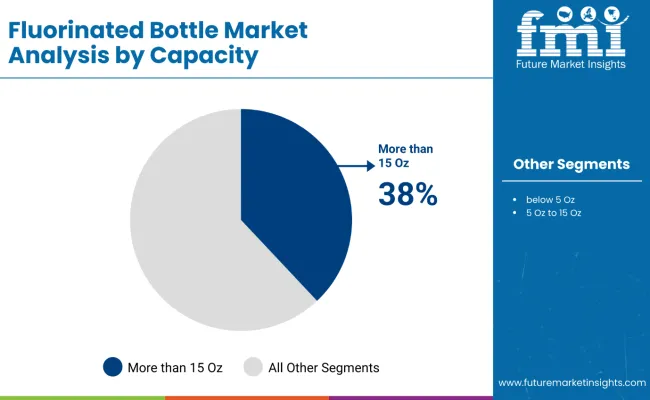
The 500ml-1L segment is projected to account for 36.8% of the fluorinated bottle market in 2025, reaffirming its position as the leading capacity category. Agrochemical producers and pharmaceutical manufacturers increasingly utilize 500ml-1L fluorinated bottles for their optimal compatibility with standard formulation volumes, excellent handling characteristics, and widespread adoption in pesticide concentrate packaging, pharmaceutical intermediate storage, and specialty chemical applications.
The 500ml-1L bottle technology's established industry standardization and consistent barrier performance directly address the industrial requirements for reliable chemical containment in commercial-scale agrochemical distribution environments.
This capacity segment forms the foundation of modern agrochemical packaging operations, as it represents the bottle size with the greatest market penetration and established demand across multiple chemical categories and global markets.
Manufacturer investments in enhanced fluorination processing capabilities and advanced barrier technologies continue to strengthen adoption among agrochemical producers and pharmaceutical packagers. With companies prioritizing formulation stability and regulatory compliance, 500ml-1L fluorinated bottles align with both performance requirements and filling equipment compatibility objectives, making them the central component of comprehensive packaging strategies.
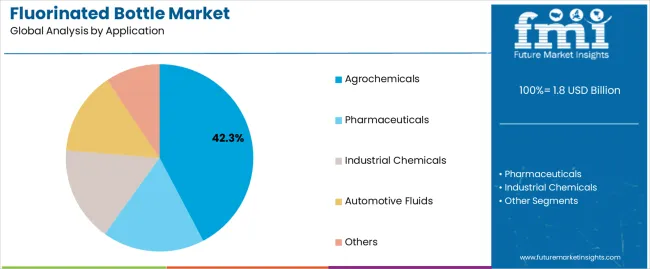
Agrochemical applications are projected to represent 42.3% of fluorinated bottle demand in 2025, underscoring their critical role as the primary industrial consumers of fluorinated containers for pesticide packaging, herbicide formulation storage, and crop protection product distribution.
Agrochemical manufacturers prefer fluorinated bottles for their exceptional chemical resistance capabilities, superior barrier integrity, and ability to prevent formulation degradation while ensuring product efficacy with secure packaging. Positioned as essential container formats for modern agrochemical production and distribution operations, fluorinated bottles offer both functional advantages and formulation preservation benefits.
The segment is supported by continuous innovation in fluorination technologies and the growing availability of specialized barrier formulations that enable permeation resistance with enhanced protection performance and application-specific customization.
Agrochemical producers are investing in automated filling systems to support large-volume fluorinated bottle utilization and production efficiency. As specialty agrochemical consumption becomes more prevalent and pharmaceutical intermediate production increases, agrochemical applications will continue to dominate the end-use market while supporting advanced barrier enhancement and chemical compatibility strategies.
The fluorinated bottle market is advancing rapidly due to increasing demand for chemical-resistant packaging in agrochemical industries and growing adoption of barrier enhancement solutions that provide superior permeation resistance and formulation protection while enabling extended shelf-life across diverse chemical manufacturing and pharmaceutical formulation applications.
The market faces challenges, including fluorination processing costs, competition from alternative barrier technologies, and the need for specialized equipment investments. Innovation in plasma treatment capabilities and advanced polymer formulations continues to influence product development and market expansion patterns.
The growing adoption of plasma fluorination systems, gas phase treatment processes, and sophisticated barrier coating techniques is enabling manufacturers to produce fluorinated bottles with superior chemical resistance, enhanced permeation barriers, and customization functionalities.
Advanced fluorination systems provide improved protection while allowing more efficient processing and consistent quality across various packaging applications and product lines. Manufacturers are increasingly recognizing the competitive advantages of advanced barrier capabilities for formulation protection and chemical compatibility positioning.
Modern fluorinated bottle producers are incorporating co-extrusion technologies, layer-specific fluorination treatments, and hybrid barrier combinations to enhance chemical resistance, enable extended storage stability, and deliver value-added protection solutions to agrochemical brands and pharmaceutical customers.
These technologies improve formulation preservation while enabling new operational capabilities, including reduced permeation losses, enhanced product stability, and contamination prevention. Advanced barrier integration also allows manufacturers to support chemical producers and regulatory compliance beyond traditional containment approaches.
| Country | CAGR (2025 to 2035) |
|---|---|
| India | 8.9% |
| China | 7.8% |
| USA | 6.2% |
| Brazil | 7.4% |
| Germany | 5.8% |
| Japan | 5.3% |
| France | 6.1% |
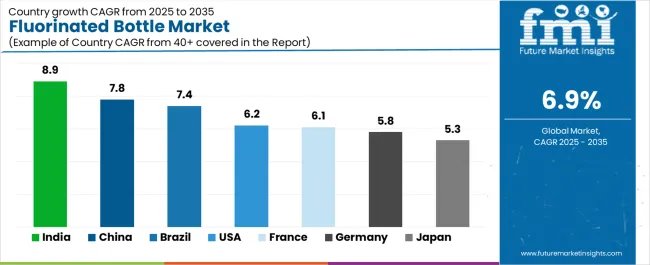
The fluorinated bottle market is experiencing strong growth globally, with India leading at an 8.9% CAGR through 2035, driven by the expanding agrochemical industry, growing pharmaceutical manufacturing, and significant investment in chemical packaging infrastructure development.
China follows at 7.8%, supported by rapid agrochemical consumption growth, increasing domestic pesticide production, and growing export packaging demand. The USA shows growth at 6.2%, emphasizing specialty chemical innovation and pharmaceutical packaging development. Brazil records 7.4%, focusing on agricultural chemical production expansion and growing crop protection product consumption.
Germany demonstrates 5.8% growth, prioritizing precision manufacturing standards and advanced barrier technology excellence. Japan exhibits 5.3% growth, emphasizing quality control and pharmaceutical packaging. France shows 6.1% growth, supported by agrochemical industry modernization and specialty chemical packaging innovation.
The report covers an in-depth analysis of 40+ countries, with top-performing countries are highlighted below.
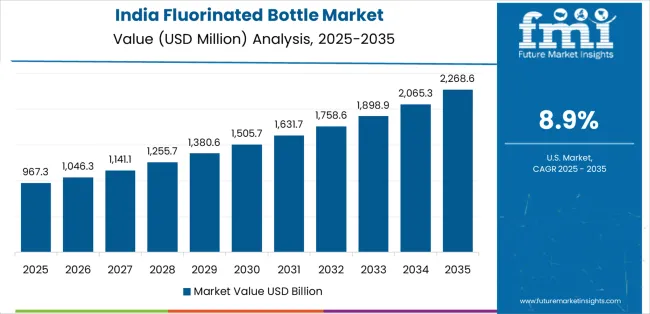
Revenue from fluorinated bottles in India is projected to exhibit exceptional growth with a CAGR of 8.9% through 2035, driven by expanding agrochemical production and rapidly growing pesticide consumption supported by agricultural development policies promoting domestic crop protection manufacturing.
The country's strong position in pharmaceutical intermediate production and increasing investment in chemical packaging infrastructure are creating substantial demand for fluorinated bottle solutions. Major agrochemical producers and pharmaceutical manufacturers are establishing comprehensive packaging sourcing capabilities to serve both domestic formulation demand and export packaging markets.
Demand for fluorinated bottles in China is expanding at a CAGR of 7.8%, supported by the country's massive agrochemical market, expanding pharmaceutical production activities, and increasing adoption of advanced barrier packaging solutions.
The country's government initiatives promoting quality standards and growing agricultural modernization are driving requirements for sophisticated packaging capabilities. International suppliers and domestic manufacturers are establishing extensive production and distribution capabilities to address the growing demand for fluorinated bottle products.
Revenue from fluorinated bottles in the USA is growing at a CAGR of 6.2%, supported by the country's advanced specialty chemical industry, strong emphasis on pharmaceutical packaging quality, and robust demand for high-performance containers in agrochemical formulation applications.
The nation's mature chemical sector and quality-focused operations are driving sophisticated fluorinated barrier systems throughout the supply chain. Leading manufacturers and technology providers are investing extensively in fluorination equipment and barrier testing capabilities to serve both domestic and international markets.
Demand for fluorinated bottles in Brazil is projected to expand at a CAGR of 7.4%, driven by the country's extensive agricultural sector, growing pesticide consumption, and increasing investment in modern formulation facilities.
Brazil's large domestic agrochemical market and commitment to agricultural productivity are supporting demand for fluorinated bottle solutions across multiple production segments. Manufacturers are establishing comprehensive production capabilities to serve the growing domestic market and regional export opportunities.
Revenue from fluorinated bottles in Germany is expected to grow at a CAGR of 5.8%, supported by the country's precision engineering leadership, advanced manufacturing capabilities, and strategic focus on high-quality container production.
Germany's technical excellence and quality focus are driving demand for fluorinated bottles in agrochemical packaging, pharmaceutical applications, and specialty chemical storage. Manufacturers are investing in comprehensive fluorination capabilities to serve both domestic chemical producers and international specialty markets.
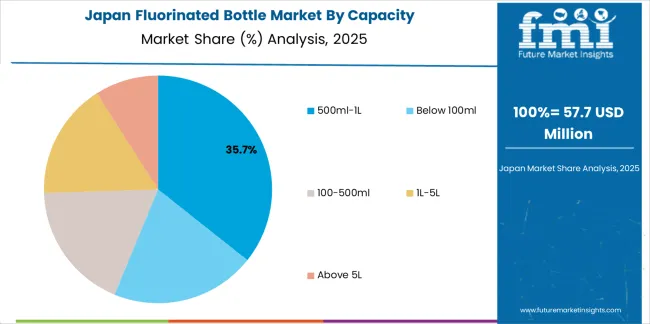
Demand for fluorinated bottles in Japan is growing at a CAGR of 5.3%, driven by the country's expertise in precision manufacturing, emphasis on quality assurance, and strong position in pharmaceutical and specialty chemical packaging.
Japan's established barrier technology capabilities and commitment to excellence are supporting investment in advanced fluorination technologies throughout major manufacturing centers. Industry leaders are establishing comprehensive quality systems to serve domestic chemical producers and pharmaceutical manufacturers.
Revenue from fluorinated bottles in France is anticipated to expand at a CAGR of 6.1%, supported by the country's agrochemical production concentration, growing pharmaceutical sector, and strategic position in European chemical markets.
France's advanced chemical capabilities and integrated manufacturing infrastructure are driving demand for high-quality fluorinated bottles in pesticide packaging, pharmaceutical intermediate storage, and specialty chemical applications. Leading manufacturers are investing in specialized capabilities to serve the stringent requirements of pharmaceutical and agrochemical industries.
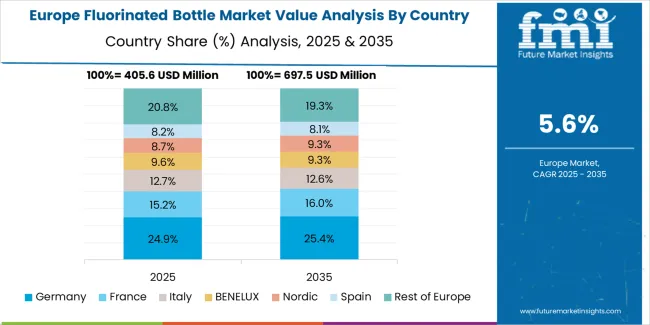
The fluorinated bottle market in Europe is projected to grow from USD 0.5 billion in 2025 to USD 1.0 billion by 2035, registering a CAGR of 7.2% over the forecast period. Germany is expected to maintain its leadership position with a 31.2% market share in 2025, declining slightly to 30.8% by 2035, supported by its strong precision manufacturing base, advanced fluorination processing capabilities, and comprehensive agrochemical and pharmaceutical packaging sector serving diverse fluorinated bottle applications across Europe.
France follows with a 24.5% share in 2025, projected to reach 25.0% by 2035, driven by robust demand for fluorinated bottles in agrochemical packaging, pharmaceutical intermediate applications, and specialty chemical production, combined with established chemical manufacturing infrastructure and export-oriented packaging expertise.
The United Kingdom holds a 16.8% share in 2025, expected to reach 17.2% by 2035, supported by strong pharmaceutical production and growing specialty chemical activities. Italy commands a 12.5% share in 2025, projected to reach 13.0% by 2035, while Spain accounts for 8.0% in 2025, expected to reach 8.5% by 2035.
Poland maintains a 3.5% share in 2025, growing to 3.8% by 2035. The Rest of Europe region, including Nordic countries, Eastern Europe, Belgium, Netherlands, and other nations, is anticipated to maintain momentum, with its collective share moving from 3.5% to 1.7% by 2035, attributed to increasing agrochemical production in Eastern Europe and growing pharmaceutical manufacturing in Nordic countries implementing advanced packaging programs.
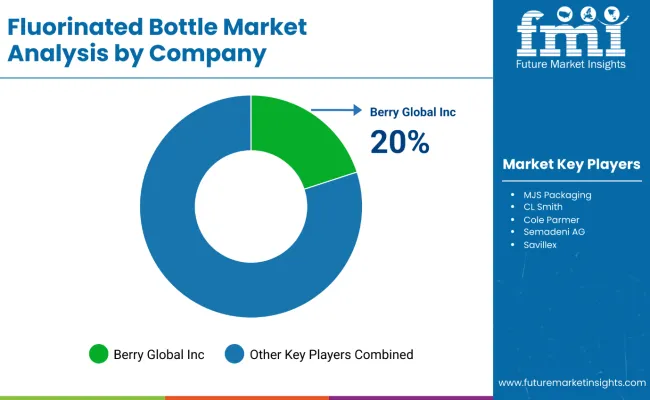
The Fluorinated Bottle Market is seeing steady growth as industries such as chemicals, agrochemicals, lubricants, and household cleaners continue shifting toward packaging that offers improved barrier properties and greater resistance to permeation. Fluorination enhances the chemical compatibility of HDPE bottles, preventing paneling, vapor transmission, and product degradation. With stricter regulations around storage of hazardous and reactive liquids, manufacturers across North America, Europe, and Asia are investing in fluorinated bottles as a safer, longer-lasting packaging choice.
Berry Global Inc., Plastipak Holdings Inc., and Graham Packaging Company are at the forefront of this market, leveraging large-scale manufacturing capabilities and in-house fluorination technologies to supply high-performance containers for industrial and commercial applications. Their focus remains on lightweight designs, higher durability, and compliance with evolving chemical packaging standards.
Mid-sized specialists such as Alpha Packaging, Greiner Packaging, and Pretium Packaging LLC are expanding their portfolios with custom fluorinated bottles tailored for agricultural chemicals, automotive fluids, and specialty cleaning formulations. These companies are increasingly adopting advanced in-mold fluorination techniques to enhance barrier performance.
Distributors and packaging solution providers including Kaufman Container Company, CL Smith Company, O.Berk Company LLC, and SKS Bottle & Packaging Inc. play a critical role in supplying small and mid-volume customers with a wide variety of fluorinated HDPE bottle formats. By offering flexible ordering, custom labeling, and stocking programs, they help chemical producers and contract manufacturers efficiently manage product packaging needs.
| Items | Values |
|---|---|
| Quantitative Units (2025) | USD 1.8 billion |
| Capacity | Below 100ml, 100-500ml, 500ml-1L, 1L-5L, Above 5L |
| Fluorination Type | Plasma Fluorination, Gas Phase Fluorination, Liquid Phase Fluorination, Others |
| Bottle Material | HDPE (High-Density Polyethylene), PET (Polyethylene Terephthalate), PP (Polypropylene), Others |
| Application | Agrochemicals, Pharmaceuticals, Industrial Chemicals, Automotive Fluids, Others |
| End-Use Industry | Agriculture & Crop Protection, Pharmaceutical & Life Sciences, Chemical Manufacturing, Automotive & Transportation, Others |
| Closure Compatibility | Screw Caps, Child-Resistant Closures, Tamper-Evident Closures |
| Regions Covered | North America, Europe, East Asia, South Asia & Pacific, Latin America, Middle East & Africa |
| Countries Covered | United States, Canada, United Kingdom, Germany, France, China, Japan, South Korea, India, Brazil, Australia and 40+ countries |
| Key Companies Profiled | Berry Global Inc., Alpha Packaging, Greiner Packaging, Plastipak Holdings Inc., Graham Packaging Company, Kaufman Container Company, CL Smith Company, O.Berk Company LLC, Pretium Packaging LLC, SKS Bottle & Packaging Inc. |
| Additional Attributes | Dollar sales by capacity and application category, regional demand trends, competitive landscape, technological advancements in fluorination systems, polymer formulation development, barrier enhancement innovation, and supply chain integration |
The global fluorinated bottle market is estimated to be valued at USD 1.8 billion in 2025.
The market size for the fluorinated bottle market is projected to reach USD 3.5 billion by 2035.
The fluorinated bottle market is expected to grow at a 6.9% CAGR between 2025 and 2035.
The key product types in fluorinated bottle market are 500ml-1l, below 100ml, 100-500ml, 1l-5l and above 5l.
In terms of application, agrochemicals segment to command 42.3% share in the fluorinated bottle market in 2025.


Our Research Products

The "Full Research Suite" delivers actionable market intel, deep dives on markets or technologies, so clients act faster, cut risk, and unlock growth.

The Leaderboard benchmarks and ranks top vendors, classifying them as Established Leaders, Leading Challengers, or Disruptors & Challengers.

Locates where complements amplify value and substitutes erode it, forecasting net impact by horizon

We deliver granular, decision-grade intel: market sizing, 5-year forecasts, pricing, adoption, usage, revenue, and operational KPIs—plus competitor tracking, regulation, and value chains—across 60 countries broadly.

Spot the shifts before they hit your P&L. We track inflection points, adoption curves, pricing moves, and ecosystem plays to show where demand is heading, why it is changing, and what to do next across high-growth markets and disruptive tech

Real-time reads of user behavior. We track shifting priorities, perceptions of today’s and next-gen services, and provider experience, then pace how fast tech moves from trial to adoption, blending buyer, consumer, and channel inputs with social signals (#WhySwitch, #UX).

Partner with our analyst team to build a custom report designed around your business priorities. From analysing market trends to assessing competitors or crafting bespoke datasets, we tailor insights to your needs.
Supplier Intelligence
Discovery & Profiling
Capacity & Footprint
Performance & Risk
Compliance & Governance
Commercial Readiness
Who Supplies Whom
Scorecards & Shortlists
Playbooks & Docs
Category Intelligence
Definition & Scope
Demand & Use Cases
Cost Drivers
Market Structure
Supply Chain Map
Trade & Policy
Operating Norms
Deliverables
Buyer Intelligence
Account Basics
Spend & Scope
Procurement Model
Vendor Requirements
Terms & Policies
Entry Strategy
Pain Points & Triggers
Outputs
Pricing Analysis
Benchmarks
Trends
Should-Cost
Indexation
Landed Cost
Commercial Terms
Deliverables
Brand Analysis
Positioning & Value Prop
Share & Presence
Customer Evidence
Go-to-Market
Digital & Reputation
Compliance & Trust
KPIs & Gaps
Outputs
Full Research Suite comprises of:
Market outlook & trends analysis
Interviews & case studies
Strategic recommendations
Vendor profiles & capabilities analysis
5-year forecasts
8 regions and 60+ country-level data splits
Market segment data splits
12 months of continuous data updates
DELIVERED AS:
PDF EXCEL ONLINE
Competitive Overview of Fluorinated Bottle Market Share
Bottle Sealing Wax Market Size and Share Forecast Outlook 2025 to 2035
Bottle Filling Machines Market Size and Share Forecast Outlook 2025 to 2035
Bottle Shippers Market Size and Share Forecast Outlook 2025 to 2035
Bottled Water Packaging Market Size and Share Forecast Outlook 2025 to 2035
Fluorinated Coating Market Size and Share Forecast Outlook 2025 to 2035
Fluorinated Ethylene Propylene (FEP) Market Size and Share Forecast Outlook 2025 to 2035
Bottle Sticker Labelling Machine Market Size and Share Forecast Outlook 2025 to 2035
Bottle Dividers Market Size and Share Forecast Outlook 2025 to 2035
Bottle Jack Market Size and Share Forecast Outlook 2025 to 2035
Bottles Market Analysis - Growth & Forecast 2025 to 2035
Bottle Capping Machine Market Analysis by Automation, Operating Speed, Machine Type, End-use Industry, and Region Forecast Through 2035
Market Share Distribution Among Bottle Dividers Suppliers
Fluorinated Containers Market Trends – Growth & Forecast 2024-2034
Bottle Carrier Market Trends – Growth & Forecast 2024-2034
Bottle Cap Market Analysis & Industry Forecast 2024-2034
Bottled Water Processing Equipment Market Trends – Growth & Industry Forecast 2025-2035
Bottle Pourers Market
Fluorinated Solvents Market
RTD Bottled Cocktail Market - Size, Share, and Forecast Outlook 2025 to 2035

Thank you!
You will receive an email from our Business Development Manager. Please be sure to check your SPAM/JUNK folder too.
Chat With
MaRIA