Reports

- Global Locations -

Headquarters

Future Market Insights, Inc.

Christiana Corporate, 200
Continental Drive, Suite 401,
Newark, Delaware - 19713,
United States

T: +1-845-579-5705

Americas

Future Market Insights, Inc.

616 Corporate Way, Suite 2-9018,
Valley Cottage, NY 10989, United States

T: +1-347-918-3531

MEA

Future Market Insights

1602-6 Jumeirah Bay X2 Tower, Plot No: JLT-PH2-X2A,
Jumeirah Lakes Towers, Dubai,
United Arab Emirates

Europe

Future Market Insights

3rd Floor, 207 Regent Street,
W1B 3HH London
United Kingdom

T: + 44 (0) 20 8123 9659
D: +44 (0) 20 3287 4268

Asia Pacific

Future Market Insights

IndiaLand Global Tech Park, Unit UG-1, Behind Grand HighStreet, Phase 1, Hinjawadi, MH, Pune – 411057, India

French Fries Cutter Market Outlook (2023 to 2033)

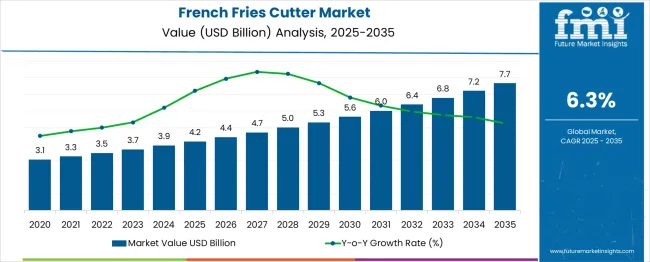
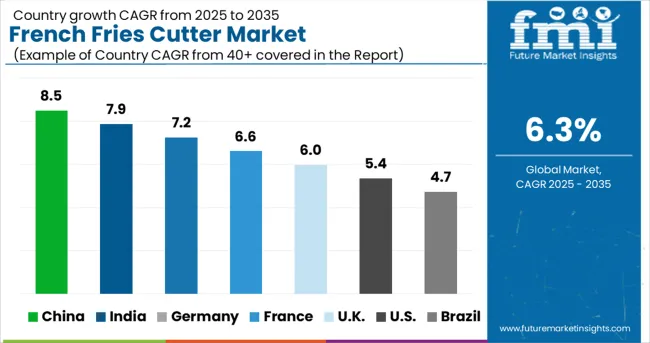
According to Future Market Insights research, during the projected period, the global French fries cutter market is expected to grow at a CAGR of 6.3%.

The French fries cutter market value is projected to increase from US$ 1,997.9 Million in 2023 to US$ 3,680.5 Million by 2033. The French fries cutter market is expected to grow at a CAGR of 6.3% during the forecast period of 2023 to 2033, while the Historical CAGR of 5.13% during the forecast period of 2018 to 2022. The market for French fries cutters has been growing steadily for the past few years.

One such trend is the increasing popularity of electric French fry cutters. These devices offer a number of advantages over their manual counterparts, including increased safety and efficiency. As such, it is not surprising that they are expected to account for a larger share of the French fries cutter market in the future. There are a number of factors that contribute to the growth of the French fries cutter market. One of the most important factors is the increasing popularity of fast-food restaurants. As more and more people eat out, there is a greater demand for products that can make food preparation faster and easier. French fries cutters are an essential tool for any restaurant that wants to serve fresh, delicious fries. Another factor that contributes to the growth of the French fries cutter market is the increasing health consciousness of consumers.

While the COVID-19 pandemic has had a negative impact on many businesses, the French fries cutters market has actually seen a growth in demand for French fries cutters. This is due to the fact that more people are cooking at home and looking for ways to make their meals more fun and interesting. Overall, the impact of COVID-19 on the French fries cutters market has been positive. Consumers are cooking more at home and experimenting with new recipes, which has resulted in increased demand for these products. In addition to that, the trend worth noting is the growing demand for French fries cutters from emerging markets such as China and India.

Attribute Details
Market Size Value in 2023 US$ 1,997.9 Million
Market Forecast Value in 2033 US$ 3,680.5 Million
Global Growth Rate (2023 to 2033) 6.3% CAGR
Forecast Period 2023 to 2033
Market Share of China 32%

Don't pay for what you don't need

Customize your report by selecting specific countries or regions and save 30%!

Deep-dive into Growth Drivers Impacting French Fries Cutter Market

A French fry cutter is a kitchen appliance that helps to cut potatoes into the thin strips that are used to make French fries. The French Fry Cutter is a kitchen appliance that helps to cut potatoes into the thin strips that are used to make French fries. There are several drivers for this product in the French fries cutters market, including:

  • The growing demand for French fries cutters including fast food.
  • The fact that potatoes are easy to store.
  • The popularity of home cooking shows that feature French fries as a main dish.

French Fries Cutter Market

Category-wise Insights

Which Operating Type Should Indeed Stimulate Revenue Generation in the French Fries Cutter Market?

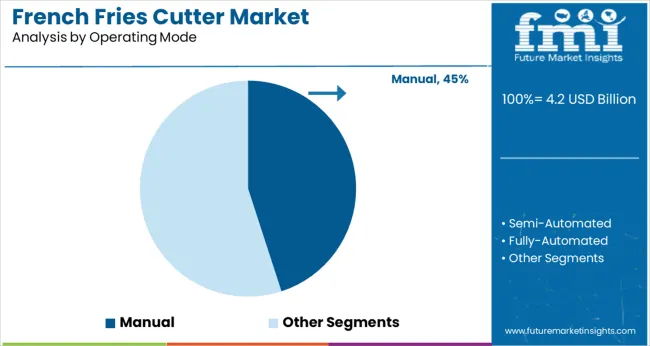
It is critical to segment according to operating type when choosing the best French fries cutter for your company. The three types in the French fries cutters market are manual, electric, and automatic.

The most fundamental category of the French fries cutters market is the manual cutter. It is hand-operated and it does not require electricity. Manual cutters have become less expensive than electric or automatic cutters but less efficient.

The manual cutter is less expensive than the electric cutter, but it is also less efficient. Electric cutters are more convenient and faster to use than manual cutters, and they produce more consistent results. The automatic cutter is the most expensive, but it is also the most efficient type of French fries cutter boosting the French fries cutters market adoption trends.

Who are the End Users of French Fries Cutter According to French Fries Cutters Market?

French fry cutters are one of those applications that have a very diverse range of end users. They can be found in hotel cafes, household kitchens, and even some restaurants. One thing that is certain, however, is that French fry cutters are most commonly used in commercial settings. This, in turn, escalates the French fries cutters market trends.

This is likely due to the fact that they can save a lot of time and labor when it comes to cutting potatoes into fries. In addition, they often come with a number of different size options, which makes them ideal for catering to large groups. These factors ramp up the adoption of French fries cutters as well as the demand for French fries cutters.

Supermarket and Industrial Distributors Are Propelling the French Fries Cutters Market Growth

The French fries cutter market is anticipated to grow at 6.3% CAGR, a steady pace during the forecast period 2023 to 2033, estimated by FMI. The French fries cutters market is growing at a rapid pace, propelled by the demand from both supermarkets and industrial distributors.

The major factors driving the French fries cutters market growth are increasing demand from consumers and businesses for convenience foods and rising disposable incomes. However, health concerns regarding the consumption of fried foods are expected to restrain French fries cutters' market growth during the forecast period.

Supermarkets are the largest end-users of the French fries cutters market, accounting for over 50% of the total demand. The increasing popularity of frozen French fries among consumers is driving the demand for French fries cutters in supermarkets.

Businesses such as restaurants, hotels, and canteens are also major end-users of French fries cutters. The growing demand for ready-to-eat food items in these businesses is fueling the French fries cutters market growth. Industrial distributors are another key driver of French fries cutters market growth. These distributors supply French fries cutters to various end-users such as supermarkets, restaurants, and hotels.
Nandini Roy Choudhury

Principal Consultant

Talk to Analyst

Find your sweet spots for generating winning opportunities in this market.

Country-wise Insights

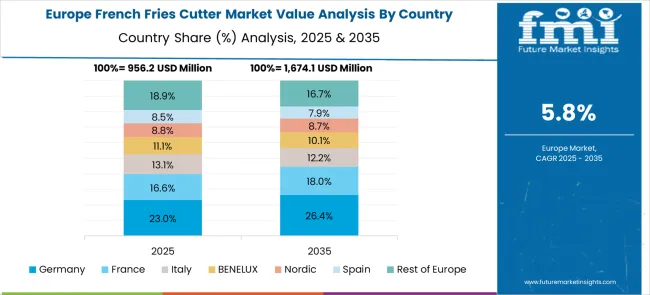
What is the Overview of the European French Fries Cutter Market?

In Europe, the French fries cutter market accounts for 40% of the total market share, estimated to be worth USD 799.2 million in 2023. In Europe, they are often eaten as a snack or starter and sometimes even as a main course. There is even a national holiday dedicated to French fries in Belgium. This, in turn, escalates the French fries cutter market trends.

The United Kingdom French fries cutter growth is projected to account for 22% of the market in 2023, with a share value of US$ 175.8 million. The humble French fry has been a staple of the American diet for decades now. In America, French fries are often served as a side dish to burgers and sandwiches. They can also be found in many fast-food restaurants.
What is the Scenario of the North American Market for French Fries Cutters?

United States’ French Fries Cutter Market

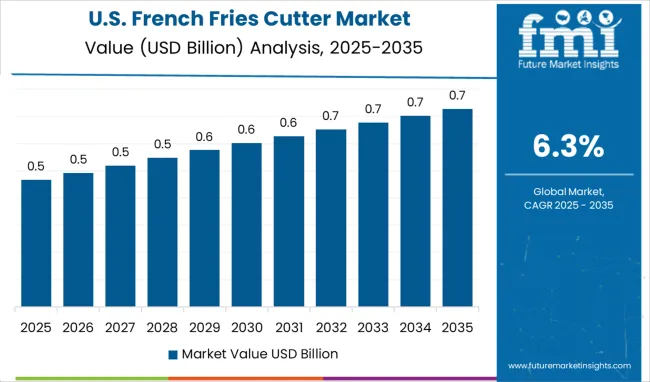
The USA-French fries cutter market is estimated to account for 68% of the market, with a share value of $516.3 million. United States’ French fries cutter market The USA-French fries cutter market is expected to grow at a French fries cutter market share of 38% during the forecast period of 2023 to 2033.

The major drivers for the French fries cutter market are the increasing demand for processed and convenience food and the growing popularity of French fries as a fast-food item. The high demand for French fries in the United States is resulting in an increased demand for French fries cutters.

Canadian French Fries Cutter Market

Processed food has been gaining popularity in recent years owing to the hectic lifestyles of consumers. Convenience foods are in high demand as they save time and effort. French fries are a popular convenience food and are consumed extensively in Canada. This has resulted in an increased demand for French fries cutters in Canada.

What Are the Key Factors Pushing the Growth of the Asia Pacific French Fries Cutter Market?

The Asia Pacific market for French fries cutters is growing rapidly due to the high demand from emerging economies. The key factors which are provoking this growth are increasing disposable incomes, urbanization, and the growing preference for Western-style food.

China French Fries Cutter Market

The Chinese French fries cutter market growth is projected to account for 32% of the market by 2023, with a share worth US$ 115.1 million. Due to the high demand for French fries cutters from these countries, manufacturers are racing to keep up with the demand by investing in new production facilities and expanding their existing ones.

This is resulting in a rapid increase in the supply of French fries cutters, which is driving down prices and making them more affordable for consumers. This presents a huge French fries cutter market opportunity for manufacturers to capitalize on this growing French fries cutter market and reap huge profits.
Competitive Landscape

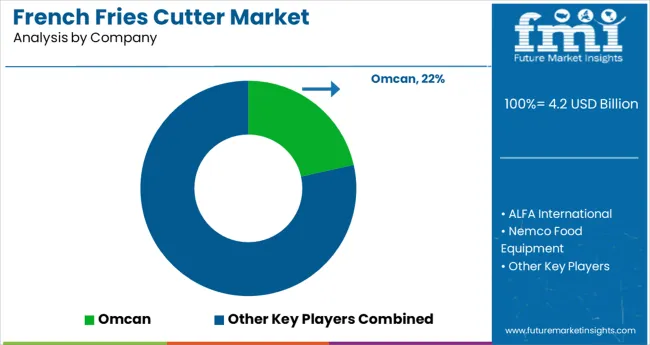
The competitive landscape of the French fries cutters market is quite diverse, with a large number of consumer and business-oriented companies vying for French fries cutters market share. The overall demand for French fry cutters has been growing steadily in recent years due in part to the popularity of fast-food restaurants and the increased consumption of French Fries.

A number of well-established companies compete in the French fry cutter market, including Cuisinart, Hamilton Beach, and Black & Decker. These companies have a wide variety of products to choose from, ranging from simple hand-held devices to more complex countertop models.

In addition to the major players in the French fries cutters market, there are also a number of smaller companies that offer more specialized products. For example, some companies focus on producing higher-quality cutters for use in restaurants, while others offer more affordable options for home use.

The growing demand for processed and convenience foods is the major factor driving the French fries cutters market growth. The increasing disposable income and changing lifestyle of consumers are also some of the key factors propelling the demand for French fries cutters.

However, the high cost of these cutters may restrain the French fries cutters market growth to some extent. Moreover, the easy availability of alternatives such as manually operated potato slicers is also anticipated to challenge the French fries cutters market growth during the forecast period.

Get the data you need at a Fraction of the cost

Personalize your report by choosing insights you need
and save 40%!

French Fries Cutter Market Report Scope

Attribute Details
Forecast Period 2023 to 2033
Historical Data Available for 2018 to 2022
Market Analysis USD Million for Value and Units for Volume
Key Regions Covered
  • North America
  • Latin America
  • Europe
  • Asia Pacific
  • Oceania
  • Middle East and Africa (MEA)
Key Countries Covered
  • The USA
  • Canada
  • Mexico
  • Germany
  • United Kingdom
  • France
  • Italy
  • Spain
  • China
  • Japan
  • India
  • South Korea
  • Australia
  • Brazil
  • Argentina
  • South Africa
  • UAE
Key Segments Covered
  • By Product
  • By Type
  • By Material
  • By Blade Material
  • By Operating mode
  • By End-user
  • By Distribution Channel
  • By Region
Key Companies Profiled
  • Omcan
  • ALFA International
  • Nemco Food Equipment
  • The Vollrath Company
  • Norpro
  • Thunder Group
  • Browne Food Service
  • Robot Coupe
  • Traditional catering products
  • Uniworld Food Service Equipment
  • Crown Marks
  • Matfer Bourgeat United States
  • TigerChef
  • Edlund Company
Report Coverage Market Forecast, Company Share Analysis, Competitive Landscape, DROT Analysis, Market Dynamics and Challenges, and Strategic Growth Initiatives
Customization & Pricing Available upon Request

French Fries Cutters Market Segmentation

By Product Type:

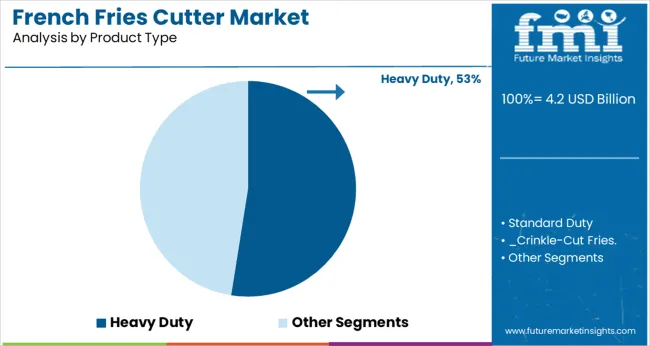
  • Heavy Duty
  • Standard Duty
    • Crinkle-Cut Fries.
    • Curly Fries.
    • Home Fries.
    • Shoestring Fries.
    • Steak Fries.
    • Sweet Potato Fries.
    • Tater Tots.
    • Tornado Fries.

By Operating Mode:

  • Manual
  • Semi-Automated
  • Fully-Automated

By Blade Material:

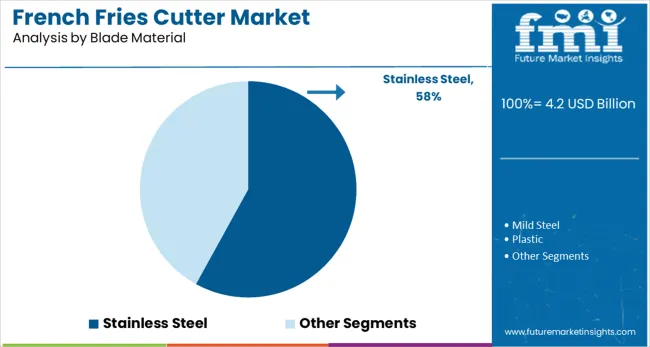
  • Stainless steel
  • Mild steel
  • Plastic

By Material:

  • Cast iron
  • Plastic

By End-use:

  • Hotel and Restaurants
  • Bakery
  • Household
  • Cafes
  • Domestic purpose
  • Cloud kitchens

By Distribution Channel:

  • Hypersmart
  • Super Mart
  • Retailer
  • Distributors
  • Online

By Application:

  • Hotel
  • Restaurants
  • Cafes
  • Domestic purpose
  • Cloud kitchens

By Region:

  • North America
  • Latin America
  • Asia Pacific
  • Middle East and Africa (MEA)
  • Europe

Frequently Asked Questions

What is the market Share value of French Fries Cutter Market in 2023?

The global French fries cutter market will reach a valuation of US$ 1,997.9 Million by the end of 2023.

What is the demand outlook forecast for the French Fries Cutter Market in 2033?

The global French Fries Cutter Market is forecasted to surpass US$ 3,680.5 Million by the end of 2033.

What is the, North America French Fries Cutter Market Outlook?

The North American French fries cutter market is contributing 38 % of total market share which values at US$759.2 Million.

What is the, Europe French Fries Cutter Market Outlook?

In Europe French fries cutter market is contributing 40% of total market share which values US$ 799.2 Million in year 2023.

What is the USA French Fries Cutter Market Outlook?

The USA French fries cutter market is expected to register 68% market share and the share value is US$ 516.3 million.

What is the United Kingdom French Fries Cutter Market Outlook?

The United Kingdom French fries cutter market is expected to register a 22% market share year 2023 and the share value is US$ 175.8 Million.

What is the China French Fries Cutter Market Outlook?

The China French fries cutter market is expected to register 32% market share year 2023 and share value is US$ 115.1 Million.

Table of Content

1. Executive Summary | French Fries Cutter Market

    1.1. Global Market Outlook

    1.2. Demand-side Trends

    1.3. Supply-side Trends

    1.4. Technology Roadmap Analysis

    1.5. Analysis and Recommendations

2. Market Overview

    2.1. Market Coverage / Taxonomy

    2.2. Market Definition / Scope / Limitations

3. Market Background

    3.1. Market Dynamics

        3.1.1. Drivers

        3.1.2. Restraints

        3.1.3. Opportunity

        3.1.4. Trends

    3.2. Scenario Forecast

        3.2.1. Demand in Optimistic Scenario

        3.2.2. Demand in Likely Scenario

        3.2.3. Demand in Conservative Scenario

    3.3. Product launches & Recent Developments

    3.4. Product Life Cycle Analysis

    3.5. Value Chain Analysis

        3.5.1. Supply Side Participants and their Roles

            3.5.1.1. Producers

            3.5.1.2. Mid-Level Participants (Traders/ Agents/ Brokers)

            3.5.1.3. Wholesalers and Distributors

        3.5.2. % of Operating Margin Analysis

        3.5.3. List of Raw Material Suppliers

        3.5.4. List of Existing and Potential Buyer’s

    3.6. Global Market - Pricing Analysis

        3.6.1. Price Point Assessment by Region

        3.6.2. Price Point Assessment by Product Type

        3.6.3. Price Forecast till 2032

        3.6.4. Factors affecting pricing

    3.7. Forecast Factors - Relevance & Impact

    3.8. PESTLE and Porter’s Analysis

    3.9. Regulatory Landscape

        3.9.1. Packaging & Labelling Regulations

        3.9.2. Certifications and Certifying Agency Overview

        3.9.3. Import/Export Policies

    3.10. Regional Parent Market Outlook

    3.11. Production and Consumption Statistics

    3.12. Import and Export Statistics

    3.13. Consumers Survey Analysis

    3.14. Macro-Economic Factors

    3.15. Product Claims & Nutritional Information Scan by Buyers

4. Global Analysis 2018 to 2022 and Forecast, 2023 to 2033

    4.1. Historical Market Size Value (US$ million) & Volume (MT) Analysis, 2018 to 2022

    4.2. Current and Future Market Size Value (US$ million) & Volume (MT) Projections, 2023 to 2033

        4.2.1. Y-o-Y Growth Trend Analysis

        4.2.2. Absolute $ Opportunity Analysis

5. Global Analysis 2018 to 2022 and Forecast 2023 to 2033, By Product Type

    5.1. Introduction / Key Findings

    5.2. Historical Market Size Value (US$ million) & Volume (MT) Analysis By Product Type, 2018 to 2022

    5.3. Current and Future Market Size Value (US$ million) & Volume (MT) Analysis and Forecast By Product Type, 2023 to 2033

        5.3.1. Heavy duty

        5.3.2. Standard duty

            5.3.2.1. Crinkle-Cut Fries

            5.3.2.2. Curly Fries

            5.3.2.3. Home Fries

            5.3.2.4. Shoestring Fries

            5.3.2.5. Steak Fries

            5.3.2.6. Sweet Potato Fries

            5.3.2.7. Tater Tots

            5.3.2.8. Tornado Fries

    5.4. Y-o-Y Growth Trend Analysis By Product Type, 2018 to 2022

    5.5. Absolute $ Opportunity Analysis By Product Type, 2023 to 2033

6. Global Analysis 2018 to 2022 and Forecast 2023 to 2033, By Application

    6.1. Introduction / Key Findings

    6.2. Historical Market Size Value (US$ million) & Volume (MT) Analysis By Application, 2018 to 2022

    6.3. Current and Future Market Size Value (US$ million) & Volume (MT) Analysis and Forecast By Application, 2023 to 2033

        6.3.1. Hotels

        6.3.2. Restraunts

        6.3.3. Cafes

        6.3.4. Cloud kitchen

        6.3.5. Domestic Purpose

    6.4. Y-o-Y Growth Trend Analysis By Application, 2018 to 2022

    6.5. Absolute $ Opportunity Analysis By Application, 2023 to 2033

7. Global Analysis 2018 to 2022 and Forecast 2023 to 2033, By Material

    7.1. Introduction / Key Findings

    7.2. Historical Market Size Value (US$ million) & Volume (MT) Analysis By Material, 2018 to 2022

    7.3. Current and Future Market Size Value (US$ million) & Volume (MT) Analysis and Forecast By Material, 2023 to 2033

        7.3.1. Cast Iron

        7.3.2. Plastic

    7.4. Y-o-Y Growth Trend Analysis By Material, 2018 to 2022

    7.5. Absolute $ Opportunity Analysis By Material, 2023 to 2033

8. Global Analysis 2018 to 2022 and Forecast 2023 to 2033, By Blade Material

    8.1. Introduction / Key Findings

    8.2. Historical Market Size Value (US$ million) & Volume (MT) Analysis By Blade Material, 2018 to 2022

    8.3. Current and Future Market Size Value (US$ million) & Volume (MT) Analysis and Forecast By Blade Material, 2023 to 2033

        8.3.1. Stainless Steel

        8.3.2. Mild Steel

        8.3.3. Plastic

    8.4. Y-o-Y Growth Trend Analysis By Blade Material, 2018 to 2022

    8.5. Absolute $ Opportunity Analysis By Blade Material, 2023 to 2033

9. Global Analysis 2018 to 2022 and Forecast 2023 to 2033, By Operating Mode

    9.1. Introduction / Key Findings

    9.2. Historical Market Size Value (US$ million) & Volume (MT) Analysis By Operating Mode, 2018 to 2022

    9.3. Current and Future Market Size Value (US$ million) & Volume (MT) Analysis and Forecast By Operating Mode, 2023 to 2033

        9.3.1. Manual

        9.3.2. Semi-Automated

        9.3.3. Automated

    9.4. Y-o-Y Growth Trend Analysis By Operating Mode, 2018 to 2022

    9.5. Absolute $ Opportunity Analysis By Operating Mode, 2023 to 2033

10. Global Analysis 2018 to 2022 and Forecast 2023 to 2033, By Distribution Channel

    10.1. Introduction / Key Findings

    10.2. Historical Market Size Value (US$ million) & Volume (MT) Analysis By Distribution Channel, 2018 to 2022

    10.3. Current and Future Market Size Value (US$ million) & Volume (MT) Analysis and Forecast By Distribution Channel, 2023 to 2033

        10.3.1. Hypermart

        10.3.2. Supermart

        10.3.3. Distributor

        10.3.4. Online

    10.4. Y-o-Y Growth Trend Analysis By Distribution Channel, 2018 to 2022

    10.5. Absolute $ Opportunity Analysis By Distribution Channel, 2023 to 2033

11. Global Analysis 2018 to 2022 and Forecast 2023 to 2033, By Region

    11.1. Introduction

    11.2. Historical Market Size Value (US$ million) & Volume (MT) Analysis By Region, 2018 to 2022

    11.3. Current Market Size Value (US$ million) & Volume (MT) Analysis and Forecast By Region, 2023 to 2033

        11.3.1. North America

        11.3.2. Latin America

        11.3.3. Europe

        11.3.4. East Asia

        11.3.5. South Asia

        11.3.6. Oceania

        11.3.7. MEA

    11.4. Market Attractiveness Analysis By Region

12. North America Analysis 2018 to 2022 and Forecast 2023 to 2033, By Country

    12.1. Historical Market Size Value (US$ million) & Volume (MT) Trend Analysis By Market Taxonomy, 2018 to 2022

    12.2. Market Size Value (US$ million) & Volume (MT) Forecast By Market Taxonomy, 2023 to 2033

        12.2.1. By Country

            12.2.1.1. the USA

            12.2.1.2. Canada

        12.2.2. By Product Type

        12.2.3. By Application

        12.2.4. By Material

        12.2.5. By Blade Material

        12.2.6. By Operating Mode

        12.2.7. By Distribution Channel

    12.3. Market Attractiveness Analysis

        12.3.1. By Country

        12.3.2. By Product Type

        12.3.3. By Application

        12.3.4. By Material

        12.3.5. By Blade Material

        12.3.6. By Operating Mode

        12.3.7. By Distribution Channel

    12.4. Key Takeaways

13. Latin America Analysis 2018 to 2022 and Forecast 2023 to 2033, By Country

    13.1. Historical Market Size Value (US$ million) & Volume (MT) Trend Analysis By Market Taxonomy, 2018 to 2022

    13.2. Market Size Value (US$ million) & Volume (MT) Forecast By Market Taxonomy, 2023 to 2033

        13.2.1. By Country

            13.2.1.1. Brazil

            13.2.1.2. Mexico

            13.2.1.3. Argentina

            13.2.1.4. Chile

            13.2.1.5. Peru

            13.2.1.6. Rest of Latin America

        13.2.2. By Product Type

        13.2.3. By Application

        13.2.4. By Material

        13.2.5. By Blade Material

        13.2.6. By Operating Mode

        13.2.7. By Distribution Channel

    13.3. Market Attractiveness Analysis

        13.3.1. By Country

        13.3.2. By Product Type

        13.3.3. By Application

        13.3.4. By Material

        13.3.5. By Blade Material

        13.3.6. By Operating Mode

        13.3.7. By Distribution Channel

    13.4. Key Takeaways

14. Europe Analysis 2018 to 2022 and Forecast 2023 to 2033, By Country

    14.1. Historical Market Size Value (US$ million) & Volume (MT) Trend Analysis By Market Taxonomy, 2018 to 2022

    14.2. Market Size Value (US$ million) & Volume (MT) Forecast By Market Taxonomy, 2023 to 2033

        14.2.1. By Country

            14.2.1.1. Germany

            14.2.1.2. Italy

            14.2.1.3. France

            14.2.1.4. U.K.

            14.2.1.5. Spain

            14.2.1.6. Russia

            14.2.1.7. BENELUX

            14.2.1.8. Poland

            14.2.1.9. Nordic Countries

            14.2.1.10. Rest of Europe

        14.2.2. By Product Type

        14.2.3. By Application

        14.2.4. By Material

        14.2.5. By Blade Material

        14.2.6. By Operating Mode

        14.2.7. By Distribution Channel

    14.3. Market Attractiveness Analysis

        14.3.1. By Country

        14.3.2. By Product Type

        14.3.3. By Application

        14.3.4. By Material

        14.3.5. By Blade Material

        14.3.6. By Operating Mode

        14.3.7. By Distribution Channel

    14.4. Key Takeaways

15. East Asia Analysis 2018 to 2022 and Forecast 2023 to 2033, By Country

    15.1. Historical Market Size Value (US$ million) & Volume (MT) Trend Analysis By Market Taxonomy, 2018 to 2022

    15.2. Market Size Value (US$ million) & Volume (MT) Forecast By Market Taxonomy, 2023 to 2033

        15.2.1. By Country

            15.2.1.1. China

            15.2.1.2. Japan

            15.2.1.3. South Korea

        15.2.2. By Product Type

        15.2.3. By Application

        15.2.4. By Material

        15.2.5. By Blade Material

        15.2.6. By Operating Mode

        15.2.7. By Distribution Channel

    15.3. Market Attractiveness Analysis

        15.3.1. By Country

        15.3.2. By Product Type

        15.3.3. By Application

        15.3.4. By Material

        15.3.5. By Blade Material

        15.3.6. By Operating Mode

        15.3.7. By Distribution Channel

    15.4. Key Takeaways

16. South Asia Analysis 2018 to 2022 and Forecast 2023 to 2033, By Country

    16.1. Historical Market Size Value (US$ million) & Volume (MT) Trend Analysis By Market Taxonomy, 2018 to 2022

    16.2. Market Size Value (US$ million) & Volume (MT) Forecast By Market Taxonomy, 2023 to 2033

        16.2.1. By Country

            16.2.1.1. India

            16.2.1.2. Thailand

            16.2.1.3. Malaysia

            16.2.1.4. Indonesia

            16.2.1.5. Singapore

            16.2.1.6. Rest of South Asia

        16.2.2. By Product Type

        16.2.3. By Application

        16.2.4. By Material

        16.2.5. By Blade Material

        16.2.6. By Operating Mode

        16.2.7. By Distribution Channel

    16.3. Market Attractiveness Analysis

        16.3.1. By Country

        16.3.2. By Product Type

        16.3.3. By Application

        16.3.4. By Material

        16.3.5. By Blade Material

        16.3.6. By Operating Mode

        16.3.7. By Distribution Channel

    16.4. Key Takeaways

17. Oceania Analysis 2018 to 2022 and Forecast 2023 to 2033, By Country

    17.1. Historical Market Size Value (US$ million) & Volume (MT) Trend Analysis By Market Taxonomy, 2018 to 2022

    17.2. Market Size Value (US$ million) & Volume (MT) Forecast By Market Taxonomy, 2023 to 2033

        17.2.1. By Country

            17.2.1.1. Australia

            17.2.1.2. New Zealand

        17.2.2. By Product Type

        17.2.3. By Application

        17.2.4. By Material

        17.2.5. By Blade Material

        17.2.6. By Operating Mode

        17.2.7. By Distribution Channel

    17.3. Market Attractiveness Analysis

        17.3.1. By Country

        17.3.2. By Product Type

        17.3.3. By Application

        17.3.4. By Material

        17.3.5. By Blade Material

        17.3.6. By Operating Mode

        17.3.7. By Distribution Channel

    17.4. Key Takeaways

18. MEA Analysis 2018 to 2022 and Forecast 2023 to 2033, By Country

    18.1. Historical Market Size Value (US$ million) & Volume (MT) Trend Analysis By Market Taxonomy, 2018 to 2022

    18.2. Market Size Value (US$ million) & Volume (MT) Forecast By Market Taxonomy, 2023 to 2033

        18.2.1. By Country

            18.2.1.1. GCC Countries

            18.2.1.2. South Africa

            18.2.1.3. Central Africa

            18.2.1.4. North Africa

        18.2.2. By Product Type

        18.2.3. By Application

        18.2.4. By Material

        18.2.5. By Blade Material

        18.2.6. By Operating Mode

        18.2.7. By Distribution Channel

    18.3. Market Attractiveness Analysis

        18.3.1. By Country

        18.3.2. By Product Type

        18.3.3. By Application

        18.3.4. By Material

        18.3.5. By Blade Material

        18.3.6. By Operating Mode

        18.3.7. By Distribution Channel

    18.4. Key Takeaways

19. Key Countries Analysis

    19.1. The USA

        19.1.1. Pricing Analysis

        19.1.2. Market Share Analysis, 2021

            19.1.2.1. By Product Type

            19.1.2.2. By Application

            19.1.2.3. By Material

            19.1.2.4. By Blade Material

            19.1.2.5. By Operating Mode

            19.1.2.6. By Distribution Channel

    19.2. Canada

        19.2.1. Pricing Analysis

        19.2.2. Market Share Analysis, 2021

            19.2.2.1. By Product Type

            19.2.2.2. By Application

            19.2.2.3. By Material

            19.2.2.4. By Blade Material

            19.2.2.5. By Operating Mode

            19.2.2.6. By Distribution Channel

    19.3. Brazil

        19.3.1. Pricing Analysis

        19.3.2. Market Share Analysis, 2021

            19.3.2.1. By Product Type

            19.3.2.2. By Application

            19.3.2.3. By Material

            19.3.2.4. By Blade Material

            19.3.2.5. By Operating Mode

            19.3.2.6. By Distribution Channel

    19.4. Mexico

        19.4.1. Pricing Analysis

        19.4.2. Market Share Analysis, 2021

            19.4.2.1. By Product Type

            19.4.2.2. By Application

            19.4.2.3. By Material

            19.4.2.4. By Blade Material

            19.4.2.5. By Operating Mode

            19.4.2.6. By Distribution Channel

    19.5. Argentina

        19.5.1. Pricing Analysis

        19.5.2. Market Share Analysis, 2021

            19.5.2.1. By Product Type

            19.5.2.2. By Application

            19.5.2.3. By Material

            19.5.2.4. By Blade Material

            19.5.2.5. By Operating Mode

            19.5.2.6. By Distribution Channel

    19.6. Chile

        19.6.1. Pricing Analysis

        19.6.2. Market Share Analysis, 2021

            19.6.2.1. By Product Type

            19.6.2.2. By Application

            19.6.2.3. By Material

            19.6.2.4. By Blade Material

            19.6.2.5. By Operating Mode

            19.6.2.6. By Distribution Channel

    19.7. Peru

        19.7.1. Pricing Analysis

        19.7.2. Market Share Analysis, 2021

            19.7.2.1. By Product Type

            19.7.2.2. By Application

            19.7.2.3. By Material

            19.7.2.4. By Blade Material

            19.7.2.5. By Operating Mode

            19.7.2.6. By Distribution Channel

    19.8. Germany

        19.8.1. Pricing Analysis

        19.8.2. Market Share Analysis, 2021

            19.8.2.1. By Product Type

            19.8.2.2. By Application

            19.8.2.3. By Material

            19.8.2.4. By Blade Material

            19.8.2.5. By Operating Mode

            19.8.2.6. By Distribution Channel

    19.9. Italy

        19.9.1. Pricing Analysis

        19.9.2. Market Share Analysis, 2021

            19.9.2.1. By Product Type

            19.9.2.2. By Application

            19.9.2.3. By Material

            19.9.2.4. By Blade Material

            19.9.2.5. By Operating Mode

            19.9.2.6. By Distribution Channel

    19.10. France

        19.10.1. Pricing Analysis

        19.10.2. Market Share Analysis, 2021

            19.10.2.1. By Product Type

            19.10.2.2. By Application

            19.10.2.3. By Material

            19.10.2.4. By Blade Material

            19.10.2.5. By Operating Mode

            19.10.2.6. By Distribution Channel

    19.11. Spain

        19.11.1. Pricing Analysis

        19.11.2. Market Share Analysis, 2021

            19.11.2.1. By Product Type

            19.11.2.2. By Application

            19.11.2.3. By Material

            19.11.2.4. By Blade Material

            19.11.2.5. By Operating Mode

            19.11.2.6. By Distribution Channel

    19.12. U.K.

        19.12.1. Pricing Analysis

        19.12.2. Market Share Analysis, 2021

            19.12.2.1. By Product Type

            19.12.2.2. By Application

            19.12.2.3. By Material

            19.12.2.4. By Blade Material

            19.12.2.5. By Operating Mode

            19.12.2.6. By Distribution Channel

    19.13. Russia

        19.13.1. Pricing Analysis

        19.13.2. Market Share Analysis, 2021

            19.13.2.1. By Product Type

            19.13.2.2. By Application

            19.13.2.3. By Material

            19.13.2.4. By Blade Material

            19.13.2.5. By Operating Mode

            19.13.2.6. By Distribution Channel

    19.14. Poland

        19.14.1. Pricing Analysis

        19.14.2. Market Share Analysis, 2021

            19.14.2.1. By Product Type

            19.14.2.2. By Application

            19.14.2.3. By Material

            19.14.2.4. By Blade Material

            19.14.2.5. By Operating Mode

            19.14.2.6. By Distribution Channel

    19.15. BENELUX

        19.15.1. Pricing Analysis

        19.15.2. Market Share Analysis, 2021

            19.15.2.1. By Product Type

            19.15.2.2. By Application

            19.15.2.3. By Material

            19.15.2.4. By Blade Material

            19.15.2.5. By Operating Mode

            19.15.2.6. By Distribution Channel

    19.16. Nordic Countries

        19.16.1. Pricing Analysis

        19.16.2. Market Share Analysis, 2021

            19.16.2.1. By Product Type

            19.16.2.2. By Application

            19.16.2.3. By Material

            19.16.2.4. By Blade Material

            19.16.2.5. By Operating Mode

            19.16.2.6. By Distribution Channel

    19.17. China

        19.17.1. Pricing Analysis

        19.17.2. Market Share Analysis, 2021

            19.17.2.1. By Product Type

            19.17.2.2. By Application

            19.17.2.3. By Material

            19.17.2.4. By Blade Material

            19.17.2.5. By Operating Mode

            19.17.2.6. By Distribution Channel

    19.18. Japan

        19.18.1. Pricing Analysis

        19.18.2. Market Share Analysis, 2021

            19.18.2.1. By Product Type

            19.18.2.2. By Application

            19.18.2.3. By Material

            19.18.2.4. By Blade Material

            19.18.2.5. By Operating Mode

            19.18.2.6. By Distribution Channel

    19.19. South Korea

        19.19.1. Pricing Analysis

        19.19.2. Market Share Analysis, 2021

            19.19.2.1. By Product Type

            19.19.2.2. By Application

            19.19.2.3. By Material

            19.19.2.4. By Blade Material

            19.19.2.5. By Operating Mode

            19.19.2.6. By Distribution Channel

    19.20. India

        19.20.1. Pricing Analysis

        19.20.2. Market Share Analysis, 2021

            19.20.2.1. By Product Type

            19.20.2.2. By Application

            19.20.2.3. By Material

            19.20.2.4. By Blade Material

            19.20.2.5. By Operating Mode

            19.20.2.6. By Distribution Channel

    19.21. Thailand

        19.21.1. Pricing Analysis

        19.21.2. Market Share Analysis, 2021

            19.21.2.1. By Product Type

            19.21.2.2. By Application

            19.21.2.3. By Material

            19.21.2.4. By Blade Material

            19.21.2.5. By Operating Mode

            19.21.2.6. By Distribution Channel

    19.22. Indonesia

        19.22.1. Pricing Analysis

        19.22.2. Market Share Analysis, 2021

            19.22.2.1. By Product Type

            19.22.2.2. By Application

            19.22.2.3. By Material

            19.22.2.4. By Blade Material

            19.22.2.5. By Operating Mode

            19.22.2.6. By Distribution Channel

    19.23. Malaysia

        19.23.1. Pricing Analysis

        19.23.2. Market Share Analysis, 2021

            19.23.2.1. By Product Type

            19.23.2.2. By Application

            19.23.2.3. By Material

            19.23.2.4. By Blade Material

            19.23.2.5. By Operating Mode

            19.23.2.6. By Distribution Channel

    19.24. Singapore

        19.24.1. Pricing Analysis

        19.24.2. Market Share Analysis, 2021

            19.24.2.1. By Product Type

            19.24.2.2. By Application

            19.24.2.3. By Material

            19.24.2.4. By Blade Material

            19.24.2.5. By Operating Mode

            19.24.2.6. By Distribution Channel

    19.25. Australia

        19.25.1. Pricing Analysis

        19.25.2. Market Share Analysis, 2021

            19.25.2.1. By Product Type

            19.25.2.2. By Application

            19.25.2.3. By Material

            19.25.2.4. By Blade Material

            19.25.2.5. By Operating Mode

            19.25.2.6. By Distribution Channel

    19.26. New Zealand

        19.26.1. Pricing Analysis

        19.26.2. Market Share Analysis, 2021

            19.26.2.1. By Product Type

            19.26.2.2. By Application

            19.26.2.3. By Material

            19.26.2.4. By Blade Material

            19.26.2.5. By Operating Mode

            19.26.2.6. By Distribution Channel

    19.27. GCC Countries

        19.27.1. Pricing Analysis

        19.27.2. Market Share Analysis, 2021

            19.27.2.1. By Product Type

            19.27.2.2. By Application

            19.27.2.3. By Material

            19.27.2.4. By Blade Material

            19.27.2.5. By Operating Mode

            19.27.2.6. By Distribution Channel

    19.28. South Africa

        19.28.1. Pricing Analysis

        19.28.2. Market Share Analysis, 2021

            19.28.2.1. By Product Type

            19.28.2.2. By Application

            19.28.2.3. By Material

            19.28.2.4. By Blade Material

            19.28.2.5. By Operating Mode

            19.28.2.6. By Distribution Channel

    19.29. North Africa

        19.29.1. Pricing Analysis

        19.29.2. Market Share Analysis, 2021

            19.29.2.1. By Product Type

            19.29.2.2. By Application

            19.29.2.3. By Material

            19.29.2.4. By Blade Material

            19.29.2.5. By Operating Mode

            19.29.2.6. By Distribution Channel

    19.30. Central Africa

        19.30.1. Pricing Analysis

        19.30.2. Market Share Analysis, 2021

            19.30.2.1. By Product Type

            19.30.2.2. By Application

            19.30.2.3. By Material

            19.30.2.4. By Blade Material

            19.30.2.5. By Operating Mode

            19.30.2.6. By Distribution Channel

20. Market Structure Analysis

    20.1. Competition Dashboard

    20.2. Competition Benchmarking

    20.3. Market Share Analysis of Top Players

        20.3.1. By Regional

        20.3.2. By Product Type

        20.3.3. By Application

        20.3.4. By Material

        20.3.5. By Blade Material

        20.3.6. By Operating Mode

        20.3.7. By Distribution Channel

21. Competition Analysis

    21.1. Competition Deep Dive

        21.1.1. Omcan

            21.1.1.1. Overview

            21.1.1.2. Product Portfolio

            21.1.1.3. Profitability by Market Segments (Product/Age /Sales Channel/Region)

            21.1.1.4. Sales Footprint

            21.1.1.5. Strategy Overview

                21.1.1.5.1. Marketing Strategy

                21.1.1.5.2. Product Strategy

                21.1.1.5.3. Channel Strategy

        21.1.2. ALFA International

            21.1.2.1. Overview

            21.1.2.2. Product Portfolio

            21.1.2.3. Profitability by Market Segments (Product/Age /Sales Channel/Region)

            21.1.2.4. Sales Footprint

            21.1.2.5. Strategy Overview

                21.1.2.5.1. Marketing Strategy

                21.1.2.5.2. Product Strategy

                21.1.2.5.3. Channel Strategy

        21.1.3. Nemco Food Equipment

            21.1.3.1. Overview

            21.1.3.2. Product Portfolio

            21.1.3.3. Profitability by Market Segments (Product/Age /Sales Channel/Region)

            21.1.3.4. Sales Footprint

            21.1.3.5. Strategy Overview

                21.1.3.5.1. Marketing Strategy

                21.1.3.5.2. Product Strategy

                21.1.3.5.3. Channel Strategy

        21.1.4. The Vollrath Company

            21.1.4.1. Overview

            21.1.4.2. Product Portfolio

            21.1.4.3. Profitability by Market Segments (Product/Age /Sales Channel/Region)

            21.1.4.4. Sales Footprint

            21.1.4.5. Strategy Overview

                21.1.4.5.1. Marketing Strategy

                21.1.4.5.2. Product Strategy

                21.1.4.5.3. Channel Strategy

        21.1.5. Norpro

            21.1.5.1. Overview

            21.1.5.2. Product Portfolio

            21.1.5.3. Profitability by Market Segments (Product/Age /Sales Channel/Region)

            21.1.5.4. Sales Footprint

            21.1.5.5. Strategy Overview

                21.1.5.5.1. Marketing Strategy

                21.1.5.5.2. Product Strategy

                21.1.5.5.3. Channel Strategy

        21.1.6. Thunder group

            21.1.6.1. Overview

            21.1.6.2. Product Portfolio

            21.1.6.3. Profitability by Market Segments (Product/Age /Sales Channel/Region)

            21.1.6.4. Sales Footprint

            21.1.6.5. Strategy Overview

                21.1.6.5.1. Marketing Strategy

                21.1.6.5.2. Product Strategy

                21.1.6.5.3. Channel Strategy

        21.1.7. Browne Food Service

            21.1.7.1. Overview

            21.1.7.2. Product Portfolio

            21.1.7.3. Profitability by Market Segments (Product/Age /Sales Channel/Region)

            21.1.7.4. Sales Footprint

            21.1.7.5. Strategy Overview

                21.1.7.5.1. Marketing Strategy

                21.1.7.5.2. Product Strategy

                21.1.7.5.3. Channel Strategy

        21.1.8. Robot Coupe

            21.1.8.1. Overview

            21.1.8.2. Product Portfolio

            21.1.8.3. Profitability by Market Segments (Product/Age /Sales Channel/Region)

            21.1.8.4. Sales Footprint

            21.1.8.5. Strategy Overview

                21.1.8.5.1. Marketing Strategy

                21.1.8.5.2. Product Strategy

                21.1.8.5.3. Channel Strategy

        21.1.9. Traditional catering products

            21.1.9.1. Overview

            21.1.9.2. Product Portfolio

            21.1.9.3. Profitability by Market Segments (Product/Age /Sales Channel/Region)

            21.1.9.4. Sales Footprint

            21.1.9.5. Strategy Overview

                21.1.9.5.1. Marketing Strategy

                21.1.9.5.2. Product Strategy

                21.1.9.5.3. Channel Strategy

        21.1.10. Uniworld Food Service Equipment

            21.1.10.1. Overview

            21.1.10.2. Product Portfolio

            21.1.10.3. Profitability by Market Segments (Product/Age /Sales Channel/Region)

            21.1.10.4. Sales Footprint

            21.1.10.5. Strategy Overview

                21.1.10.5.1. Marketing Strategy

                21.1.10.5.2. Product Strategy

                21.1.10.5.3. Channel Strategy

        21.1.11. Crown Marks

            21.1.11.1. Overview

            21.1.11.2. Product Portfolio

            21.1.11.3. Profitability by Market Segments (Product/Age /Sales Channel/Region)

            21.1.11.4. Sales Footprint

            21.1.11.5. Strategy Overview

                21.1.11.5.1. Marketing Strategy

                21.1.11.5.2. Product Strategy

                21.1.11.5.3. Channel Strategy

        21.1.12. Matfer Bourgeat Value (US$ million) & Volume (MT)ed States

            21.1.12.1. Overview

            21.1.12.2. Product Portfolio

            21.1.12.3. Profitability by Market Segments (Product/Age /Sales Channel/Region)

            21.1.12.4. Sales Footprint

            21.1.12.5. Strategy Overview

                21.1.12.5.1. Marketing Strategy

                21.1.12.5.2. Product Strategy

                21.1.12.5.3. Channel Strategy

        21.1.13. TigerChef

            21.1.13.1. Overview

            21.1.13.2. Product Portfolio

            21.1.13.3. Profitability by Market Segments (Product/Age /Sales Channel/Region)

            21.1.13.4. Sales Footprint

            21.1.13.5. Strategy Overview

                21.1.13.5.1. Marketing Strategy

                21.1.13.5.2. Product Strategy

                21.1.13.5.3. Channel Strategy

        21.1.14. Edlund Company

            21.1.14.1. Overview

            21.1.14.2. Product Portfolio

            21.1.14.3. Profitability by Market Segments (Product/Age /Sales Channel/Region)

            21.1.14.4. Sales Footprint

            21.1.14.5. Strategy Overview

                21.1.14.5.1. Marketing Strategy

                21.1.14.5.2. Product Strategy

                21.1.14.5.3. Channel Strategy

22. Assumptions & Acronyms Used

23. Research Methodology

List of Tables

Table 1: Global Value (US$ million) Forecast by Region, 2018 to 2033

Table 2: Global Volume (MT) Forecast by Region, 2018 to 2033

Table 3: Global Value (US$ million) Forecast by Product Type, 2018 to 2033

Table 4: Global Volume (MT) Forecast by Product Type, 2018 to 2033

Table 5: Global Value (US$ million) Forecast by Application, 2018 to 2033

Table 6: Global Volume (MT) Forecast by Application, 2018 to 2033

Table 7: Global Value (US$ million) Forecast by Material, 2018 to 2033

Table 8: Global Volume (MT) Forecast by Material, 2018 to 2033

Table 9: Global Value (US$ million) Forecast by Blade Material, 2018 to 2033

Table 10: Global Volume (MT) Forecast by Blade Material, 2018 to 2033

Table 11: Global Value (US$ million) Forecast by Operating Mode, 2018 to 2033

Table 12: Global Volume (MT) Forecast by Operating Mode, 2018 to 2033

Table 13: Global Value (US$ million) Forecast by Distribution Channel, 2018 to 2033

Table 14: Global Volume (MT) Forecast by Distribution Channel, 2018 to 2033

Table 15: North America Value (US$ million) Forecast by Country, 2018 to 2033

Table 16: North America Volume (MT) Forecast by Country, 2018 to 2033

Table 17: North America Value (US$ million) Forecast by Product Type, 2018 to 2033

Table 18: North America Volume (MT) Forecast by Product Type, 2018 to 2033

Table 19: North America Value (US$ million) Forecast by Application, 2018 to 2033

Table 20: North America Volume (MT) Forecast by Application, 2018 to 2033

Table 21: North America Value (US$ million) Forecast by Material, 2018 to 2033

Table 22: North America Volume (MT) Forecast by Material, 2018 to 2033

Table 23: North America Value (US$ million) Forecast by Blade Material, 2018 to 2033

Table 24: North America Volume (MT) Forecast by Blade Material, 2018 to 2033

Table 25: North America Value (US$ million) Forecast by Operating Mode, 2018 to 2033

Table 26: North America Volume (MT) Forecast by Operating Mode, 2018 to 2033

Table 27: North America Value (US$ million) Forecast by Distribution Channel, 2018 to 2033

Table 28: North America Volume (MT) Forecast by Distribution Channel, 2018 to 2033

Table 29: Latin America Value (US$ million) Forecast by Country, 2018 to 2033

Table 30: Latin America Volume (MT) Forecast by Country, 2018 to 2033

Table 31: Latin America Value (US$ million) Forecast by Product Type, 2018 to 2033

Table 32: Latin America Volume (MT) Forecast by Product Type, 2018 to 2033

Table 33: Latin America Value (US$ million) Forecast by Application, 2018 to 2033

Table 34: Latin America Volume (MT) Forecast by Application, 2018 to 2033

Table 35: Latin America Value (US$ million) Forecast by Material, 2018 to 2033

Table 36: Latin America Volume (MT) Forecast by Material, 2018 to 2033

Table 37: Latin America Value (US$ million) Forecast by Blade Material, 2018 to 2033

Table 38: Latin America Volume (MT) Forecast by Blade Material, 2018 to 2033

Table 39: Latin America Value (US$ million) Forecast by Operating Mode, 2018 to 2033

Table 40: Latin America Volume (MT) Forecast by Operating Mode, 2018 to 2033

Table 41: Latin America Value (US$ million) Forecast by Distribution Channel, 2018 to 2033

Table 42: Latin America Volume (MT) Forecast by Distribution Channel, 2018 to 2033

Table 43: Europe Value (US$ million) Forecast by Country, 2018 to 2033

Table 44: Europe Volume (MT) Forecast by Country, 2018 to 2033

Table 45: Europe Value (US$ million) Forecast by Product Type, 2018 to 2033

Table 46: Europe Volume (MT) Forecast by Product Type, 2018 to 2033

Table 47: Europe Value (US$ million) Forecast by Application, 2018 to 2033

Table 48: Europe Volume (MT) Forecast by Application, 2018 to 2033

Table 49: Europe Value (US$ million) Forecast by Material, 2018 to 2033

Table 50: Europe Volume (MT) Forecast by Material, 2018 to 2033

Table 51: Europe Value (US$ million) Forecast by Blade Material, 2018 to 2033

Table 52: Europe Volume (MT) Forecast by Blade Material, 2018 to 2033

Table 53: Europe Value (US$ million) Forecast by Operating Mode, 2018 to 2033

Table 54: Europe Volume (MT) Forecast by Operating Mode, 2018 to 2033

Table 55: Europe Value (US$ million) Forecast by Distribution Channel, 2018 to 2033

Table 56: Europe Volume (MT) Forecast by Distribution Channel, 2018 to 2033

Table 57: East Asia Value (US$ million) Forecast by Country, 2018 to 2033

Table 58: East Asia Volume (MT) Forecast by Country, 2018 to 2033

Table 59: East Asia Value (US$ million) Forecast by Product Type, 2018 to 2033

Table 60: East Asia Volume (MT) Forecast by Product Type, 2018 to 2033

Table 61: East Asia Value (US$ million) Forecast by Application, 2018 to 2033

Table 62: East Asia Volume (MT) Forecast by Application, 2018 to 2033

Table 63: East Asia Value (US$ million) Forecast by Material, 2018 to 2033

Table 64: East Asia Volume (MT) Forecast by Material, 2018 to 2033

Table 65: East Asia Value (US$ million) Forecast by Blade Material, 2018 to 2033

Table 66: East Asia Volume (MT) Forecast by Blade Material, 2018 to 2033

Table 67: East Asia Value (US$ million) Forecast by Operating Mode, 2018 to 2033

Table 68: East Asia Volume (MT) Forecast by Operating Mode, 2018 to 2033

Table 69: East Asia Value (US$ million) Forecast by Distribution Channel, 2018 to 2033

Table 70: East Asia Volume (MT) Forecast by Distribution Channel, 2018 to 2033

Table 71: South Asia Value (US$ million) Forecast by Country, 2018 to 2033

Table 72: South Asia Volume (MT) Forecast by Country, 2018 to 2033

Table 73: South Asia Value (US$ million) Forecast by Product Type, 2018 to 2033

Table 74: South Asia Volume (MT) Forecast by Product Type, 2018 to 2033

Table 75: South Asia Value (US$ million) Forecast by Application, 2018 to 2033

Table 76: South Asia Volume (MT) Forecast by Application, 2018 to 2033

Table 77: South Asia Value (US$ million) Forecast by Material, 2018 to 2033

Table 78: South Asia Volume (MT) Forecast by Material, 2018 to 2033

Table 79: South Asia Value (US$ million) Forecast by Blade Material, 2018 to 2033

Table 80: South Asia Volume (MT) Forecast by Blade Material, 2018 to 2033

Table 81: South Asia Value (US$ million) Forecast by Operating Mode, 2018 to 2033

Table 82: South Asia Volume (MT) Forecast by Operating Mode, 2018 to 2033

Table 83: South Asia Value (US$ million) Forecast by Distribution Channel, 2018 to 2033

Table 84: South Asia Volume (MT) Forecast by Distribution Channel, 2018 to 2033

Table 85: Oceania Value (US$ million) Forecast by Country, 2018 to 2033

Table 86: Oceania Volume (MT) Forecast by Country, 2018 to 2033

Table 87: Oceania Value (US$ million) Forecast by Product Type, 2018 to 2033

Table 88: Oceania Volume (MT) Forecast by Product Type, 2018 to 2033

Table 89: Oceania Value (US$ million) Forecast by Application, 2018 to 2033

Table 90: Oceania Volume (MT) Forecast by Application, 2018 to 2033

Table 91: Oceania Value (US$ million) Forecast by Material, 2018 to 2033

Table 92: Oceania Volume (MT) Forecast by Material, 2018 to 2033

Table 93: Oceania Value (US$ million) Forecast by Blade Material, 2018 to 2033

Table 94: Oceania Volume (MT) Forecast by Blade Material, 2018 to 2033

Table 95: Oceania Value (US$ million) Forecast by Operating Mode, 2018 to 2033

Table 96: Oceania Volume (MT) Forecast by Operating Mode, 2018 to 2033

Table 97: Oceania Value (US$ million) Forecast by Distribution Channel, 2018 to 2033

Table 98: Oceania Volume (MT) Forecast by Distribution Channel, 2018 to 2033

Table 99: MEA Value (US$ million) Forecast by Country, 2018 to 2033

Table 100: MEA Volume (MT) Forecast by Country, 2018 to 2033

Table 101: MEA Value (US$ million) Forecast by Product Type, 2018 to 2033

Table 102: MEA Volume (MT) Forecast by Product Type, 2018 to 2033

Table 103: MEA Value (US$ million) Forecast by Application, 2018 to 2033

Table 104: MEA Volume (MT) Forecast by Application, 2018 to 2033

Table 105: MEA Value (US$ million) Forecast by Material, 2018 to 2033

Table 106: MEA Volume (MT) Forecast by Material, 2018 to 2033

Table 107: MEA Value (US$ million) Forecast by Blade Material, 2018 to 2033

Table 108: MEA Volume (MT) Forecast by Blade Material, 2018 to 2033

Table 109: MEA Value (US$ million) Forecast by Operating Mode, 2018 to 2033

Table 110: MEA Volume (MT) Forecast by Operating Mode, 2018 to 2033

Table 111: MEA Value (US$ million) Forecast by Distribution Channel, 2018 to 2033

Table 112: MEA Volume (MT) Forecast by Distribution Channel, 2018 to 2033

List of Charts

Figure 1: Global Value (US$ million) by Product Type, 2023 to 2033

Figure 2: Global Value (US$ million) by Application, 2023 to 2033

Figure 3: Global Value (US$ million) by Material, 2023 to 2033

Figure 4: Global Value (US$ million) by Blade Material, 2023 to 2033

Figure 5: Global Value (US$ million) by Operating Mode, 2023 to 2033

Figure 6: Global Value (US$ million) by Distribution Channel, 2023 to 2033

Figure 7: Global Value (US$ million) by Region, 2023 to 2033

Figure 8: Global Value (US$ million) Analysis by Region, 2018 to 2033

Figure 9: Global Volume (MT) Analysis by Region, 2018 to 2033

Figure 10: Global Value Share (%) and BPS Analysis by Region, 2023 to 2033

Figure 11: Global Y-o-Y Growth (%) Projections by Region, 2023 to 2033

Figure 12: Global Value (US$ million) Analysis by Product Type, 2018 to 2033

Figure 13: Global Volume (MT) Analysis by Product Type, 2018 to 2033

Figure 14: Global Value Share (%) and BPS Analysis by Product Type, 2023 to 2033

Figure 15: Global Y-o-Y Growth (%) Projections by Product Type, 2023 to 2033

Figure 16: Global Value (US$ million) Analysis by Application, 2018 to 2033

Figure 17: Global Volume (MT) Analysis by Application, 2018 to 2033

Figure 18: Global Value Share (%) and BPS Analysis by Application, 2023 to 2033

Figure 19: Global Y-o-Y Growth (%) Projections by Application, 2023 to 2033

Figure 20: Global Value (US$ million) Analysis by Material, 2018 to 2033

Figure 21: Global Volume (MT) Analysis by Material, 2018 to 2033

Figure 22: Global Value Share (%) and BPS Analysis by Material, 2023 to 2033

Figure 23: Global Y-o-Y Growth (%) Projections by Material, 2023 to 2033

Figure 24: Global Value (US$ million) Analysis by Blade Material, 2018 to 2033

Figure 25: Global Volume (MT) Analysis by Blade Material, 2018 to 2033

Figure 26: Global Value Share (%) and BPS Analysis by Blade Material, 2023 to 2033

Figure 27: Global Y-o-Y Growth (%) Projections by Blade Material, 2023 to 2033

Figure 28: Global Value (US$ million) Analysis by Operating Mode, 2018 to 2033

Figure 29: Global Volume (MT) Analysis by Operating Mode, 2018 to 2033

Figure 30: Global Value Share (%) and BPS Analysis by Operating Mode, 2023 to 2033

Figure 31: Global Y-o-Y Growth (%) Projections by Operating Mode, 2023 to 2033

Figure 32: Global Value (US$ million) Analysis by Distribution Channel, 2018 to 2033

Figure 33: Global Volume (MT) Analysis by Distribution Channel, 2018 to 2033

Figure 34: Global Value Share (%) and BPS Analysis by Distribution Channel, 2023 to 2033

Figure 35: Global Y-o-Y Growth (%) Projections by Distribution Channel, 2023 to 2033

Figure 36: Global Attractiveness by Product Type, 2023 to 2033

Figure 37: Global Attractiveness by Application, 2023 to 2033

Figure 38: Global Attractiveness by Material, 2023 to 2033

Figure 39: Global Attractiveness by Blade Material, 2023 to 2033

Figure 40: Global Attractiveness by Operating Mode, 2023 to 2033

Figure 41: Global Attractiveness by Distribution Channel, 2023 to 2033

Figure 42: Global Attractiveness by Region, 2023 to 2033

Figure 43: North America Value (US$ million) by Product Type, 2023 to 2033

Figure 44: North America Value (US$ million) by Application, 2023 to 2033

Figure 45: North America Value (US$ million) by Material, 2023 to 2033

Figure 46: North America Value (US$ million) by Blade Material, 2023 to 2033

Figure 47: North America Value (US$ million) by Operating Mode, 2023 to 2033

Figure 48: North America Value (US$ million) by Distribution Channel, 2023 to 2033

Figure 49: North America Value (US$ million) by Country, 2023 to 2033

Figure 50: North America Value (US$ million) Analysis by Country, 2018 to 2033

Figure 51: North America Volume (MT) Analysis by Country, 2018 to 2033

Figure 52: North America Value Share (%) and BPS Analysis by Country, 2023 to 2033

Figure 53: North America Y-o-Y Growth (%) Projections by Country, 2023 to 2033

Figure 54: North America Value (US$ million) Analysis by Product Type, 2018 to 2033

Figure 55: North America Volume (MT) Analysis by Product Type, 2018 to 2033

Figure 56: North America Value Share (%) and BPS Analysis by Product Type, 2023 to 2033

Figure 57: North America Y-o-Y Growth (%) Projections by Product Type, 2023 to 2033

Figure 58: North America Value (US$ million) Analysis by Application, 2018 to 2033

Figure 59: North America Volume (MT) Analysis by Application, 2018 to 2033

Figure 60: North America Value Share (%) and BPS Analysis by Application, 2023 to 2033

Figure 61: North America Y-o-Y Growth (%) Projections by Application, 2023 to 2033

Figure 62: North America Value (US$ million) Analysis by Material, 2018 to 2033

Figure 63: North America Volume (MT) Analysis by Material, 2018 to 2033

Figure 64: North America Value Share (%) and BPS Analysis by Material, 2023 to 2033

Figure 65: North America Y-o-Y Growth (%) Projections by Material, 2023 to 2033

Figure 66: North America Value (US$ million) Analysis by Blade Material, 2018 to 2033

Figure 67: North America Volume (MT) Analysis by Blade Material, 2018 to 2033

Figure 68: North America Value Share (%) and BPS Analysis by Blade Material, 2023 to 2033

Figure 69: North America Y-o-Y Growth (%) Projections by Blade Material, 2023 to 2033

Figure 70: North America Value (US$ million) Analysis by Operating Mode, 2018 to 2033

Figure 71: North America Volume (MT) Analysis by Operating Mode, 2018 to 2033

Figure 72: North America Value Share (%) and BPS Analysis by Operating Mode, 2023 to 2033

Figure 73: North America Y-o-Y Growth (%) Projections by Operating Mode, 2023 to 2033

Figure 74: North America Value (US$ million) Analysis by Distribution Channel, 2018 to 2033

Figure 75: North America Volume (MT) Analysis by Distribution Channel, 2018 to 2033

Figure 76: North America Value Share (%) and BPS Analysis by Distribution Channel, 2023 to 2033

Figure 77: North America Y-o-Y Growth (%) Projections by Distribution Channel, 2023 to 2033

Figure 78: North America Attractiveness by Product Type, 2023 to 2033

Figure 79: North America Attractiveness by Application, 2023 to 2033

Figure 80: North America Attractiveness by Material, 2023 to 2033

Figure 81: North America Attractiveness by Blade Material, 2023 to 2033

Figure 82: North America Attractiveness by Operating Mode, 2023 to 2033

Figure 83: North America Attractiveness by Distribution Channel, 2023 to 2033

Figure 84: North America Attractiveness by Country, 2023 to 2033

Figure 85: Latin America Value (US$ million) by Product Type, 2023 to 2033

Figure 86: Latin America Value (US$ million) by Application, 2023 to 2033

Figure 87: Latin America Value (US$ million) by Material, 2023 to 2033

Figure 88: Latin America Value (US$ million) by Blade Material, 2023 to 2033

Figure 89: Latin America Value (US$ million) by Operating Mode, 2023 to 2033

Figure 90: Latin America Value (US$ million) by Distribution Channel, 2023 to 2033

Figure 91: Latin America Value (US$ million) by Country, 2023 to 2033

Figure 92: Latin America Value (US$ million) Analysis by Country, 2018 to 2033

Figure 93: Latin America Volume (MT) Analysis by Country, 2018 to 2033

Figure 94: Latin America Value Share (%) and BPS Analysis by Country, 2023 to 2033

Figure 95: Latin America Y-o-Y Growth (%) Projections by Country, 2023 to 2033

Figure 96: Latin America Value (US$ million) Analysis by Product Type, 2018 to 2033

Figure 97: Latin America Volume (MT) Analysis by Product Type, 2018 to 2033

Figure 98: Latin America Value Share (%) and BPS Analysis by Product Type, 2023 to 2033

Figure 99: Latin America Y-o-Y Growth (%) Projections by Product Type, 2023 to 2033

Figure 100: Latin America Value (US$ million) Analysis by Application, 2018 to 2033

Figure 101: Latin America Volume (MT) Analysis by Application, 2018 to 2033

Figure 102: Latin America Value Share (%) and BPS Analysis by Application, 2023 to 2033

Figure 103: Latin America Y-o-Y Growth (%) Projections by Application, 2023 to 2033

Figure 104: Latin America Value (US$ million) Analysis by Material, 2018 to 2033

Figure 105: Latin America Volume (MT) Analysis by Material, 2018 to 2033

Figure 106: Latin America Value Share (%) and BPS Analysis by Material, 2023 to 2033

Figure 107: Latin America Y-o-Y Growth (%) Projections by Material, 2023 to 2033

Figure 108: Latin America Value (US$ million) Analysis by Blade Material, 2018 to 2033

Figure 109: Latin America Volume (MT) Analysis by Blade Material, 2018 to 2033

Figure 110: Latin America Value Share (%) and BPS Analysis by Blade Material, 2023 to 2033

Figure 111: Latin America Y-o-Y Growth (%) Projections by Blade Material, 2023 to 2033

Figure 112: Latin America Value (US$ million) Analysis by Operating Mode, 2018 to 2033

Figure 113: Latin America Volume (MT) Analysis by Operating Mode, 2018 to 2033

Figure 114: Latin America Value Share (%) and BPS Analysis by Operating Mode, 2023 to 2033

Figure 115: Latin America Y-o-Y Growth (%) Projections by Operating Mode, 2023 to 2033

Figure 116: Latin America Value (US$ million) Analysis by Distribution Channel, 2018 to 2033

Figure 117: Latin America Volume (MT) Analysis by Distribution Channel, 2018 to 2033

Figure 118: Latin America Value Share (%) and BPS Analysis by Distribution Channel, 2023 to 2033

Figure 119: Latin America Y-o-Y Growth (%) Projections by Distribution Channel, 2023 to 2033

Figure 120: Latin America Attractiveness by Product Type, 2023 to 2033

Figure 121: Latin America Attractiveness by Application, 2023 to 2033

Figure 122: Latin America Attractiveness by Material, 2023 to 2033

Figure 123: Latin America Attractiveness by Blade Material, 2023 to 2033

Figure 124: Latin America Attractiveness by Operating Mode, 2023 to 2033

Figure 125: Latin America Attractiveness by Distribution Channel, 2023 to 2033

Figure 126: Latin America Attractiveness by Country, 2023 to 2033

Figure 127: Europe Value (US$ million) by Product Type, 2023 to 2033

Figure 128: Europe Value (US$ million) by Application, 2023 to 2033

Figure 129: Europe Value (US$ million) by Material, 2023 to 2033

Figure 130: Europe Value (US$ million) by Blade Material, 2023 to 2033

Figure 131: Europe Value (US$ million) by Operating Mode, 2023 to 2033

Figure 132: Europe Value (US$ million) by Distribution Channel, 2023 to 2033

Figure 133: Europe Value (US$ million) by Country, 2023 to 2033

Figure 134: Europe Value (US$ million) Analysis by Country, 2018 to 2033

Figure 135: Europe Volume (MT) Analysis by Country, 2018 to 2033

Figure 136: Europe Value Share (%) and BPS Analysis by Country, 2023 to 2033

Figure 137: Europe Y-o-Y Growth (%) Projections by Country, 2023 to 2033

Figure 138: Europe Value (US$ million) Analysis by Product Type, 2018 to 2033

Figure 139: Europe Volume (MT) Analysis by Product Type, 2018 to 2033

Figure 140: Europe Value Share (%) and BPS Analysis by Product Type, 2023 to 2033

Figure 141: Europe Y-o-Y Growth (%) Projections by Product Type, 2023 to 2033

Figure 142: Europe Value (US$ million) Analysis by Application, 2018 to 2033

Figure 143: Europe Volume (MT) Analysis by Application, 2018 to 2033

Figure 144: Europe Value Share (%) and BPS Analysis by Application, 2023 to 2033

Figure 145: Europe Y-o-Y Growth (%) Projections by Application, 2023 to 2033

Figure 146: Europe Value (US$ million) Analysis by Material, 2018 to 2033

Figure 147: Europe Volume (MT) Analysis by Material, 2018 to 2033

Figure 148: Europe Value Share (%) and BPS Analysis by Material, 2023 to 2033

Figure 149: Europe Y-o-Y Growth (%) Projections by Material, 2023 to 2033

Figure 150: Europe Value (US$ million) Analysis by Blade Material, 2018 to 2033

Figure 151: Europe Volume (MT) Analysis by Blade Material, 2018 to 2033

Figure 152: Europe Value Share (%) and BPS Analysis by Blade Material, 2023 to 2033

Figure 153: Europe Y-o-Y Growth (%) Projections by Blade Material, 2023 to 2033

Figure 154: Europe Value (US$ million) Analysis by Operating Mode, 2018 to 2033

Figure 155: Europe Volume (MT) Analysis by Operating Mode, 2018 to 2033

Figure 156: Europe Value Share (%) and BPS Analysis by Operating Mode, 2023 to 2033

Figure 157: Europe Y-o-Y Growth (%) Projections by Operating Mode, 2023 to 2033

Figure 158: Europe Value (US$ million) Analysis by Distribution Channel, 2018 to 2033

Figure 159: Europe Volume (MT) Analysis by Distribution Channel, 2018 to 2033

Figure 160: Europe Value Share (%) and BPS Analysis by Distribution Channel, 2023 to 2033

Figure 161: Europe Y-o-Y Growth (%) Projections by Distribution Channel, 2023 to 2033

Figure 162: Europe Attractiveness by Product Type, 2023 to 2033

Figure 163: Europe Attractiveness by Application, 2023 to 2033

Figure 164: Europe Attractiveness by Material, 2023 to 2033

Figure 165: Europe Attractiveness by Blade Material, 2023 to 2033

Figure 166: Europe Attractiveness by Operating Mode, 2023 to 2033

Figure 167: Europe Attractiveness by Distribution Channel, 2023 to 2033

Figure 168: Europe Attractiveness by Country, 2023 to 2033

Figure 169: East Asia Value (US$ million) by Product Type, 2023 to 2033

Figure 170: East Asia Value (US$ million) by Application, 2023 to 2033

Figure 171: East Asia Value (US$ million) by Material, 2023 to 2033

Figure 172: East Asia Value (US$ million) by Blade Material, 2023 to 2033

Figure 173: East Asia Value (US$ million) by Operating Mode, 2023 to 2033

Figure 174: East Asia Value (US$ million) by Distribution Channel, 2023 to 2033

Figure 175: East Asia Value (US$ million) by Country, 2023 to 2033

Figure 176: East Asia Value (US$ million) Analysis by Country, 2018 to 2033

Figure 177: East Asia Volume (MT) Analysis by Country, 2018 to 2033

Figure 178: East Asia Value Share (%) and BPS Analysis by Country, 2023 to 2033

Figure 179: East Asia Y-o-Y Growth (%) Projections by Country, 2023 to 2033

Figure 180: East Asia Value (US$ million) Analysis by Product Type, 2018 to 2033

Figure 181: East Asia Volume (MT) Analysis by Product Type, 2018 to 2033

Figure 182: East Asia Value Share (%) and BPS Analysis by Product Type, 2023 to 2033

Figure 183: East Asia Y-o-Y Growth (%) Projections by Product Type, 2023 to 2033

Figure 184: East Asia Value (US$ million) Analysis by Application, 2018 to 2033

Figure 185: East Asia Volume (MT) Analysis by Application, 2018 to 2033

Figure 186: East Asia Value Share (%) and BPS Analysis by Application, 2023 to 2033

Figure 187: East Asia Y-o-Y Growth (%) Projections by Application, 2023 to 2033

Figure 188: East Asia Value (US$ million) Analysis by Material, 2018 to 2033

Figure 189: East Asia Volume (MT) Analysis by Material, 2018 to 2033

Figure 190: East Asia Value Share (%) and BPS Analysis by Material, 2023 to 2033

Figure 191: East Asia Y-o-Y Growth (%) Projections by Material, 2023 to 2033

Figure 192: East Asia Value (US$ million) Analysis by Blade Material, 2018 to 2033

Figure 193: East Asia Volume (MT) Analysis by Blade Material, 2018 to 2033

Figure 194: East Asia Value Share (%) and BPS Analysis by Blade Material, 2023 to 2033

Figure 195: East Asia Y-o-Y Growth (%) Projections by Blade Material, 2023 to 2033

Figure 196: East Asia Value (US$ million) Analysis by Operating Mode, 2018 to 2033

Figure 197: East Asia Volume (MT) Analysis by Operating Mode, 2018 to 2033

Figure 198: East Asia Value Share (%) and BPS Analysis by Operating Mode, 2023 to 2033

Figure 199: East Asia Y-o-Y Growth (%) Projections by Operating Mode, 2023 to 2033

Figure 200: East Asia Value (US$ million) Analysis by Distribution Channel, 2018 to 2033

Figure 201: East Asia Volume (MT) Analysis by Distribution Channel, 2018 to 2033

Figure 202: East Asia Value Share (%) and BPS Analysis by Distribution Channel, 2023 to 2033

Figure 203: East Asia Y-o-Y Growth (%) Projections by Distribution Channel, 2023 to 2033

Figure 204: East Asia Attractiveness by Product Type, 2023 to 2033

Figure 205: East Asia Attractiveness by Application, 2023 to 2033

Figure 206: East Asia Attractiveness by Material, 2023 to 2033

Figure 207: East Asia Attractiveness by Blade Material, 2023 to 2033

Figure 208: East Asia Attractiveness by Operating Mode, 2023 to 2033

Figure 209: East Asia Attractiveness by Distribution Channel, 2023 to 2033

Figure 210: East Asia Attractiveness by Country, 2023 to 2033

Figure 211: South Asia Value (US$ million) by Product Type, 2023 to 2033

Figure 212: South Asia Value (US$ million) by Application, 2023 to 2033

Figure 213: South Asia Value (US$ million) by Material, 2023 to 2033

Figure 214: South Asia Value (US$ million) by Blade Material, 2023 to 2033

Figure 215: South Asia Value (US$ million) by Operating Mode, 2023 to 2033

Figure 216: South Asia Value (US$ million) by Distribution Channel, 2023 to 2033

Figure 217: South Asia Value (US$ million) by Country, 2023 to 2033

Figure 218: South Asia Value (US$ million) Analysis by Country, 2018 to 2033

Figure 219: South Asia Volume (MT) Analysis by Country, 2018 to 2033

Figure 220: South Asia Value Share (%) and BPS Analysis by Country, 2023 to 2033

Figure 221: South Asia Y-o-Y Growth (%) Projections by Country, 2023 to 2033

Figure 222: South Asia Value (US$ million) Analysis by Product Type, 2018 to 2033

Figure 223: South Asia Volume (MT) Analysis by Product Type, 2018 to 2033

Figure 224: South Asia Value Share (%) and BPS Analysis by Product Type, 2023 to 2033

Figure 225: South Asia Y-o-Y Growth (%) Projections by Product Type, 2023 to 2033

Figure 226: South Asia Value (US$ million) Analysis by Application, 2018 to 2033

Figure 227: South Asia Volume (MT) Analysis by Application, 2018 to 2033

Figure 228: South Asia Value Share (%) and BPS Analysis by Application, 2023 to 2033

Figure 229: South Asia Y-o-Y Growth (%) Projections by Application, 2023 to 2033

Figure 230: South Asia Value (US$ million) Analysis by Material, 2018 to 2033

Figure 231: South Asia Volume (MT) Analysis by Material, 2018 to 2033

Figure 232: South Asia Value Share (%) and BPS Analysis by Material, 2023 to 2033

Figure 233: South Asia Y-o-Y Growth (%) Projections by Material, 2023 to 2033

Figure 234: South Asia Value (US$ million) Analysis by Blade Material, 2018 to 2033

Figure 235: South Asia Volume (MT) Analysis by Blade Material, 2018 to 2033

Figure 236: South Asia Value Share (%) and BPS Analysis by Blade Material, 2023 to 2033

Figure 237: South Asia Y-o-Y Growth (%) Projections by Blade Material, 2023 to 2033

Figure 238: South Asia Value (US$ million) Analysis by Operating Mode, 2018 to 2033

Figure 239: South Asia Volume (MT) Analysis by Operating Mode, 2018 to 2033

Figure 240: South Asia Value Share (%) and BPS Analysis by Operating Mode, 2023 to 2033

Figure 241: South Asia Y-o-Y Growth (%) Projections by Operating Mode, 2023 to 2033

Figure 242: South Asia Value (US$ million) Analysis by Distribution Channel, 2018 to 2033

Figure 243: South Asia Volume (MT) Analysis by Distribution Channel, 2018 to 2033

Figure 244: South Asia Value Share (%) and BPS Analysis by Distribution Channel, 2023 to 2033

Figure 245: South Asia Y-o-Y Growth (%) Projections by Distribution Channel, 2023 to 2033

Figure 246: South Asia Attractiveness by Product Type, 2023 to 2033

Figure 247: South Asia Attractiveness by Application, 2023 to 2033

Figure 248: South Asia Attractiveness by Material, 2023 to 2033

Figure 249: South Asia Attractiveness by Blade Material, 2023 to 2033

Figure 250: South Asia Attractiveness by Operating Mode, 2023 to 2033

Figure 251: South Asia Attractiveness by Distribution Channel, 2023 to 2033

Figure 252: South Asia Attractiveness by Country, 2023 to 2033

Figure 253: Oceania Value (US$ million) by Product Type, 2023 to 2033

Figure 254: Oceania Value (US$ million) by Application, 2023 to 2033

Figure 255: Oceania Value (US$ million) by Material, 2023 to 2033

Figure 256: Oceania Value (US$ million) by Blade Material, 2023 to 2033

Figure 257: Oceania Value (US$ million) by Operating Mode, 2023 to 2033

Figure 258: Oceania Value (US$ million) by Distribution Channel, 2023 to 2033

Figure 259: Oceania Value (US$ million) by Country, 2023 to 2033

Figure 260: Oceania Value (US$ million) Analysis by Country, 2018 to 2033

Figure 261: Oceania Volume (MT) Analysis by Country, 2018 to 2033

Figure 262: Oceania Value Share (%) and BPS Analysis by Country, 2023 to 2033

Figure 263: Oceania Y-o-Y Growth (%) Projections by Country, 2023 to 2033

Figure 264: Oceania Value (US$ million) Analysis by Product Type, 2018 to 2033

Figure 265: Oceania Volume (MT) Analysis by Product Type, 2018 to 2033

Figure 266: Oceania Value Share (%) and BPS Analysis by Product Type, 2023 to 2033

Figure 267: Oceania Y-o-Y Growth (%) Projections by Product Type, 2023 to 2033

Figure 268: Oceania Value (US$ million) Analysis by Application, 2018 to 2033

Figure 269: Oceania Volume (MT) Analysis by Application, 2018 to 2033

Figure 270: Oceania Value Share (%) and BPS Analysis by Application, 2023 to 2033

Figure 271: Oceania Y-o-Y Growth (%) Projections by Application, 2023 to 2033

Figure 272: Oceania Value (US$ million) Analysis by Material, 2018 to 2033

Figure 273: Oceania Volume (MT) Analysis by Material, 2018 to 2033

Figure 274: Oceania Value Share (%) and BPS Analysis by Material, 2023 to 2033

Figure 275: Oceania Y-o-Y Growth (%) Projections by Material, 2023 to 2033

Figure 276: Oceania Value (US$ million) Analysis by Blade Material, 2018 to 2033

Figure 277: Oceania Volume (MT) Analysis by Blade Material, 2018 to 2033

Figure 278: Oceania Value Share (%) and BPS Analysis by Blade Material, 2023 to 2033

Figure 279: Oceania Y-o-Y Growth (%) Projections by Blade Material, 2023 to 2033

Figure 280: Oceania Value (US$ million) Analysis by Operating Mode, 2018 to 2033

Figure 281: Oceania Volume (MT) Analysis by Operating Mode, 2018 to 2033

Figure 282: Oceania Value Share (%) and BPS Analysis by Operating Mode, 2023 to 2033

Figure 283: Oceania Y-o-Y Growth (%) Projections by Operating Mode, 2023 to 2033

Figure 284: Oceania Value (US$ million) Analysis by Distribution Channel, 2018 to 2033

Figure 285: Oceania Volume (MT) Analysis by Distribution Channel, 2018 to 2033

Figure 286: Oceania Value Share (%) and BPS Analysis by Distribution Channel, 2023 to 2033

Figure 287: Oceania Y-o-Y Growth (%) Projections by Distribution Channel, 2023 to 2033

Figure 288: Oceania Attractiveness by Product Type, 2023 to 2033

Figure 289: Oceania Attractiveness by Application, 2023 to 2033

Figure 290: Oceania Attractiveness by Material, 2023 to 2033

Figure 291: Oceania Attractiveness by Blade Material, 2023 to 2033

Figure 292: Oceania Attractiveness by Operating Mode, 2023 to 2033

Figure 293: Oceania Attractiveness by Distribution Channel, 2023 to 2033

Figure 294: Oceania Attractiveness by Country, 2023 to 2033

Figure 295: MEA Value (US$ million) by Product Type, 2023 to 2033

Figure 296: MEA Value (US$ million) by Application, 2023 to 2033

Figure 297: MEA Value (US$ million) by Material, 2023 to 2033

Figure 298: MEA Value (US$ million) by Blade Material, 2023 to 2033

Figure 299: MEA Value (US$ million) by Operating Mode, 2023 to 2033

Figure 300: MEA Value (US$ million) by Distribution Channel, 2023 to 2033

Figure 301: MEA Value (US$ million) by Country, 2023 to 2033

Figure 302: MEA Value (US$ million) Analysis by Country, 2018 to 2033

Figure 303: MEA Volume (MT) Analysis by Country, 2018 to 2033

Figure 304: MEA Value Share (%) and BPS Analysis by Country, 2023 to 2033

Figure 305: MEA Y-o-Y Growth (%) Projections by Country, 2023 to 2033

Figure 306: MEA Value (US$ million) Analysis by Product Type, 2018 to 2033

Figure 307: MEA Volume (MT) Analysis by Product Type, 2018 to 2033

Figure 308: MEA Value Share (%) and BPS Analysis by Product Type, 2023 to 2033

Figure 309: MEA Y-o-Y Growth (%) Projections by Product Type, 2023 to 2033

Figure 310: MEA Value (US$ million) Analysis by Application, 2018 to 2033

Figure 311: MEA Volume (MT) Analysis by Application, 2018 to 2033

Figure 312: MEA Value Share (%) and BPS Analysis by Application, 2023 to 2033

Figure 313: MEA Y-o-Y Growth (%) Projections by Application, 2023 to 2033

Figure 314: MEA Value (US$ million) Analysis by Material, 2018 to 2033

Figure 315: MEA Volume (MT) Analysis by Material, 2018 to 2033

Figure 316: MEA Value Share (%) and BPS Analysis by Material, 2023 to 2033

Figure 317: MEA Y-o-Y Growth (%) Projections by Material, 2023 to 2033

Figure 318: MEA Value (US$ million) Analysis by Blade Material, 2018 to 2033

Figure 319: MEA Volume (MT) Analysis by Blade Material, 2018 to 2033

Figure 320: MEA Value Share (%) and BPS Analysis by Blade Material, 2023 to 2033

Figure 321: MEA Y-o-Y Growth (%) Projections by Blade Material, 2023 to 2033

Figure 322: MEA Value (US$ million) Analysis by Operating Mode, 2018 to 2033

Figure 323: MEA Volume (MT) Analysis by Operating Mode, 2018 to 2033

Figure 324: MEA Value Share (%) and BPS Analysis by Operating Mode, 2023 to 2033

Figure 325: MEA Y-o-Y Growth (%) Projections by Operating Mode, 2023 to 2033

Figure 326: MEA Value (US$ million) Analysis by Distribution Channel, 2018 to 2033

Figure 327: MEA Volume (MT) Analysis by Distribution Channel, 2018 to 2033

Figure 328: MEA Value Share (%) and BPS Analysis by Distribution Channel, 2023 to 2033

Figure 329: MEA Y-o-Y Growth (%) Projections by Distribution Channel, 2023 to 2033

Figure 330: MEA Attractiveness by Product Type, 2023 to 2033

Figure 331: MEA Attractiveness by Application, 2023 to 2033

Figure 332: MEA Attractiveness by Material, 2023 to 2033

Figure 333: MEA Attractiveness by Blade Material, 2023 to 2033

Figure 334: MEA Attractiveness by Operating Mode, 2023 to 2033

Figure 335: MEA Attractiveness by Distribution Channel, 2023 to 2033

Figure 336: MEA Attractiveness by Country, 2023 to 2033

Explore Process Automation Insights

View Reports

French Fries Cutter Market