The frequency control and timing device market is experiencing consistent growth driven by rapid technological advancement, expansion of telecommunications infrastructure, and increasing integration of precision timing components in electronic systems. Demand has been supported by the proliferation of wireless communication networks, IoT devices, and next-generation data centers. Market participants are focusing on miniaturization, enhanced frequency stability, and low power consumption to meet modern electronic design requirements.
Regulatory compliance, performance reliability, and supply chain resilience are emerging as key differentiators influencing competitive positioning. The future outlook remains positive as 5G deployment, satellite communication, and advanced automotive electronics continue to generate strong demand for high-performance timing devices.
Growth rationale is built upon rising global digitalization, increased reliance on high-speed data transmission, and technological innovations in resonator materials and packaging These trends are collectively driving long-term market expansion and ensuring sustained demand across consumer, industrial, and communication equipment segments.
| Metric | Value |
|---|---|
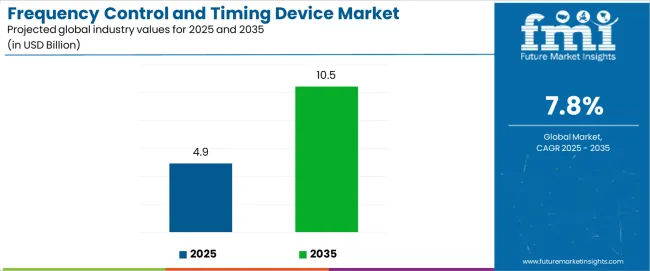
| Frequency Control and Timing Device Market Estimated Value in (2025 E) | USD 4.9 billion |
| Frequency Control and Timing Device Market Forecast Value in (2035 F) | USD 10.5 billion |
| Forecast CAGR (2025 to 2035) | 7.8% |
The market is segmented by Product Type and Industry and region. By Product Type, the market is divided into Crystal Oscillator, Crystals, and Resonators. In terms of Industry, the market is classified into Telecommunication, Automotive, Consumer Electronics, Aerospace and Defense, Medical, Diagnostic Equipment, Industrial, and Other Industries. Regionally, the market is classified into North America, Latin America, Western Europe, Eastern Europe, Balkan & Baltic Countries, Russia & Belarus, Central Asia, East Asia, South Asia & Pacific, and the Middle East & Africa.
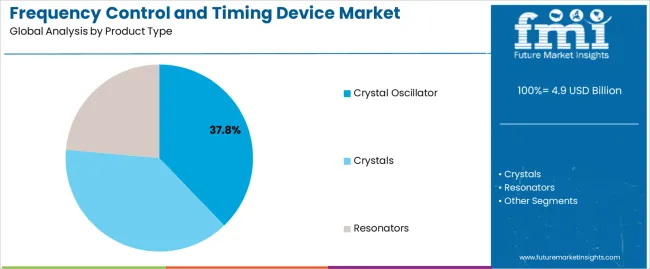
The crystal oscillator segment, accounting for 37.80% of the product type category, has maintained its leadership position due to its superior frequency stability, compact design, and broad applicability across electronic systems. Demand has been supported by its critical role in synchronizing signals within telecommunication networks, computing hardware, and consumer electronics.
Ongoing advancements in quartz processing and temperature-compensated designs have improved performance and durability, ensuring long operational lifespan. Manufacturers are focusing on integration of low-phase-noise oscillators to meet the precision requirements of 5G infrastructure and high-speed communication devices.
Supply chain optimization and cost-efficient production have further strengthened competitiveness As the global electronics industry continues to evolve, the crystal oscillator segment is expected to retain dominance, driven by its proven reliability, scalability, and consistent technological enhancement.
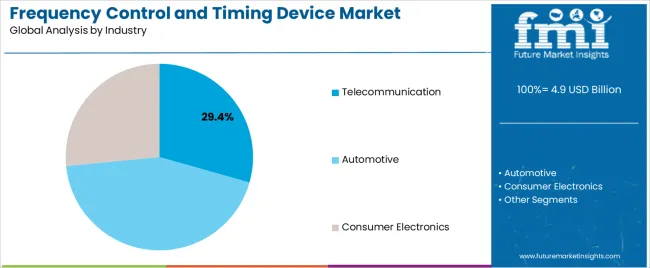
The telecommunication segment, representing 29.40% of the industry category, has been leading the market owing to the growing demand for frequency synchronization in mobile base stations, fiber networks, and satellite systems. The segment’s share has been reinforced by continuous investments in 5G and next-generation communication technologies requiring ultra-stable timing solutions.
Rising data traffic and the expansion of broadband infrastructure are accelerating the adoption of precision timing devices across global networks. Manufacturers are developing compact, high-frequency components capable of maintaining performance under varying environmental conditions.
The increasing shift toward cloud computing and edge processing is further amplifying the need for accurate timing across distributed systems Over the forecast period, sustained capital expenditure in telecom infrastructure and advancements in network reliability standards are expected to support long-term growth and ensure steady demand within this segment.
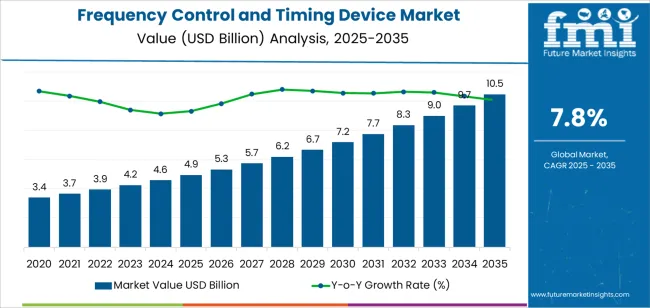
From 2020 to 2025, global sales of frequency control and timing devices increased at a CAGR of 6.3%. Total market valuation in 2025 reached around USD 4,281.43 million.
During this period, the adoption of crystals, crystal oscillators, and resonators took a halt due to the supply chain disruption as a result of Covid-19. However, the adoption of the products kept increasing after 2024. High demand for oscillators in telecommunication industry led to increasing market revenue post 2024.
Future Forecast for Frequency Control and Timing Device Market
Over the forecast period, the global frequency control and timing device industry is expected to rise at a CAGR of 7.8%. Total market valuation is anticipated to reach USD 9,654.39 million by 2035.
Demand for frequency control and timing devices is expected to continue its upward trajectory. The increasing integration of frequency control and timing devices in technologies such as telecommunications, 5G networks, Internet of Things (IoT), and industrial automation will likely drive their demand.
As technologies advance and more devices become interconnected, the need for precise timing and synchronization becomes crucial. As a result, products like frequency control and timing devices are being widely used.
With the advent of 5G communication and the high-speed connectivity offered by 5G, there will be an exponential increase in the demand for communication traffic. This is expected to create growth prospects for the frequency control and timing device market.
Semi-annual Market Update
| Particular | Value CAGR |
|---|---|
| H1(2025 to 2035) | 5.6% |
| H2(2025 to 2035) | 6.3% |
| H1(2025 to 2035) | 7.8% |
| H2(2025 to 2035) | 8.1% |
The frequency control and timing device market exhibits varying growth rates across different countries, with India leading from the forefront. India is set to register a CAGR of 11.1% during the forecast period.
Market Growth Outlook by Key Countries
| Countries | Value CAGR |
|---|---|
| United States | 7.7% |
| Germany | 8.0% |
| United Kingdom | 8.5% |
| Brazil | 6.2% |
| China | 8.1% |
| India | 11.1% |
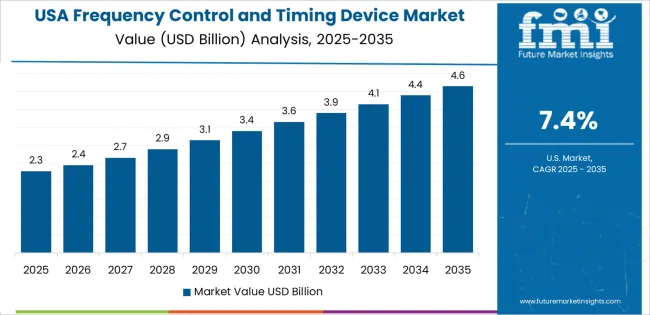
The United States frequency control and timing device market size is expected to reach USD 1,405.81 million by 2035. Sales in the nation are anticipated to surge at a CAGR of 7.7% throughout the forecast period.
According to the latest analysis, China’s frequency control and timing device industry is projected to be valued at USD 4.9 million in 2025. Overall demand for frequency control and timing devices in China will likely increase at a CAGR of 8.1% during the forecast period.
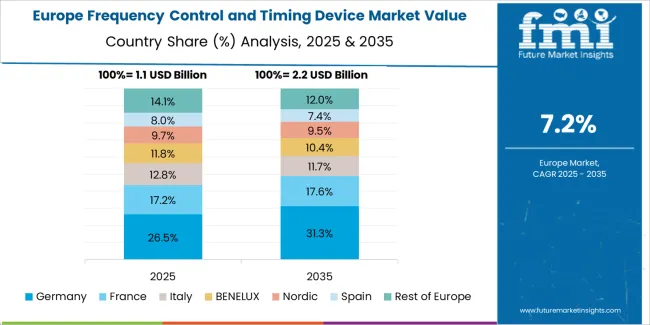
The frequency control and timing device market in Germany is estimated to total USD 372.10 million by 2035. It will likely exhibit a CAGR of 8.0% during the assessment period, driven by a combination of factors, including expanding telecommunication and automotive sectors.
The frequency control and timing device market value in Brazil is estimated to total USD 259.66 million in 2035, growing at a CAGR of 6.2%. This growth is fueled by several factors.
The frequency control and timing device market in India is estimated to record a rapid CAGR of 11.1% over the forecast period. Hence, it will present lucrative growth opportunities for frequency control and timing device suppliers.
The section below shows the crystal oscillator segment leading the frequency control and timing industry. It is projected to account for a revenue share of 56.2% by 2035. Based on industry, the consumer electronics segment will likely hold a market share of 27.1% in 2035.
Market Growth Outlook by Product Type
| Product Type | Value CAGR |
|---|---|
| Crystals | 6.7% |
| Crystal Oscillator | 7.3% |
| Resonators | 12.6% |
As per the latest analysis, the crystal oscillator segment is expected to retain its market dominance throughout the forecast period. It will likely exhibit a CAGR of 7.3% during the next ten years, holding a value share of 56.2% in 2035.
On the other hand, demand for resonators is predicted to rise at a higher CAGR of 12.8% during the assessment period. The target segment will likely generate revenue worth USD 1,578.52 million in 2035.
Growing usage of crystal resonators and MEMS-based resonators in filters, sensors, and other applications is expected to boost their demand. Similarly, excellent properties of quartz-based crystal resonators are encouraging their adoption in industries like automotive.
Quartz crystal resonators are also gaining wider popularity in advanced driver assistance systems (ADAS) and in-vehicle communication systems. This is being propelled by the automotive industry's shift toward smart and connected automobiles.
Market Growth Outlook by Industry
| Industry | Value CAGR |
|---|---|
| Telecommunication | 9.3% |
| Automotive | 7.9% |
| Consumer Electronics | 8.6% |
| Aerospace and Defense | 6.5% |
| Medical | 7.1% |
| Industrial | 5.5% |
| Other Industries | 4.9% |
Consumer electronics industry remains the leading consumer of frequency control and timing devices, and the trend will likely continue through 2035. As per the latest report, the target segment is projected to grow at 8.6% CAGR, holding a market share of 27.1% in 2035.
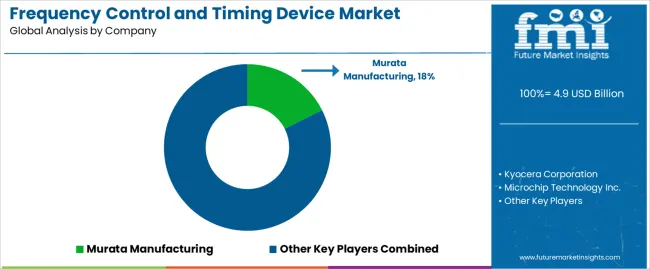
Key manufacturers of frequency control and timing devices are using different strategies to boost their sales and stay ahead of the competition.
Key Strategies Adopted by Leading Players
Innovation and Technological Advancements
Prominent corporations make significant investments in research and development to create novel technologies and improve their current offerings. They may provide cutting-edge frequency management and timing solutions that satisfy the rising demands for accuracy, dependability, and efficiency by remaining at the forefront of technical breakthroughs.
Strategic Partnerships and Collaborations
Collaborations with other industry players, research institutions, and technology partners enable key players to access complementary expertise, resources, and market channels. Strategic partnerships facilitate the development of integrated solutions, accelerate time-to-market, and enhance competitiveness in the rapidly evolving landscape.
Market Diversification
Businesses frequently upgrade their product portfolios to serve a wider range of sectors and applications. Businesses increase their customer base and revenue streams by providing a wide variety of frequency control and timing devices that are suited to particular market groups.
Customer-centric Approaches
Understanding customer needs and preferences is paramount in the frequency control and timing device market. Key players prioritize customer engagement, feedback, and support to deliver tailored solutions that address specific requirements. By fostering strong customer relationships and providing superior service, companies can build loyalty, gain market share, and differentiate themselves from competitors.
Global Expansion and Market Penetration
Expanding into new geographic regions and penetrating untapped markets is a common strategy for key players seeking growth opportunities. By establishing a presence in emerging markets and leveraging local partnerships, companies can capitalize on rising demand for frequency control and timing devices driven by technological advancements and infrastructure development.
Key Developments in the Frequency Control and Timing Device Market
The global frequency control and timing device market is estimated to be valued at USD 4.9 billion in 2025.
The market size for the frequency control and timing device market is projected to reach USD 10.5 billion by 2035.
The frequency control and timing device market is expected to grow at a 7.8% CAGR between 2025 and 2035.
The key product types in frequency control and timing device market are crystal oscillator, _temperature compensated crystal oscillator (tcxo), _oven controlled crystal oscillator (ocxo), _simple packaged crystal oscillator (spxo), _voltage controlled crystal oscillator (vcxo), _frequency controlled crystal oscillator (fcxo), _others, crystals, resonators, _mems-based resonator and _quartz-based crystal resonator.
In terms of industry, telecommunication segment to command 29.4% share in the frequency control and timing device market in 2025.


Our Research Products

The "Full Research Suite" delivers actionable market intel, deep dives on markets or technologies, so clients act faster, cut risk, and unlock growth.

The Leaderboard benchmarks and ranks top vendors, classifying them as Established Leaders, Leading Challengers, or Disruptors & Challengers.

Locates where complements amplify value and substitutes erode it, forecasting net impact by horizon

We deliver granular, decision-grade intel: market sizing, 5-year forecasts, pricing, adoption, usage, revenue, and operational KPIs—plus competitor tracking, regulation, and value chains—across 60 countries broadly.

Spot the shifts before they hit your P&L. We track inflection points, adoption curves, pricing moves, and ecosystem plays to show where demand is heading, why it is changing, and what to do next across high-growth markets and disruptive tech

Real-time reads of user behavior. We track shifting priorities, perceptions of today’s and next-gen services, and provider experience, then pace how fast tech moves from trial to adoption, blending buyer, consumer, and channel inputs with social signals (#WhySwitch, #UX).

Partner with our analyst team to build a custom report designed around your business priorities. From analysing market trends to assessing competitors or crafting bespoke datasets, we tailor insights to your needs.
Supplier Intelligence
Discovery & Profiling
Capacity & Footprint
Performance & Risk
Compliance & Governance
Commercial Readiness
Who Supplies Whom
Scorecards & Shortlists
Playbooks & Docs
Category Intelligence
Definition & Scope
Demand & Use Cases
Cost Drivers
Market Structure
Supply Chain Map
Trade & Policy
Operating Norms
Deliverables
Buyer Intelligence
Account Basics
Spend & Scope
Procurement Model
Vendor Requirements
Terms & Policies
Entry Strategy
Pain Points & Triggers
Outputs
Pricing Analysis
Benchmarks
Trends
Should-Cost
Indexation
Landed Cost
Commercial Terms
Deliverables
Brand Analysis
Positioning & Value Prop
Share & Presence
Customer Evidence
Go-to-Market
Digital & Reputation
Compliance & Trust
KPIs & Gaps
Outputs
Full Research Suite comprises of:
Market outlook & trends analysis
Interviews & case studies
Strategic recommendations
Vendor profiles & capabilities analysis
5-year forecasts
8 regions and 60+ country-level data splits
Market segment data splits
12 months of continuous data updates
DELIVERED AS:
PDF EXCEL ONLINE
Frequency Converter Market Growth – Trends & Forecast 2024-2034
Frequency Counter Market Growth – Trends & Forecast 2019-2027
Global Low Frequency Ultrasound Market Analysis – Size, Share & Forecast 2025-2035
Low Frequency Sound Absorbing Insulation Material Market Growth – Trends & Forecast 2024-2034
High-frequency RF Evaluation Board Market Size and Share Forecast Outlook 2025 to 2035
Dual Frequency Ultrasonic Cleaner Market Size and Share Forecast Outlook 2025 to 2035
High Frequency Military Communications Market Size and Share Forecast Outlook 2025 to 2035
Radiofrequency (RF) Ablation System Market Size and Share Forecast Outlook 2025 to 2035
Radiofrequency Balloon Catheter Market Size and Share Forecast Outlook 2025 to 2035
High Frequency High Speed Copper Clad Laminate CCL Market Size and Share Forecast Outlook 2025 to 2035
High Frequency Vibrator Market
High Frequency Chest-Wall Oscillation Devices Market Size and Share Forecast Outlook 2025 to 2035
Radio Frequency Identification Market Size and Share Forecast Outlook 2025 to 2035
Radio Frequency Test Equipment Market Size and Share Forecast Outlook 2025 to 2035
Radio Frequency Front End Module Market Size and Share Forecast Outlook 2025 to 2035
Radio Frequency Beauty Equipment Market is segmented by product, application, technology, and end user from 2025 to 2035
Radio Frequency Integrated Circuit (RFIC) Market Analysis by Product, Application and Region Through 2035
Radio Frequency Components Market Growth – Trends & Forecast 2025 to 2035
Laser Frequency Splitting and Mode Competition Teaching Instrument Market Size and Share Forecast Outlook 2025 to 2035
Variable Frequency Drive Market Size and Share Forecast Outlook 2025 to 2035

Thank you!
You will receive an email from our Business Development Manager. Please be sure to check your SPAM/JUNK folder too.
Chat With
MaRIA