The Industry Analysis of Syringe and Needle in GCC is estimated to be valued at USD 725.7 million in 2025 and is projected to reach USD 1196.8 million by 2035, registering a compound annual growth rate (CAGR) of 5.1% over the forecast period.
The Syringe and Needle market in the GCC region is experiencing strong growth, driven by increasing healthcare infrastructure investments, rising patient populations, and growing awareness of safe injection practices. Demand is supported by the expansion of hospitals, clinics, and vaccination programs, as well as increasing prevalence of chronic diseases requiring frequent injections. The market is further influenced by regulatory emphasis on infection control and disposable medical devices to reduce cross-contamination.
Advancements in manufacturing processes and materials have enhanced the safety, precision, and reliability of syringes and needles, which has strengthened adoption among healthcare providers. The rising number of immunization initiatives, along with growing focus on outpatient care and home healthcare services, is boosting demand for convenient and safe injection devices.
Additionally, government programs and public-private partnerships supporting vaccination drives and preventive healthcare are creating sustained opportunities for the market With ongoing healthcare modernization and increasing patient demand, the GCC syringe and needle market is expected to maintain robust growth over the coming years.
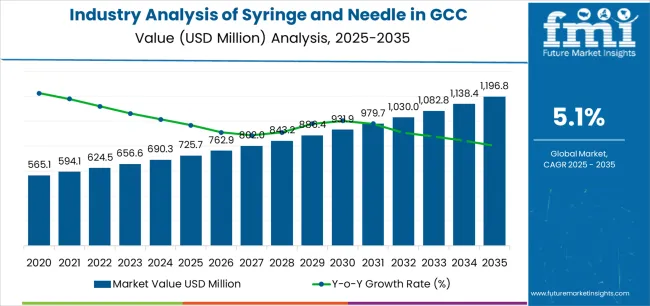
| Metric | Value |
|---|---|
| Industry Analysis of Syringe and Needle in GCC Estimated Value in (2025 E) | USD 725.7 million |
| Industry Analysis of Syringe and Needle in GCC Forecast Value in (2035 F) | USD 1196.8 million |
| Forecast CAGR (2025 to 2035) | 5.1% |
The market is segmented by Product, Usability, Material, and End User and region. By Product, the market is divided into Hypodermic, Standard, Special Purpose, and Oral. In terms of Usability, the market is classified into Disposable and Reusable. Based on Material, the market is segmented into Polymer and Glass. By End User, the market is divided into Hospital, Blood Collection Center, Diabetic Care Center, Veterinary Care Center, and Others. Regionally, the market is classified into North America, Latin America, Western Europe, Eastern Europe, Balkan & Baltic Countries, Russia & Belarus, Central Asia, East Asia, South Asia & Pacific, and the Middle East & Africa.
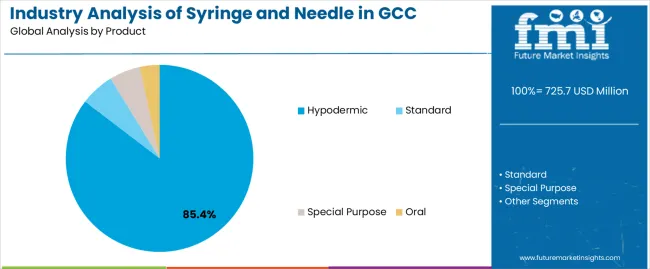
The hypodermic segment is projected to hold 85.4% of the market revenue in 2025, establishing it as the leading product type in the GCC region. Growth in this segment is being driven by its wide application across hospitals, clinics, and outpatient facilities for injections, vaccinations, and fluid sampling. Hypodermic syringes and needles are preferred due to their accuracy, safety, and reliability, particularly in clinical and surgical settings.
The segment benefits from increasing adoption of vaccination campaigns, chronic disease management programs, and diagnostic testing services. Advances in design, including precision-engineered needles and ergonomic syringes, have improved usability and minimized patient discomfort, further strengthening preference.
Regulatory emphasis on standardization, sterilization, and safety features is also encouraging adoption As healthcare infrastructure continues to expand in the GCC, the hypodermic segment is expected to maintain its dominance, supported by high demand for precise, reliable, and safe injection devices that meet evolving clinical requirements and compliance standards.
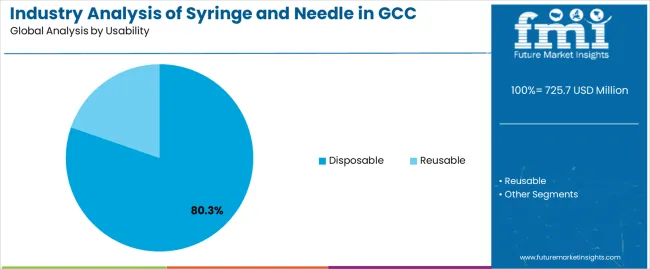
The disposable segment is anticipated to account for 80.3% of the market revenue in 2025, making it the leading usability category. Growth is driven by increasing concerns over infection control and the need to prevent cross-contamination in healthcare facilities. Disposable syringes and needles offer convenience, reduce the risk of disease transmission, and simplify clinical workflows, which enhances operational efficiency.
Hospitals and clinics are increasingly adopting single-use devices in line with regulatory guidelines and global best practices. Rising awareness among healthcare professionals and patients about the importance of hygiene and safe injection practices is further supporting adoption.
Additionally, disposable devices facilitate compliance with sterilization standards and reduce costs associated with reprocessing reusable syringes With ongoing vaccination programs, outpatient services, and preventive healthcare initiatives, the disposable segment is expected to continue leading the market, reinforced by safety, convenience, and regulatory compliance benefits.
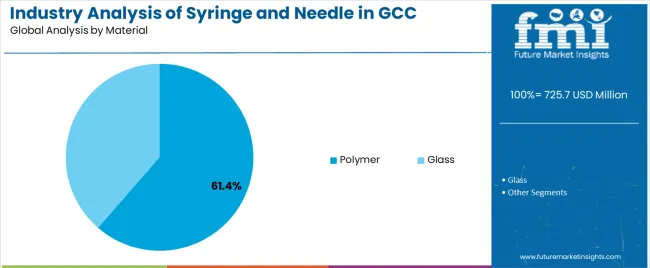
The polymer segment is projected to hold 61.4% of the market revenue in 2025, establishing it as the leading material type. Growth in this segment is being driven by the lightweight, durable, and biocompatible properties of polymer-based syringes and needles, which offer improved patient comfort and handling ease. Polymers enable precision molding, reducing defects and ensuring consistent performance across devices.
The segment also benefits from the ability to incorporate safety features, such as retractable needles and tamper-evident designs, enhancing overall device reliability. Rising awareness of environmental impact and efforts to develop recyclable or safe polymer-based devices further support adoption.
Polymer syringes and needles are particularly favored in disposable and single-use formats due to cost-effectiveness and compliance with sterilization standards As healthcare facilities continue to prioritize safety, efficiency, and patient comfort, the polymer segment is expected to maintain its leading position, supported by innovation in material science and ongoing expansion of the healthcare ecosystem in the GCC region.
Proliferating Telemedicine Platforms and Remote Healthcare Delivery Models to Boost Demand
The GCC region's telemedicine and remote healthcare delivery trends are propelling demand for syringes and needles. Patients must either self-administer injections or receive injections from visiting healthcare experts as video consultations and home-based healthcare grow common. Manufacturing home-use syringes and needles with user-friendly designs and packaging intended for remote distribution can be opportunistic.
Several businesses are hopping on this trend, largely by alliances. For instance, in January 2025, e& business and Burjeel Holdings, one of the top healthcare service providers in the MENA region, made two historic collaborations aimed at changing healthcare in the UAE and beyond.
These include the introduction of a groundbreaking telemedicine services initiative and a strategic memorandum of understanding (MoU), both of which will change the landscape of healthcare delivery.
Government Initiatives and Regulations to Foster Innovation and Growth
Syringe and needle supply and demand in the GCC region are rising due to government-led initiatives to elevate healthcare standards and regulatory compliance. Regulations emphasizing safety-engineered equipment and conformity to quality standards foster an atmosphere favorable for innovation and revenue growth.
Manufacturers can gain a competitive edge in the heavily regulated GCC healthcare industry by showcasing compliance with regulatory standards, investing in quality management systems, and encouraging transparency and integrity in their operations.
By 2035, the Kingdom of Saudi Arabia's Council of Cooperative Health Insurance (CCHI) hopes to insure around half of the population and play a significant role in shaping the future of the healthcare industry. In 2025, Qatar enacted new legislation requiring insurance, while Oman and Bahrain likewise pursued universal health coverage.
Expanding Healthcare Infrastructure in the GCC Region Leads to a Surge in Demand
The GCC region's healthcare infrastructure expansion offers a favorable environment for growth. Demand for medical supplies is rising with governments prioritizing a robust healthcare infrastructure to meet the needs of urban and expanding populations. Syringe and needle manufacturers can benefit by forming strategic connections with regional distributors and having flexible production capabilities to gain a firm footing in the GCC region.
In March 2025, the Ministry of Health and Prevention (MoHAP) launched the Patient Safety Friendly Hospitals program. This initiative is a key step toward ensuring the provision of high-quality healthcare services in accordance with global best practices.
The program, launched in partnership with the World Health Organization (WHO), seeks to promote patient safety by developing recognized standards that improve hospital performance. Providing syringe and needle supplies in such initiatives can benefit businesses in this industry.
| Leading Product for Syringes and Needles in GCC | Hypodermic |
|---|---|
| Total Value Share (2025) | 85.40% |
Chronic conditions, including diabetes, heart disease, and respiratory issues, are becoming more common in GCC countries. According to the International Diabetes Federation (IDF), most of the Gulf Cooperation Council (GCC) countries have high prevalence rates of prediabetes (above 15%) and diabetes (above 20%).
These rates rank among the top in the world. Hypodermic syringes and needles are in high demand as the principal drug delivery tool since managing these disorders requires numerous injections of insulin and other therapeutic agents.
Hypodermic syringes and needles are favored in healthcare settings because of their safety features, precision, and convenience. In order to reduce the risk of contamination, prescription mistakes, and needlestick injuries, healthcare practitioners in the GCC region are using these in response to an increasing focus on patient safety and infection control.
| Leading Usability for Syringes and Needles in GCC | Disposable |
|---|---|
| Total Value Share (2025) | 80.30% |
GCC countries invest in health promotion initiatives, screening programs, and immunization campaigns as preventative healthcare measures. Disposable syringes and needles are in high demand in this region because they make it easier to administer drugs, immunizations, and diagnostic tests safely and effectively, which is essential in supporting these programs.
Healthcare practitioners emphasize using disposable syringes and needles to reduce the risk of healthcare-associated infections (HAIs) and provide a sterile environment for patient care as infection control and patient safety become increasingly pertinent in the GCC region.
| Countries | Value CAGR (2025 to 2035) |
|---|---|
| Kingdom of Saudi Arabia | 5.60% |
| United Arab Emirates | 5.70% |
| Qatar | 5.50% |
| Bahrain | 4.60% |
| Oman | 5.30% |
Demand for syringes and needles in the Kingdom of Saudi Arabia (KSA) to amplify at a 5.60% CAGR through 2035. The Vision 2035 plan of the KSA government encompasses a range of ambitious healthcare programs designed to improve healthcare accessibility, foster innovation, and enhance infrastructure. Manufacturers can participate in hospital development projects, medical equipment procurement, and improving healthcare service delivery.
The Saudi Arabian government's decision to privatize healthcare services is creating opportunities for the private sector to engage and invest in the healthcare sector. Modernizing medical facilities, adopting advanced equipment and upgrading medical equipment are all priorities for private healthcare providers.
Sales of syringes and needles in the United Arab Emirates (UAE) to surge at a 5.70% CAGR through 2035. The free zones in the UAE provide a business-friendly atmosphere with tax breaks, streamlined regulations, and access to top-notch infrastructure.
Free zones like Dubai Healthcare City (DHCC) and the Khalifa Industrial Zone (KIZAD) in Abu Dhabi provide expedited procedures for producing, distributing, and exporting medical products, including needles and syringes. Manufacturers can boost competitiveness in the UAE and abroad, maximize supply chain efficiency, and save operating costs by taking advantage of free zone benefits.
The syringe and needle industry expansion in Qatar is estimated at a 5.50% CAGR through 2035. Manufacturers of syringes and needles have an opportunity to produce specialized medical equipment for sports injury management, rehabilitation, and wellness therapies, given Qatar's expanding focus on sports medicine and wellness tourism.
There is a need for top-notch medical supplies to assist athletes' healthcare demands because Qatar organizes important sports events like the World Cup and the Qatar National Sports Day. Manufacturers can tweak their offerings to fit the needs of wellness centers and sports medicine professionals, taking advantage of an exclusive niche and enhancing Qatar's stature as a sports and wellness destination.
Demand for syringes and needles in Bahrain to rise at a 4.60% CAGR through 2035. Internationally recognized health and safety standards for syringes and needles are in high demand due to Bahrain's emphasis on regulatory compliance and healthcare quality accreditation.
In order to prove their dedication to quality and patient safety, Bahraini healthcare institutions apply for certification from groups like the Health Authority Bahrain (NQVHA) and the Joint Commission International (JCI).
Manufacturers can set themselves apart from the competition by securing the necessary endorsements and certifications, which will help them establish credibility as reliable medical device providers in Bahrain.
Sales of syringes and needles in Oman to increase at a 5.30% CAGR through 2035. The prevalence of chronic diseases, including cardiovascular disease, diabetes, and respiratory disorders, is rising in Oman. In Oman, 40.3% of people have hypertension, 24.1% have a BMI of obesity, 33.6% have total cholesterol, and anemia affects 32.2% of non-pregnant women and 20% of men.
The management of several chronic health conditions necessitates routine injections, which increases its demand in medical institutions and home care environments. It is an opportunity for manufacturers to fulfill the unique needs of Oman's healthcare system and populace by providing a selection of specialty syringes and needles that are made for accurate dose administration and patient comfort.
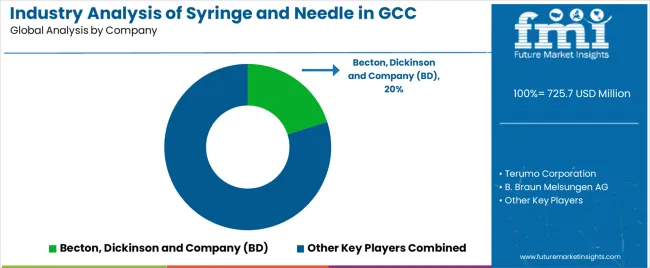
The syringe and needle industry in the GCC region is extremely competitive, with numerous established global businesses competing alongside regional players. Becton, Dickinson, and Company (BD) is an industry leader, relying on its large product range, robust distribution network, and sterling reputation to stay ahead.
Terumo Corporation, Smiths Medical, and Nipro Corporation constitute the top rivals contending for industry share, with each offering a varied selection of syringes and needles tailored to different medical specializations and uses.
Recent Developments
| Attribute | Details |
|---|---|
| Estimated Industry Size in 2025 | USD 688.5 million |
| Projected Industry Size by 2035 | USD 1,164.90 million |
| Anticipated CAGR between 2025 to 2035 | 5.40% CAGR |
| Historical Analysis of Demand for Syringes and Needles in GCC | 2020 to 2025 |
| Demand Forecast for Syringes and Needles in GCC | 2025 to 2035 |
| Report Coverage | Industry Size, Industry Trends, Analysis of Key Factors Influencing Syringes and Needles in GCC, Insights on Global Players and their Industry Strategy in GCC, Ecosystem Analysis of Local and Regional GCC Manufacturers |
| Key Countries Analyzed while Studying Opportunities in Syringes and Needles in GCC | Kingdom of Saudi Arabia (KSA), United Arab Emirates (UAE), Qatar, Bahrain, Oman, Kuwait |
| Key Companies Profiled | Becton, Dickinson and Company (BD); Terumo Corporation; Smiths Medical; Nipro Corporation; B. Braun Melsungen AG; Cardinal Health, Inc.; Gerresheimer AG; Hindustan Syringes & Medical Devices Ltd. (HMD); Medtronic plc; Fresenius SE & Co. KGaA |
The global industry analysis of syringe and needle in GCC is estimated to be valued at USD 725.7 million in 2025.
The market size for the industry analysis of syringe and needle in GCC is projected to reach USD 1,196.8 million by 2035.
The industry analysis of syringe and needle in GCC is expected to grow at a 5.1% CAGR between 2025 and 2035.
The key product types in industry analysis of syringe and needle in GCC are hypodermic, standard, special purpose and oral.
In terms of usability, disposable segment to command 80.3% share in the industry analysis of syringe and needle in GCC in 2025.


Our Research Products

The "Full Research Suite" delivers actionable market intel, deep dives on markets or technologies, so clients act faster, cut risk, and unlock growth.

The Leaderboard benchmarks and ranks top vendors, classifying them as Established Leaders, Leading Challengers, or Disruptors & Challengers.

Locates where complements amplify value and substitutes erode it, forecasting net impact by horizon

We deliver granular, decision-grade intel: market sizing, 5-year forecasts, pricing, adoption, usage, revenue, and operational KPIs—plus competitor tracking, regulation, and value chains—across 60 countries broadly.

Spot the shifts before they hit your P&L. We track inflection points, adoption curves, pricing moves, and ecosystem plays to show where demand is heading, why it is changing, and what to do next across high-growth markets and disruptive tech

Real-time reads of user behavior. We track shifting priorities, perceptions of today’s and next-gen services, and provider experience, then pace how fast tech moves from trial to adoption, blending buyer, consumer, and channel inputs with social signals (#WhySwitch, #UX).

Partner with our analyst team to build a custom report designed around your business priorities. From analysing market trends to assessing competitors or crafting bespoke datasets, we tailor insights to your needs.
Supplier Intelligence
Discovery & Profiling
Capacity & Footprint
Performance & Risk
Compliance & Governance
Commercial Readiness
Who Supplies Whom
Scorecards & Shortlists
Playbooks & Docs
Category Intelligence
Definition & Scope
Demand & Use Cases
Cost Drivers
Market Structure
Supply Chain Map
Trade & Policy
Operating Norms
Deliverables
Buyer Intelligence
Account Basics
Spend & Scope
Procurement Model
Vendor Requirements
Terms & Policies
Entry Strategy
Pain Points & Triggers
Outputs
Pricing Analysis
Benchmarks
Trends
Should-Cost
Indexation
Landed Cost
Commercial Terms
Deliverables
Brand Analysis
Positioning & Value Prop
Share & Presence
Customer Evidence
Go-to-Market
Digital & Reputation
Compliance & Trust
KPIs & Gaps
Outputs
Full Research Suite comprises of:
Market outlook & trends analysis
Interviews & case studies
Strategic recommendations
Vendor profiles & capabilities analysis
5-year forecasts
8 regions and 60+ country-level data splits
Market segment data splits
12 months of continuous data updates
DELIVERED AS:
PDF EXCEL ONLINE
Industry 4.0 Market
Industry Analysis Non-commercial Acrylic Paint in the United States Size and Share Forecast Outlook 2025 to 2035
Industry Analysis of Outbound Tourism in Germany Size and Share Forecast Outlook 2025 to 2035
Industry Analysis of Medical Device Packaging in Southeast Asia Size and Share Forecast Outlook 2025 to 2035
Industry Analysis of Paper Bag in North America Size and Share Forecast Outlook 2025 to 2035
Industry Analysis of Lidding Film in the United States Size and Share Forecast Outlook 2025 to 2035
Industry Analysis of Last-mile Delivery Software in Japan Size and Share Forecast Outlook 2025 to 2035
Industry Analysis of Automotive Lightweight Body Panel in the United States Size and Share Forecast Outlook 2025 to 2035
Industry Analysis of Electronic Skin in Japan Size and Share Forecast Outlook 2025 to 2035
Industry Analysis of Electronic Skin in Korea Size and Share Forecast Outlook 2025 to 2035
Industry Analysis of Electronic Skin in Western Europe Size and Share Forecast Outlook 2025 to 2035
Europe Second-hand Apparel Market Growth – Trends & Forecast 2024-2034
DOAS Industry Analysis in the United States Forecast and Outlook 2025 to 2035
FIBC Industry Analysis in Japan Size and Share Forecast Outlook 2025 to 2035
Pectin Industry Analysis in Japan Size and Share Forecast Outlook 2025 to 2035
Western Europe Pectin Market Analysis by Product Type, Application, and Country Through 2035
Mezcal Industry Analysis in Japan - Consumer Demand & Industry Trends in 2025
Mezcal Industry Analysis in Korea – Trends, Demand & Industry Growth
Mezcal Industry Analysis in Western Europe Report – Growth, Demand & Forecast 2025 to 2035
Asia Pacific Dental Market Analysis – Growth, Trends & Forecast 2024-2034

Thank you!
You will receive an email from our Business Development Manager. Please be sure to check your SPAM/JUNK folder too.
Chat With
MaRIA