Pest Control Services Market Size and Share Forecast Outlook 2025 to 2035

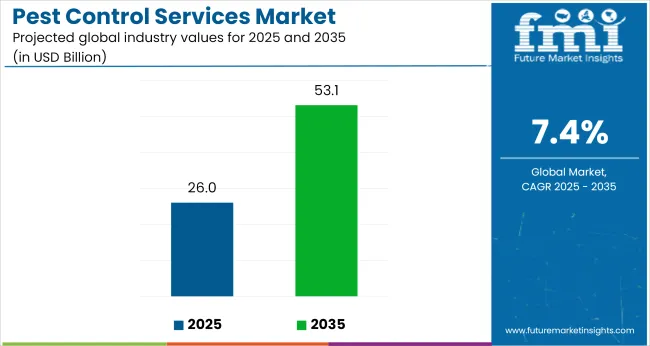
The global pest control services market is projected to expand significantly, from USD 26 billion in 2025 to USD 53.1 billion by 2035, registering a steady CAGR of 7.4% during the forecast period. The market continues to gain traction amid rising public health concerns, stricter regulatory oversight, and heightened sensitivity to sanitation across commercial, industrial, and residential zones.
Quick Stats for Pest Control Services Market

  • Market Size (2025): USD 26 Billion
  • Forecast Size (2035): USD 53.1 Billion
  • CAGR (2025 to 2035): 7.4%
  • Top Product Segment (2025): Insecticides - 61.0% share
  • Key Growth Region: Europe
  • Key Companies: Rollins, Inc., Rentokil Initial PLC, Anticimex, Cook's Pest Control, Inc., ABC Home & Commercial Services

Pest Control Services Market

Attribute Detail
Market Size (2025) USD 26 Billion
Market Size (2035) USD 53.1 Billion
CAGR (2025 to 2035) 7.4%

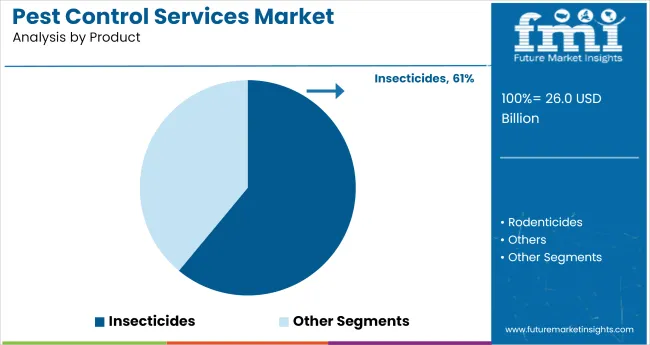
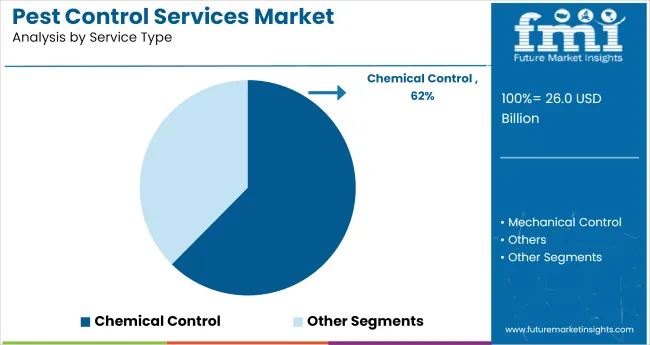
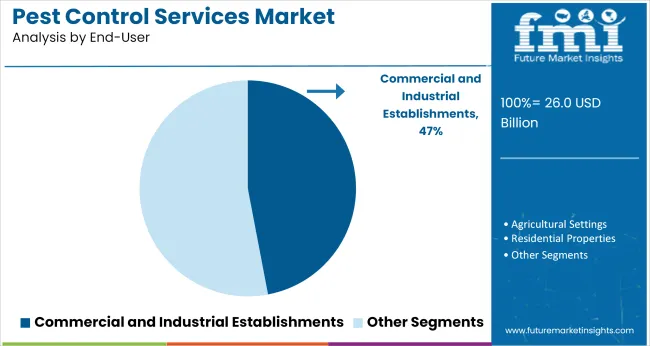
By product type, insecticides are expected to hold the dominant share at 61.0%, followed by biological agents. Chemical control services will continue leading by service type, with a 62% share in 2025. The commercial end-user segment leads at 47.0%, primarily due to recurring demand from hospitality, healthcare, and food manufacturing sectors.

The pest control services industry is witnessing transformative changes in response to health-centric and compliance-driven demands. According to a verified statement from Dominique Stumpf, CEO of the National Pest Management Association (NPMA), in an official April 3, 2025 press release,

“These impressive figures reflect the essential nature of pest management services and the industry's ability to adapt to changing economic conditions. With more than 17,000 pest control firms operating across the country and service revenue approaching USD 13 billion, our industry continues to demonstrate remarkable resilience and growth year over year.”

The pest control services market constitutes 3.2% of the broader environmental and facility services market, valued at over USD 1.1 trillion in 2025. It commands approximately 12% of the building maintenance services segment, reflecting growing demand from urban commercial and multifamily properties. Within the sanitation and public health ecosystem, pest control represents 9%, driven by regulatory mandates in food, healthcare, and hospitality sectors.

In the environmental monitoring space, it contributes around 5%, with adoption of digital tracking and IoT-based rodent and termite detection systems. As a specialized facilities sub-sector, pest control accounts for nearly 4.5% of total outsourced services spend in North America and Western Europe.

Analysis of Pest Control Services Market by Top Investment Segments

Insecticides, chemical services, and insect control dominate the pest control market, driven by commercial demand, urban infestations, and fast-acting treatments, with growing interest in organic and targeted pest management.
Insecticides Dominate Product Demand Amid Urban Infestation Risks

Pest Control Services Market Analysis By Product

Insecticides hold a dominant 61.0% share in the pest control product segment in 2025, owing to their wide applicability across households, offices, agriculture, and commercial buildings. Their effectiveness against fast-breeding pests like ants, flies, mosquitoes, and cockroaches keeps demand high, particularly in urban settings.

Available in sprays, gels, baits, and fogging concentrates, they serve short- and long-term treatment cycles. Urbanization and rising health concerns due to vector-borne diseases drive insecticide usage. However, rising regulation on synthetic chemical residues is prompting a gradual shift to bio-based alternatives.
  • Urban pest outbreaks drive 11% YoY growth in insecticide demand
  • Bio-insecticide approvals rise 18% in OECD countries post-2023
  • Cockroach gel-based baits see 9.3% CAGR in shared-housing markets

Chemical Control Services Lead but Organic Alternatives Expand

Pest Control Services Market Analysis By Service Type

Chemical control services hold the highest 62% share in 2025, offering cost-efficient and fast-acting pest elimination solutions across urban and industrial environments. These include fumigation, pesticide spraying, baiting, and insect growth regulators. Despite dominance, synthetic chemical methods face scrutiny from regulators and consumers, especially in food-service zones.

This is pushing growth in organically certified pesticides and integrated pest management (IPM) techniques. Mechanical services-though currently niche-are expanding in schools, green buildings, and elderly care homes due to residue-free outcomes. The segment’s dual-track evolution (synthetic vs. organic) reflects both regulatory trends and consumer health awareness, especially in North America and Europe.
  • Organic chemical services post 6.8% CAGR amid rising eco-certification
  • WHO guidelines restrict synthetic fumigants in food packaging zones
  • IPM-based pest control adoption increases 12% in EU hospitality sector

Commercial Segment Drives Recurring Service Contracts and Upgrades

Pest Control Services Market Analysis By End User

The commercial end-user segment represents a 47.0% share in 2025 and includes demand from sectors like hospitality, healthcare, retail, education, and warehousing. Commercial facilities rely on regular pest monitoring, preventive fumigation, and fast-response services to maintain health standards and comply with pest control regulations.

This segment benefits from multi-year service contracts, automated surveillance systems, and off-hour servicing models to minimize disruption. Residential end-users are rising due to increasing consumer awareness, with DIY pest control kits and subscription-based services gaining traction. Agricultural end-users seek specialized rodent and insect control, particularly for export-oriented crops and greenhouses under GAP (Good Agricultural Practices) certification.

  • 3-year commercial contracts grow 14% YoY across global hospitality chains
  • Residential pest control sees 10.5% CAGR in India and Brazil post-2024
  • Smart traps and IoT sensors deployed in 26% of commercial facilities in 2025

Insect Control Leads as Vector-Borne Disease Concerns Rise

Insect control dominates application-wise with a 73.6% share in 2025 due to growing incidence of dengue, malaria, chikungunya, and fly-borne illnesses. Services such as fogging, larvicide treatments, and perimeter sprays are widely deployed by municipalities, residential complexes, and schools. Indoor pest control includes gel baits and surface sprays for cockroach and ant infestations.

Outdoor services focus on mosquito breeding site eradication and fly trap deployment. Meanwhile, rodent control is gaining traction in logistics and food sectors. Termites and bed bugs remain stubborn infestations, especially in high-occupancy zones such as hotels and dormitories, demanding specialized thermal and chemical treatments.

  • Mosquito-borne disease hotspots trigger 23% spike in fogging services globally
  • Thermal termite treatment adoption rises 15% in urban North American homes
  • Integrated cockroach control solutions expand 11% in Southeast Asia

Top Pest Control Services Market Dynamics

Expert pest treatments with certified technicians and eco-conscious methods are dominating the pest control services market. Recurring inspection plans and low-impact treatments are shaping customer choices and service standards.

Heightened Demand for Expert Pest Interventions

Homeowners and businesses are increasingly opting for professional pest treatments to counter infestations of rodents, termites, and bedbugs. These services are being driven by the need to protect property and health. Pest control firms are expanding mobile response teams and year-round coverage. Accredited certification programs are being completed by technicians to ensure proper application of chemicals and safety procedures. Service packages now offer routine inspections, emergency calls, and seasonal treatments.

  • Subscription plans featuring quarterly property inspections are gaining traction.
  • Licensed technicians are now required by most service contracts.
  • Emergency-response teams are deployed rapidly for infestation outbreaks.

Integration of Eco-Conscious Treatment Methods

Clients are requesting greener methods that minimize chemical exposure. Pest control providers are adopting treatments such as heat-based elimination, targeted baiting, and botanical sprays. Training on conservation-conscious techniques is being provided to staff. Materials like insect growth regulators and food-grade diatomaceous earth are being used to limit harm to non-target species. This shift in service methods is also influencing pricing models and service transparency, as treatment reports describe chemical choices and environmental safeguards.
  • Use of botanical repellents and food-grade dust is increasing.
  • Heat remediation systems are being offered for bedbug and termite control.
  • Service documents now include detailed disclosure of applied substances.

Top Countries Administering, Regulating, and Scaling Pest Control Services

Country Wise Analysis Of Pest Control Services Market

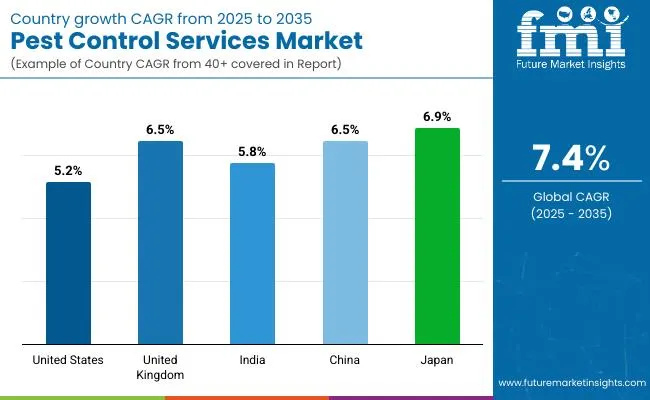
Countries CAGR (2025 to 2035)
United States 5.2%
United Kingdom 6.5%
India 5.8%
China 6.5%
Japan 6.9%

The global pest control services market is forecast to grow at a 7.4% CAGR from 2025 to 2035, yet major economies fall short of this pace. Japan leads among them at 6.9%, where aging buildings, humid summers, and rising food safety audits under HACCP protocols are pushing demand. China and the UK, both at 6.5%, are driven by regulatory tightening in urban housing and commercial kitchens.

India grows at 5.8%, constrained by unorganized operators handling over 55% of service volume. The United States, at 5.2%, reflects an OECD trend-mature markets relying on tech-enabled traps, ESG-aligned contracts, and facility-wide hygiene outsourcing. The report covers detailed analysis of 40+ countries and the top five countries have been shared as a reference.

Expansion Outlook for the Pest Control Services Market in the United States

Pest management services in the United States are projected to grow at a CAGR of 5.2% from 2025 to 2035, as infestations increase in climate-sensitive urban environments. Subterranean termites and rodents are becoming more prevalent in high-density metros and suburban sprawl zones. Facilities such as senior living centers and hospitals require low-toxicity, continuous monitoring services.

Online booking platforms have made it easier for households to schedule regular treatments. Commercial businesses in hospitality and foodservice are adopting multi-year service contracts. Demand continues to rise for eco-safe formulations, especially in schools, offices, and buildings with pet and child occupancy.

  • Multi-site businesses prefer bundled national contracts with 24/7 service access.
  • Weather-driven outbreaks are pushing pest firms to adapt treatment cycles.
  • Smart traps and digital monitoring systems improve urban service precision.

Market Growth Momentum for Pest Control Services in the United Kingdom

With a CAGR forecast of 6.5% between 2025 and 2035, pest control solutions across the United Kingdom are witnessing high traction in both residential and public-sector facilities. Aged infrastructure in cities like London and Glasgow is leading to increased rodent and damp-related pest complaints. Local councils and NHS-linked care facilities are outsourcing more routine pest management.

The industry is shifting toward chemical-free methods, especially in schools and housing associations. Demand is also rising from logistics, retail, and foodservice sites, where hygiene scoring standards remain high. Rising pest resistance has driven innovation in multi-step treatment protocols.

  • Contracted pest services now dominate public building maintenance rosters.
  • Consumer demand is moving toward no-kill and biodegradable options.
  • Post-Brexit regulations impact chemical use and approved treatment materials.

Growing Formalization in Indian Pest Control Landscape

A CAGR of 5.8% from 2025 to 2035 reflects how pest control services are formalizing across India’s expanding real estate and commercial infrastructure. As vector-borne disease cases rise, gated housing societies, hospitals, and food warehouses are turning to certified vendors for year-round pest coverage.

The shift from informal sprayers to branded players is accelerating in tier-2 and tier-3 cities. E-commerce platforms now offer one-click bookings and subscription services. Hospitals and hotels lead in demand for odorless, non-staining treatments. Building maintenance companies increasingly include pest control in post-handover facility management packages.

  • Integrated pest contracts are now standard in housing society maintenance.
  • Organized players outperform through safe, certified treatment models.
  • App-based pest control bookings are growing in mid-size urban markets.

Innovation and Expansion Across the Pest Services Sector in China

At a projected CAGR of 6.5% between 2025 and 2035, pest control services in China are expanding rapidly through digital adoption and large-scale commercial compliance. Mega cities are experiencing higher pest loads due to warming weather, increased construction, and dense housing.

Developers are mandating pre-treatment and long-term pest service for new residential blocks. Export-oriented food and pharma manufacturers require globally certified pest protocols. AI-enabled traps and QR-based reporting are common in smart buildings. Services are scaling across the eastern provinces as logistics and cold chain facilities demand round-the-clock pest surveillance and reporting.

  • High-growth cities require advanced treatment for rising insect and rodent density
  • QR-verified services support audit compliance in pharma and food sectors.
  • Developers embed pest control in building delivery agreements.

Advanced Solutions Powering Pest Control Services in Japan

Forecasted to expand at a CAGR of 6.9% from 2025 to 2035, the pest control service industry in Japan is seeing rapid uptake of discreet, tech-enabled solutions. Ageing population clusters have created heightened demand for pest management in elder care homes. Flood-prone zones and humid summers amplify termite and mosquito activity.

Traditional wooden structures in Kyoto and smaller towns are especially susceptible. Precision tools like ultrasonic sensors and robotic sprayers are entering the market. Commercial establishments in foodservice and tourism seek odor-free, low-disruption services that match hospitality compliance codes.

  • Thermal imaging is now used for early termite detection in heritage buildings.
  • Year-round service contracts are trending in elder care and clinics.
  • Typhoon-hit areas experience seasonal pest spikes requiring emergency services.

Leading Pest Control Services Market Suppliers

The pest control services market is led by dominant players such as Rollins, Inc., Rentokil Initial PLC, and Ecolab, Inc., recognized for their global service networks, advanced pest management technologies, and strong brand trust across residential, commercial, and industrial sectors. Key players including Anticimex, Massey Services, Inc., and Arrow Exterminators emphasize integrated pest management (IPM), customer-centric models, and geographic expansion. Emerging players like Green Pest Solutions, Apex Pest Control, LLC, and Hulett Environmental Services target regional markets with eco-friendly methods, digital scheduling, and competitive pricing.

Recent Industry News

  • Rollins, Inc. acquired Saela Holdings, LLC in April 2025, expanding its USA presence across nine states. Saela, with over USD 65 million in revenue, will operate independently. The deal strengthens Rollins’ market share through strategic regional and residential service growth.
  • Rentokil Initial CEO Andy Ransom announced his retirement by 2026, after leading the company for over a decade and overseeing the USD 6.7 billion Terminix acquisition. The board has begun succession planning to ensure continuity and renewed focus on USA operations.

Key Players

  • Rollins, Inc.
  • Rentokil Initial PLC
  • Anticimex
  • Cook's Pest Control, Inc.
  • ABC Home & Commercial Services
  • Animal Pest Management Services, Inc.
  • Lloyd Pest Control
  • Green Earth Pest Control, LLC
  • Aptive Environmental, LLC
  • Home Paramount Pest Control, LLC
  • Dodson Pest Control
  • Environmental Pest Service, LLC
  • Truly Nolen of America, Inc.
  • Florida Pest Control & Chemical
  • Massey Services, Inc.
  • Arrow Exterminators
  • Ecolab, Inc.
  • Green Pest Solutions
  • Apex Pest Control, Inc.
  • Hulett Environmental Services
  • Plunkett's Pest Control
  • Senske, Inc.

Report Scope

Report Attributes Details
Market Size (2025) USD 26 Billion
Projected Market Size (2035) USD 53.1 Billion
CAGR (2025 to 2035) 7.4%
Base Year for Estimation 2024
Historical Period 2020 to 2024
Forecast Period 2025 to 2035
Quantitative Units USD Billion (Value), Million Treatments (Volume)
Product Segments (Segment 1) Insecticides, Rodenticides, Other Products
Service Type Segments (Segment 2) Chemical Control (Organic, Synthetic), Mechanical Control, Other Pest Control Services
End-User Segments (Segment 3) Residential, Commercial & Industrial, Agricultural
Application Segments (Segment 4) Rodent Control, Insect Control, Cockroaches, Ants, Bed Bugs, Termites, Mosquitoes, Wasps, Flies, Birds, Fleas, Others
Countries Covered United States, Canada, Mexico, Brazil, Argentina, Germany, France, United Kingdom, Italy, Spain, China, Japan, India, South Korea, Australia, Saudi Arabia, UAE, South Africa
States Covered California, Texas, Florida, New York, Illinois, Georgia, North Carolina, Pennsylvania, Ohio, Michigan
Key Players Influencing the Market Rollins, Inc., Rentokil Initial PLC, Anticimex, Cook's Pest Control, Inc., ABC Home & Commercial Services, Ecolab, Inc., Truly Nolen of America, Massey Services, Arrow Exterminators, Plunkett's Pest Control, Hulett Environmental Services
Additional Attributes Dollar by sales, share, product-wise revenue distribution, region-wise demand variation, fastest-growing application types, pest-specific service adoption patterns, and customer segment expansion insights for residential and industrial clients.

Key Segments

By Product:

The market is segmented into insecticides, rodenticides, and various other pest control products.

By Service Type:

Services are categorized into chemical control (organic and synthetic), mechanical control, and other pest control services.

By End-user:

End-users include residential properties, commercial and industrial establishments, and agricultural settings.

By Application:

Applications encompass rodent control, insect control, and treatment for pests such as cockroaches, ants, bed bugs, termites, mosquitoes, wasps, flies, birds, fleas, and others.

By Region:

Regional analysis includes North America, Latin America, Europe, South Asia, East Asia, Oceania, and the Middle East and Africa.

Table of Content

  1. Executive Summary
    • Global Market Outlook
    • Demand-side Trends
    • Supply-side Trends
    • Technology Roadmap Analysis
    • Analysis and Recommendations
  2. Market Overview
    • Market Coverage/Taxonomy
    • Market Definition/Scope/Limitations
  3. Market Background
    • Market Dynamics
      • Drivers
      • Restraints
      • Opportunity
      • Trends
    • Scenario Forecast
      • Demand in Optimistic Scenario
      • Demand in Likely Scenario
      • Demand in Conservative Scenario
    • Opportunity Map Analysis
    • Product Life Cycle Analysis
    • Supply Chain Analysis
      • Supply Side Participants and their Roles
        • Producers
        • Mid-Level Participants (Traders/ Agents/ Brokers)
        • Wholesalers and Distributors
      • Value Added and Value Created at Node in the Supply Chain
      • List of Raw Material Suppliers
      • List of Existing and Potential Buyer’s
    • Investment Feasibility Matrix
    • Value Chain Analysis
      • Profit Margin Analysis
      • Wholesalers and Distributors
      • Retailers
    • PESTLE and Porter’s Analysis
    • Regulatory Landscape
      • By Key Regions
      • By Key Countries
    • Regional Parent Market Outlook
    • Production and Consumption Statistics
    • Import and Export Statistics
  4. Global Market Analysis 2020 to 2024 and Forecast, 2025 to 2035
    • Historical Market Size Value (USD Billion) & Volume (kilotons) Analysis, 2020 to 2024
    • Current and Future Market Size Value (USD Billion) & Volume (kilotons) Projections, 2025 to 2035
      • Y-o-Y Growth Trend Analysis
      • Absolute $ Opportunity Analysis
  5. Global Market Pricing Analysis 2020 to 2024 and Forecast 2025 to 2035
  6. Global Market Analysis 2020 to 2024 and Forecast 2025 to 2035, By Product
    • Introduction/Key Findings
    • Historical Market Size Value (USD Billion) & Volume (kilotons) Analysis By Product, 2020 to 2024
    • Current and Future Market Size Value (USD Billion) & Volume (kilotons) Analysis and Forecast By Product, 2025 to 2035
      • Insecticides
      • Rodenticides
      • Others
    • Y-o-Y Growth Trend Analysis By Product, 2020 to 2024
    • Absolute $ Opportunity Analysis By Product, 2025 to 2035
  7. Global Market Analysis 2020 to 2024 and Forecast 2025 to 2035, By Service Type
    • Introduction/Key Findings
    • Historical Market Size Value (USD Billion) & Volume (kilotons) Analysis By Service Type, 2020 to 2024
    • Current and Future Market Size Value (USD Billion) & Volume (kilotons) Analysis and Forecast By Service Type, 2025 to 2035
      • Chemical Control
        • Organic
        • Synthetic
      • Mechanical Control
      • Others
    • Y-o-Y Growth Trend Analysis By Service Type, 2020 to 2024
    • Absolute $ Opportunity Analysis By Service Type, 2025 to 2035
  8. Global Market Analysis 2020 to 2024 and Forecast 2025 to 2035, By End-user
    • Introduction/Key Findings
    • Historical Market Size Value (USD Billion) & Volume (kilotons) Analysis By End-user, 2020 to 2024
    • Current and Future Market Size Value (USD Billion) & Volume (kilotons) Analysis and Forecast By End-user, 2025 to 2035
      • residential properties
      • Commercial and Industrial Establishments
      • Agricultural Settings
    • Y-o-Y Growth Trend Analysis By End-user, 2020 to 2024
    • Absolute $ Opportunity Analysis By End-user, 2025 to 2035
  9. Global Market Analysis 2020 to 2024 and Forecast 2025 to 2035, By Application
    • Introduction/Key Findings
    • Historical Market Size Value (USD Billion) & Volume (kilotons) Analysis By Application, 2020 to 2024
    • Current and Future Market Size Value (USD Billion) & Volume (kilotons) Analysis and Forecast By Application, 2025 to 2035
      • Rodent Control
      • Insect Control
      • Treatment for Pests
        • Cockroaches
        • Ants
        • Bed Bugs
        • Termites
        • Others
    • Y-o-Y Growth Trend Analysis By Application, 2020 to 2024
    • Absolute $ Opportunity Analysis By Application, 2025 to 2035
  10. Global Market Analysis 2020 to 2024 and Forecast 2025 to 2035, By Region
    • Introduction
    • Historical Market Size Value (USD Billion) & Volume (kilotons) Analysis By Region, 2020 to 2024
    • Current Market Size Value (USD Billion) & Volume (kilotons) Analysis and Forecast By Region, 2025 to 2035
      • North America
      • Latin America
      • Western Europe
      • Eastern Europe
      • East Asia
      • South Asia & Pacific
      • Middle East and Africa
    • Market Attractiveness Analysis By Region
  11. North America Market Analysis 2020 to 2024 and Forecast 2025 to 2035, By Country
    • Historical Market Size Value (USD Billion) & Volume (kilotons) Trend Analysis By Market Taxonomy, 2020 to 2024
    • Market Size Value (USD Billion) & Volume (kilotons) Forecast By Market Taxonomy, 2025 to 2035
      • By Country
        • USA
        • Canada
        • Mexico
      • By Product
      • By Service Type
      • By End-user
      • By Application
    • Market Attractiveness Analysis
      • By Country
      • By Product
      • By Service Type
      • By End-user
      • By Application
    • Key Takeaways
  12. Latin America Market Analysis 2020 to 2024 and Forecast 2025 to 2035, By Country
    • Historical Market Size Value (USD Billion) & Volume (kilotons) Trend Analysis By Market Taxonomy, 2020 to 2024
    • Market Size Value (USD Billion) & Volume (kilotons) Forecast By Market Taxonomy, 2025 to 2035
      • By Country
        • Brazil
        • Argentina
        • Rest of LATAM
      • By Product
      • By Service Type
      • By End-user
      • By Application
    • Market Attractiveness Analysis
      • By Country
      • By Product
      • By Service Type
      • By End-user
      • By Application
    • Key Takeaways
  13. Western Europe Market Analysis 2020 to 2024 and Forecast 2025 to 2035, By Country
    • Historical Market Size Value (USD Billion) & Volume (kilotons) Trend Analysis By Market Taxonomy, 2020 to 2024
    • Market Size Value (USD Billion) & Volume (kilotons) Forecast By Market Taxonomy, 2025 to 2035
      • By Country
        • Germany
        • Italy
        • France
        • UK
        • Spain
        • BENELUX
        • Nordic
        • Rest of W.Europe
      • By Product
      • By Service Type
      • By End-user
      • By Application
    • Market Attractiveness Analysis
      • By Country
      • By Product
      • By Service Type
      • By End-user
      • By Application
    • Key Takeaways
  14. Eastern Europe Market Analysis 2020 to 2024 and Forecast 2025 to 2035, By Country
    • Historical Market Size Value (USD Billion) & Volume (kilotons) Trend Analysis By Market Taxonomy, 2020 to 2024
    • Market Size Value (USD Billion) & Volume (kilotons) Forecast By Market Taxonomy, 2025 to 2035
      • By Country
        • Russia
        • Hungary
        • Poland
        • Balkan & Baltics
        • Rest of E. Europe
      • By Product
      • By Service Type
      • By End-user
      • By Application
    • Market Attractiveness Analysis
      • By Country
      • By Product
      • By Service Type
      • By End-user
      • By Application
    • Key Takeaways
  15. East Asia Market Analysis 2020 to 2024 and Forecast 2025 to 2035, By Country
    • Historical Market Size Value (USD Billion) & Volume (kilotons) Trend Analysis By Market Taxonomy, 2020 to 2024
    • Market Size Value (USD Billion) & Volume (kilotons) Forecast By Market Taxonomy, 2025 to 2035
      • By Country
        • China
        • Japan
        • South Korea
      • By Product
      • By Service Type
      • By End-user
      • By Application
    • Market Attractiveness Analysis
      • By Country
      • By Product
      • By Service Type
      • By End-user
      • By Application
    • Key Takeaways
  16. South Asia & Pacific Market Analysis 2020 to 2024 and Forecast 2025 to 2035, By Country
    • Historical Market Size Value (USD Billion) & Volume (kilotons) Trend Analysis By Market Taxonomy, 2020 to 2024
    • Market Size Value (USD Billion) & Volume (kilotons) Forecast By Market Taxonomy, 2025 to 2035
      • By Country
        • India
        • Australia & New Zealand
        • ASEAN
        • Rest of SAP
      • By Product
      • By Service Type
      • By End-user
      • By Application
    • Market Attractiveness Analysis
      • By Country
      • By Product
      • By Service Type
      • By End-user
      • By Application
    • Key Takeaways
  17. Middle East and Africa Market Analysis 2020 to 2024 and Forecast 2025 to 2035, By Country
    • Historical Market Size Value (USD Billion) & Volume (kilotons) Trend Analysis By Market Taxonomy, 2020 to 2024
    • Market Size Value (USD Billion) & Volume (kilotons) Forecast By Market Taxonomy, 2025 to 2035
      • By Country
        • GCC Countries
        • Northern Africa
        • South Africa
        • Turkiye
        • Rest of MEA
      • By Product
      • By Service Type
      • By End-user
      • By Application
    • Market Attractiveness Analysis
      • By Country
      • By Product
      • By Service Type
      • By End-user
      • By Application
    • Key Takeaways
  18. Key Countries Market Analysis
    • USA
      • Pricing Analysis
      • Market Share Analysis, 2024
        • By Product
        • By Service Type
        • By End-user
        • By Application
    • Canada
      • Pricing Analysis
      • Market Share Analysis, 2024
        • By Product
        • By Service Type
        • By End-user
        • By Application
    • Brazil
      • Pricing Analysis
      • Market Share Analysis, 2024
        • By Product
        • By Service Type
        • By End-user
        • By Application
    • Mexico
      • Pricing Analysis
      • Market Share Analysis, 2024
        • By Product
        • By Service Type
        • By End-user
        • By Application
    • Argentina
      • Pricing Analysis
      • Market Share Analysis, 2024
        • By Product
        • By Service Type
        • By End-user
        • By Application
  19. Market Structure Analysis
    • Competition Dashboard
    • Competition Benchmarking
    • Market Share Analysis of Top Players
      • By Regional
      • By Product
      • By Service Type
      • By End-user
      • By Application
  20. Competition Analysis
    • Competition Deep Dive
      • Rollins, Inc.
        • Overview
        • Product Portfolio
        • Profitability by Market Segments (Product/Age /Sales Channel/Region)
        • Sales Footprint
        • Strategy Overview
          • Marketing Strategy
          • Product Strategy
          • Channel Strategy
      • Rentokil Initial PLC
        • Overview
        • Product Portfolio
        • Profitability by Market Segments (Product/Age /Sales Channel/Region)
        • Sales Footprint
        • Strategy Overview
          • Marketing Strategy
          • Product Strategy
          • Channel Strategy
      • Anticimex
        • Overview
        • Product Portfolio
        • Profitability by Market Segments (Product/Age /Sales Channel/Region)
        • Sales Footprint
        • Strategy Overview
          • Marketing Strategy
          • Product Strategy
          • Channel Strategy
      • Cook's Pest Control, Inc.
        • Overview
        • Product Portfolio
        • Profitability by Market Segments (Product/Age /Sales Channel/Region)
        • Sales Footprint
        • Strategy Overview
          • Marketing Strategy
          • Product Strategy
          • Channel Strategy
      • ABC Home & Commercial Services
        • Overview
        • Product Portfolio
        • Profitability by Market Segments (Product/Age /Sales Channel/Region)
        • Sales Footprint
        • Strategy Overview
          • Marketing Strategy
          • Product Strategy
          • Channel Strategy
      • Animal Pest Management Services, Inc.
        • Overview
        • Product Portfolio
        • Profitability by Market Segments (Product/Age /Sales Channel/Region)
        • Sales Footprint
        • Strategy Overview
          • Marketing Strategy
          • Product Strategy
          • Channel Strategy
      • Lloyd Pest Control
        • Overview
        • Product Portfolio
        • Profitability by Market Segments (Product/Age /Sales Channel/Region)
        • Sales Footprint
        • Strategy Overview
          • Marketing Strategy
          • Product Strategy
          • Channel Strategy
      • Green Earth Pest Control, LLC
        • Overview
        • Product Portfolio
        • Profitability by Market Segments (Product/Age /Sales Channel/Region)
        • Sales Footprint
        • Strategy Overview
          • Marketing Strategy
          • Product Strategy
          • Channel Strategy
      • Aptive Environmental, LLC
        • Overview
        • Product Portfolio
        • Profitability by Market Segments (Product/Age /Sales Channel/Region)
        • Sales Footprint
        • Strategy Overview
          • Marketing Strategy
          • Product Strategy
          • Channel Strategy
      • Home Paramount Pest Control, LLC
        • Overview
        • Product Portfolio
        • Profitability by Market Segments (Product/Age /Sales Channel/Region)
        • Sales Footprint
        • Strategy Overview
          • Marketing Strategy
          • Product Strategy
          • Channel Strategy
      • Dodson Pest Control
        • Overview
        • Product Portfolio
        • Profitability by Market Segments (Product/Age /Sales Channel/Region)
        • Sales Footprint
        • Strategy Overview
          • Marketing Strategy
          • Product Strategy
          • Channel Strategy
      • Environmental Pest Service, LLC
        • Overview
        • Product Portfolio
        • Profitability by Market Segments (Product/Age /Sales Channel/Region)
        • Sales Footprint
        • Strategy Overview
          • Marketing Strategy
          • Product Strategy
          • Channel Strategy
      • Truly Nolen of America, Inc.
        • Overview
        • Product Portfolio
        • Profitability by Market Segments (Product/Age /Sales Channel/Region)
        • Sales Footprint
        • Strategy Overview
          • Marketing Strategy
          • Product Strategy
          • Channel Strategy
      • Florida Pest Control & Chemical
        • Overview
        • Product Portfolio
        • Profitability by Market Segments (Product/Age /Sales Channel/Region)
        • Sales Footprint
        • Strategy Overview
          • Marketing Strategy
          • Product Strategy
          • Channel Strategy
      • Massey Services, Inc.
        • Overview
        • Product Portfolio
        • Profitability by Market Segments (Product/Age /Sales Channel/Region)
        • Sales Footprint
        • Strategy Overview
          • Marketing Strategy
          • Product Strategy
          • Channel Strategy
      • Arrow Exterminators
        • Overview
        • Product Portfolio
        • Profitability by Market Segments (Product/Age /Sales Channel/Region)
        • Sales Footprint
        • Strategy Overview
          • Marketing Strategy
          • Product Strategy
          • Channel Strategy
      • Ecolab, Inc.
        • Overview
        • Product Portfolio
        • Profitability by Market Segments (Product/Age /Sales Channel/Region)
        • Sales Footprint
        • Strategy Overview
          • Marketing Strategy
          • Product Strategy
          • Channel Strategy
      • Green Pest Solutions
        • Overview
        • Product Portfolio
        • Profitability by Market Segments (Product/Age /Sales Channel/Region)
        • Sales Footprint
        • Strategy Overview
          • Marketing Strategy
          • Product Strategy
          • Channel Strategy
      • Apex Pest Control, Inc.
        • Overview
        • Product Portfolio
        • Profitability by Market Segments (Product/Age /Sales Channel/Region)
        • Sales Footprint
        • Strategy Overview
          • Marketing Strategy
          • Product Strategy
          • Channel Strategy
      • Hulett Environmental Services
        • Overview
        • Product Portfolio
        • Profitability by Market Segments (Product/Age /Sales Channel/Region)
        • Sales Footprint
        • Strategy Overview
          • Marketing Strategy
          • Product Strategy
          • Channel Strategy
  21. Assumptions & Acronyms Used
  22. Research Methodology

List of Tables

  • Table 1: Global Market Value (USD Billion) Forecast by Region, 2020-2035
  • Table 2: Global Market Volume (kilotons) Forecast by Region, 2020-2035
  • Table 3: Global Market Value (USD Billion) Forecast by Product, 2020-2035
  • Table 4: Global Market Volume (kilotons) Forecast by Product, 2020-2035
  • Table 5: Global Market Value (USD Billion) Forecast by Service Type, 2020-2035
  • Table 6: Global Market Volume (kilotons) Forecast by Service Type, 2020-2035
  • Table 7: Global Market Value (USD Billion) Forecast by End-user, 2020-2035
  • Table 8: Global Market Volume (kilotons) Forecast by End-user, 2020-2035
  • Table 9: Global Market Value (USD Billion) Forecast by Application, 2020-2035
  • Table 10: Global Market Volume (kilotons) Forecast by Application, 2020-2035
  • Table 11: North America Market Value (USD Billion) Forecast by Country, 2020-2035
  • Table 12: North America Market Volume (kilotons) Forecast by Country, 2020-2035
  • Table 13: North America Market Value (USD Billion) Forecast by Product, 2020-2035
  • Table 14: North America Market Volume (kilotons) Forecast by Product, 2020-2035
  • Table 15: North America Market Value (USD Billion) Forecast by Service Type, 2020-2035
  • Table 16: North America Market Volume (kilotons) Forecast by Service Type, 2020-2035
  • Table 17: North America Market Value (USD Billion) Forecast by End-user, 2020-2035
  • Table 18: North America Market Volume (kilotons) Forecast by End-user, 2020-2035
  • Table 19: North America Market Value (USD Billion) Forecast by Application, 2020-2035
  • Table 20: North America Market Volume (kilotons) Forecast by Application, 2020-2035
  • Table 21: Latin America Market Value (USD Billion) Forecast by Country, 2020-2035
  • Table 22: Latin America Market Volume (kilotons) Forecast by Country, 2020-2035
  • Table 23: Latin America Market Value (USD Billion) Forecast by Product, 2020-2035
  • Table 24: Latin America Market Volume (kilotons) Forecast by Product, 2020-2035
  • Table 25: Latin America Market Value (USD Billion) Forecast by Service Type, 2020-2035
  • Table 26: Latin America Market Volume (kilotons) Forecast by Service Type, 2020-2035
  • Table 27: Latin America Market Value (USD Billion) Forecast by End-user, 2020-2035
  • Table 28: Latin America Market Volume (kilotons) Forecast by End-user, 2020-2035
  • Table 29: Latin America Market Value (USD Billion) Forecast by Application, 2020-2035
  • Table 30: Latin America Market Volume (kilotons) Forecast by Application, 2020-2035
  • Table 31: Western Europe Market Value (USD Billion) Forecast by Country, 2020-2035
  • Table 32: Western Europe Market Volume (kilotons) Forecast by Country, 2020-2035
  • Table 33: Western Europe Market Value (USD Billion) Forecast by Product, 2020-2035
  • Table 34: Western Europe Market Volume (kilotons) Forecast by Product, 2020-2035
  • Table 35: Western Europe Market Value (USD Billion) Forecast by Service Type, 2020-2035
  • Table 36: Western Europe Market Volume (kilotons) Forecast by Service Type, 2020-2035
  • Table 37: Western Europe Market Value (USD Billion) Forecast by End-user, 2020-2035
  • Table 38: Western Europe Market Volume (kilotons) Forecast by End-user, 2020-2035
  • Table 39: Western Europe Market Value (USD Billion) Forecast by Application, 2020-2035
  • Table 40: Western Europe Market Volume (kilotons) Forecast by Application, 2020-2035
  • Table 41: Eastern Europe Market Value (USD Billion) Forecast by Country, 2020-2035
  • Table 42: Eastern Europe Market Volume (kilotons) Forecast by Country, 2020-2035
  • Table 43: Eastern Europe Market Value (USD Billion) Forecast by Product, 2020-2035
  • Table 44: Eastern Europe Market Volume (kilotons) Forecast by Product, 2020-2035
  • Table 45: Eastern Europe Market Value (USD Billion) Forecast by Service Type, 2020-2035
  • Table 46: Eastern Europe Market Volume (kilotons) Forecast by Service Type, 2020-2035
  • Table 47: Eastern Europe Market Value (USD Billion) Forecast by End-user, 2020-2035
  • Table 48: Eastern Europe Market Volume (kilotons) Forecast by End-user, 2020-2035
  • Table 49: Eastern Europe Market Value (USD Billion) Forecast by Application, 2020-2035
  • Table 50: Eastern Europe Market Volume (kilotons) Forecast by Application, 2020-2035
  • Table 51: East Asia Market Value (USD Billion) Forecast by Country, 2020-2035
  • Table 52: East Asia Market Volume (kilotons) Forecast by Country, 2020-2035
  • Table 53: East Asia Market Value (USD Billion) Forecast by Product, 2020-2035
  • Table 54: East Asia Market Volume (kilotons) Forecast by Product, 2020-2035
  • Table 55: East Asia Market Value (USD Billion) Forecast by Service Type, 2020-2035
  • Table 56: East Asia Market Volume (kilotons) Forecast by Service Type, 2020-2035
  • Table 57: East Asia Market Value (USD Billion) Forecast by End-user, 2020-2035
  • Table 58: East Asia Market Volume (kilotons) Forecast by End-user, 2020-2035
  • Table 59: East Asia Market Value (USD Billion) Forecast by Application, 2020-2035
  • Table 60: East Asia Market Volume (kilotons) Forecast by Application, 2020-2035
  • Table 61: South Asia & Pacific Market Value (USD Billion) Forecast by Country, 2020-2035
  • Table 62: South Asia & Pacific Market Volume (kilotons) Forecast by Country, 2020-2035
  • Table 63: South Asia & Pacific Market Value (USD Billion) Forecast by Product, 2020-2035
  • Table 64: South Asia & Pacific Market Volume (kilotons) Forecast by Product, 2020-2035
  • Table 65: South Asia & Pacific Market Value (USD Billion) Forecast by Service Type, 2020-2035
  • Table 66: South Asia & Pacific Market Volume (kilotons) Forecast by Service Type, 2020-2035
  • Table 67: South Asia & Pacific Market Value (USD Billion) Forecast by End-user, 2020-2035
  • Table 68: South Asia & Pacific Market Volume (kilotons) Forecast by End-user, 2020-2035
  • Table 69: South Asia & Pacific Market Value (USD Billion) Forecast by Application, 2020-2035
  • Table 70: South Asia & Pacific Market Volume (kilotons) Forecast by Application, 2020-2035
  • Table 71: Middle East and Africa Market Value (USD Billion) Forecast by Country, 2020-2035
  • Table 72: Middle East and Africa Market Volume (kilotons) Forecast by Country, 2020-2035
  • Table 73: Middle East and Africa Market Value (USD Billion) Forecast by Product, 2020-2035
  • Table 74: Middle East and Africa Market Volume (kilotons) Forecast by Product, 2020-2035
  • Table 75: Middle East and Africa Market Value (USD Billion) Forecast by Service Type, 2020-2035
  • Table 76: Middle East and Africa Market Volume (kilotons) Forecast by Service Type, 2020-2035
  • Table 77: Middle East and Africa Market Value (USD Billion) Forecast by End-user, 2020-2035
  • Table 78: Middle East and Africa Market Volume (kilotons) Forecast by End-user, 2020-2035
  • Table 79: Middle East and Africa Market Value (USD Billion) Forecast by Application, 2020-2035
  • Table 80: Middle East and Africa Market Volume (kilotons) Forecast by Application, 2020-2035

List of Figures

  • Figure 1: Global Market Volume (kilotons) Forecast 2020-2035
  • Figure 2: Global Market Pricing Analysis
  • Figure 3: Global Market Value (US$ Bn) Forecast 2020-2035
  • Figure 4: Global Market Value Share and BPS Analysis by Product, 2025 and 2035
  • Figure 5: Global Market Y-o-Y Growth Comparison by Product, 2025-2035
  • Figure 6: Global Market Attractiveness Analysis by Product
  • Figure 7: Global Market Value Share and BPS Analysis by Service Type, 2025 and 2035
  • Figure 8: Global Market Y-o-Y Growth Comparison by Service Type, 2025-2035
  • Figure 9: Global Market Attractiveness Analysis by Service Type
  • Figure 10: Global Market Value Share and BPS Analysis by End-user, 2025 and 2035
  • Figure 11: Global Market Y-o-Y Growth Comparison by End-user, 2025-2035
  • Figure 12: Global Market Attractiveness Analysis by End-user
  • Figure 13: Global Market Value Share and BPS Analysis by Application, 2025 and 2035
  • Figure 14: Global Market Y-o-Y Growth Comparison by Application, 2025-2035
  • Figure 15: Global Market Attractiveness Analysis by Application
  • Figure 16: Global Market Value (US$ Bn) Share and BPS Analysis by Region, 2025 and 2035
  • Figure 17: Global Market Y-o-Y Growth Comparison by Region, 2025-2035
  • Figure 18: Global Market Attractiveness Analysis by Region
  • Figure 19: North America Market Incremental $ Opportunity, 2025-2035
  • Figure 20: Latin America Market Incremental $ Opportunity, 2025-2035
  • Figure 21: Western Europe Market Incremental $ Opportunity, 2025-2035
  • Figure 22: Eastern Europe Market Incremental $ Opportunity, 2025-2035
  • Figure 23: East Asia Market Incremental $ Opportunity, 2025-2035
  • Figure 24: South Asia & Pacific Market Incremental $ Opportunity, 2025-2035
  • Figure 25: Middle East and Africa Market Incremental $ Opportunity, 2025-2035
  • Figure 26: North America Market Value Share and BPS Analysis by Country, 2025 and 2035
  • Figure 27: North America Market Value Share and BPS Analysis by Product, 2025 and 2035
  • Figure 28: North America Market Y-o-Y Growth Comparison by Product, 2025-2035
  • Figure 29: North America Market Attractiveness Analysis by Product
  • Figure 30: North America Market Value Share and BPS Analysis by Service Type, 2025 and 2035
  • Figure 31: North America Market Y-o-Y Growth Comparison by Service Type, 2025-2035
  • Figure 32: North America Market Attractiveness Analysis by Service Type
  • Figure 33: North America Market Value Share and BPS Analysis by End-user, 2025 and 2035
  • Figure 34: North America Market Y-o-Y Growth Comparison by End-user, 2025-2035
  • Figure 35: North America Market Attractiveness Analysis by End-user
  • Figure 36: North America Market Value Share and BPS Analysis by Application, 2025 and 2035
  • Figure 37: North America Market Y-o-Y Growth Comparison by Application, 2025-2035
  • Figure 38: North America Market Attractiveness Analysis by Application
  • Figure 39: Latin America Market Value Share and BPS Analysis by Country, 2025 and 2035
  • Figure 40: Latin America Market Value Share and BPS Analysis by Product, 2025 and 2035
  • Figure 41: Latin America Market Y-o-Y Growth Comparison by Product, 2025-2035
  • Figure 42: Latin America Market Attractiveness Analysis by Product
  • Figure 43: Latin America Market Value Share and BPS Analysis by Service Type, 2025 and 2035
  • Figure 44: Latin America Market Y-o-Y Growth Comparison by Service Type, 2025-2035
  • Figure 45: Latin America Market Attractiveness Analysis by Service Type
  • Figure 46: Latin America Market Value Share and BPS Analysis by End-user, 2025 and 2035
  • Figure 47: Latin America Market Y-o-Y Growth Comparison by End-user, 2025-2035
  • Figure 48: Latin America Market Attractiveness Analysis by End-user
  • Figure 49: Latin America Market Value Share and BPS Analysis by Application, 2025 and 2035
  • Figure 50: Latin America Market Y-o-Y Growth Comparison by Application, 2025-2035
  • Figure 51: Latin America Market Attractiveness Analysis by Application
  • Figure 52: Western Europe Market Value Share and BPS Analysis by Country, 2025 and 2035
  • Figure 53: Western Europe Market Value Share and BPS Analysis by Product, 2025 and 2035
  • Figure 54: Western Europe Market Y-o-Y Growth Comparison by Product, 2025-2035
  • Figure 55: Western Europe Market Attractiveness Analysis by Product
  • Figure 56: Western Europe Market Value Share and BPS Analysis by Service Type, 2025 and 2035
  • Figure 57: Western Europe Market Y-o-Y Growth Comparison by Service Type, 2025-2035
  • Figure 58: Western Europe Market Attractiveness Analysis by Service Type
  • Figure 59: Western Europe Market Value Share and BPS Analysis by End-user, 2025 and 2035
  • Figure 60: Western Europe Market Y-o-Y Growth Comparison by End-user, 2025-2035
  • Figure 61: Western Europe Market Attractiveness Analysis by End-user
  • Figure 62: Western Europe Market Value Share and BPS Analysis by Application, 2025 and 2035
  • Figure 63: Western Europe Market Y-o-Y Growth Comparison by Application, 2025-2035
  • Figure 64: Western Europe Market Attractiveness Analysis by Application
  • Figure 65: Eastern Europe Market Value Share and BPS Analysis by Country, 2025 and 2035
  • Figure 66: Eastern Europe Market Value Share and BPS Analysis by Product, 2025 and 2035
  • Figure 67: Eastern Europe Market Y-o-Y Growth Comparison by Product, 2025-2035
  • Figure 68: Eastern Europe Market Attractiveness Analysis by Product
  • Figure 69: Eastern Europe Market Value Share and BPS Analysis by Service Type, 2025 and 2035
  • Figure 70: Eastern Europe Market Y-o-Y Growth Comparison by Service Type, 2025-2035
  • Figure 71: Eastern Europe Market Attractiveness Analysis by Service Type
  • Figure 72: Eastern Europe Market Value Share and BPS Analysis by End-user, 2025 and 2035
  • Figure 73: Eastern Europe Market Y-o-Y Growth Comparison by End-user, 2025-2035
  • Figure 74: Eastern Europe Market Attractiveness Analysis by End-user
  • Figure 75: Eastern Europe Market Value Share and BPS Analysis by Application, 2025 and 2035
  • Figure 76: Eastern Europe Market Y-o-Y Growth Comparison by Application, 2025-2035
  • Figure 77: Eastern Europe Market Attractiveness Analysis by Application
  • Figure 78: East Asia Market Value Share and BPS Analysis by Country, 2025 and 2035
  • Figure 79: East Asia Market Value Share and BPS Analysis by Product, 2025 and 2035
  • Figure 80: East Asia Market Y-o-Y Growth Comparison by Product, 2025-2035
  • Figure 81: East Asia Market Attractiveness Analysis by Product
  • Figure 82: East Asia Market Value Share and BPS Analysis by Service Type, 2025 and 2035
  • Figure 83: East Asia Market Y-o-Y Growth Comparison by Service Type, 2025-2035
  • Figure 84: East Asia Market Attractiveness Analysis by Service Type
  • Figure 85: East Asia Market Value Share and BPS Analysis by End-user, 2025 and 2035
  • Figure 86: East Asia Market Y-o-Y Growth Comparison by End-user, 2025-2035
  • Figure 87: East Asia Market Attractiveness Analysis by End-user
  • Figure 88: East Asia Market Value Share and BPS Analysis by Application, 2025 and 2035
  • Figure 89: East Asia Market Y-o-Y Growth Comparison by Application, 2025-2035
  • Figure 90: East Asia Market Attractiveness Analysis by Application
  • Figure 91: South Asia & Pacific Market Value Share and BPS Analysis by Country, 2025 and 2035
  • Figure 92: South Asia & Pacific Market Value Share and BPS Analysis by Product, 2025 and 2035
  • Figure 93: South Asia & Pacific Market Y-o-Y Growth Comparison by Product, 2025-2035
  • Figure 94: South Asia & Pacific Market Attractiveness Analysis by Product
  • Figure 95: South Asia & Pacific Market Value Share and BPS Analysis by Service Type, 2025 and 2035
  • Figure 96: South Asia & Pacific Market Y-o-Y Growth Comparison by Service Type, 2025-2035
  • Figure 97: South Asia & Pacific Market Attractiveness Analysis by Service Type
  • Figure 98: South Asia & Pacific Market Value Share and BPS Analysis by End-user, 2025 and 2035
  • Figure 99: South Asia & Pacific Market Y-o-Y Growth Comparison by End-user, 2025-2035
  • Figure 100: South Asia & Pacific Market Attractiveness Analysis by End-user
  • Figure 101: South Asia & Pacific Market Value Share and BPS Analysis by Application, 2025 and 2035
  • Figure 102: South Asia & Pacific Market Y-o-Y Growth Comparison by Application, 2025-2035
  • Figure 103: South Asia & Pacific Market Attractiveness Analysis by Application
  • Figure 104: Middle East and Africa Market Value Share and BPS Analysis by Country, 2025 and 2035
  • Figure 105: Middle East and Africa Market Value Share and BPS Analysis by Product, 2025 and 2035
  • Figure 106: Middle East and Africa Market Y-o-Y Growth Comparison by Product, 2025-2035
  • Figure 107: Middle East and Africa Market Attractiveness Analysis by Product
  • Figure 108: Middle East and Africa Market Value Share and BPS Analysis by Service Type, 2025 and 2035
  • Figure 109: Middle East and Africa Market Y-o-Y Growth Comparison by Service Type, 2025-2035
  • Figure 110: Middle East and Africa Market Attractiveness Analysis by Service Type
  • Figure 111: Middle East and Africa Market Value Share and BPS Analysis by End-user, 2025 and 2035
  • Figure 112: Middle East and Africa Market Y-o-Y Growth Comparison by End-user, 2025-2035
  • Figure 113: Middle East and Africa Market Attractiveness Analysis by End-user
  • Figure 114: Middle East and Africa Market Value Share and BPS Analysis by Application, 2025 and 2035
  • Figure 115: Middle East and Africa Market Y-o-Y Growth Comparison by Application, 2025-2035
  • Figure 116: Middle East and Africa Market Attractiveness Analysis by Application
  • Figure 117: Global Market - Tier Structure Analysis
  • Figure 118: Global Market - Company Share Analysis

Frequently Asked Questions

What is the estimated market size of the Pest Control Services Market in 2025?

The market is expected to be valued at USD 26 billion in 2025.

What is the projected value of the Pest Control Services Market by 2035?

The market is forecast to reach USD 53.1 billion by 2035.

What is the anticipated CAGR for the Pest Control Services Market during 2025 to 2035?

The market is projected to grow at a CAGR of 7.4% over the forecast period.

Which product segment dominates the Pest Control Services Market in 2025?

Insecticides lead the Market with a 61% market share in 2025.

Who is the leading company in the Pest Control Services Market and what is its market share?

Rollins, Inc. is the leading company in the pest control services market with a 16% share.

Explore Similar Insights

Future Market Insights

Pest Control Services Market