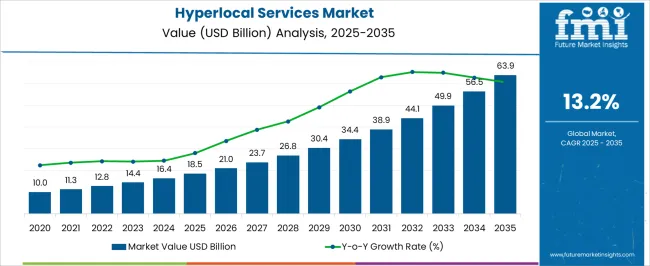
The Hyperlocal Services Market is estimated to be valued at USD 18.5 billion in 2025 and is projected to reach USD 63.9 billion by 2035, registering a compound annual growth rate (CAGR) of 13.2% over the forecast period.
The hyperlocal services market is experiencing rapid expansion driven by increasing digital adoption, widespread smartphone penetration, and growing consumer preference for convenience-based solutions. The current scenario reflects strong traction in urban areas where time-sensitive delivery and on-demand service models have become integral to daily consumption patterns. Technological advancements in mobile applications, real-time tracking, and digital payments have significantly improved operational efficiency and consumer engagement.
The future outlook indicates continued market acceleration as logistics optimization, last-mile delivery innovation, and integration of AI-based demand forecasting enhance scalability and service reliability. Growth rationale is supported by evolving consumer behavior favoring instant accessibility and localized services, coupled with strategic partnerships between service providers and small enterprises that strengthen ecosystem integration.
Expanding disposable income levels and increasing internet penetration in emerging economies are also expected to fuel adoption Collectively, these factors are positioning the hyperlocal services market for consistent growth, broader service diversification, and deeper market penetration across both developed and developing regions.

| Metric | Value |
|---|---|
| Hyperlocal Services Market Estimated Value in (2025 E) | USD 18.5 billion |
| Hyperlocal Services Market Forecast Value in (2035 F) | USD 63.9 billion |
| Forecast CAGR (2025 to 2035) | 13.2% |
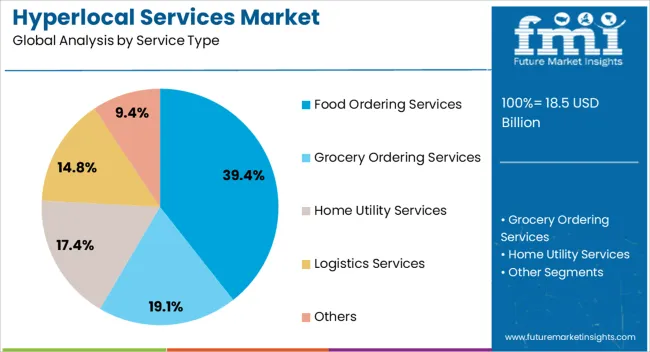
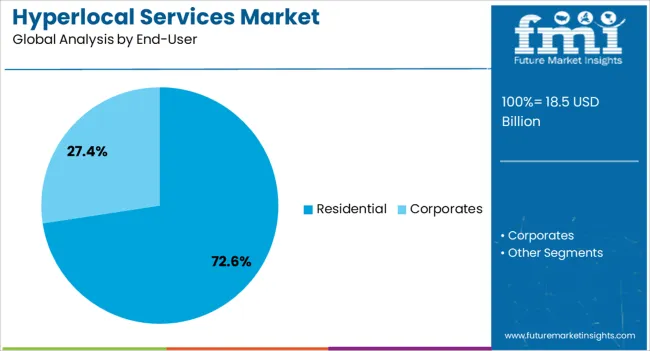
The market is segmented by Service Type and End-User and region. By Service Type, the market is divided into Food Ordering Services, Grocery Ordering Services, Home Utility Services, Logistics Services, and Others. In terms of End-User, the market is classified into Residential and Corporates. Regionally, the market is classified into North America, Latin America, Western Europe, Eastern Europe, Balkan & Baltic Countries, Russia & Belarus, Central Asia, East Asia, South Asia & Pacific, and the Middle East & Africa.

The food ordering services segment, accounting for 39.40% of the service type category, has been leading due to its deep integration within daily consumption habits and continuous expansion of restaurant aggregators and delivery platforms. Its dominance is reinforced by the convenience-driven consumer shift toward online meal ordering and the widespread availability of mobile-based applications offering personalized recommendations and discounts.
Partnerships with local restaurants and cloud kitchens have improved delivery efficiency, reducing turnaround time and enhancing user experience. Continuous improvements in order tracking, digital payment solutions, and customer engagement models have further strengthened market penetration.
Competitive pricing strategies and subscription-based loyalty programs have also contributed to sustained user retention With evolving dining preferences and increasing urban population density, the food ordering services segment is expected to maintain its leadership and drive a substantial portion of the overall hyperlocal services market growth.

The residential segment, representing 72.60% of the end-user category, has maintained its dominant position due to high adoption of home-based delivery and personal convenience services. Growth has been driven by the rising working-class population, increased digital literacy, and preference for doorstep service fulfillment.
The segment benefits from the rapid expansion of e-commerce, on-demand grocery delivery, and household utility services that cater directly to residential needs. Service providers have focused on optimizing delivery logistics, improving customer support, and enhancing app-based interfaces to ensure seamless experiences.
Subscription models and bundled offerings have increased repeat usage among households, while efficient last-mile networks have enabled faster delivery timelines With expanding urban infrastructure and increased reliance on digital convenience, the residential segment is expected to sustain its market leadership and continue contributing significantly to overall hyperlocal service adoption globally.
The hyperlocal service industry has experienced a positive trend over the past five years, with a promising historical CAGR of 10.3%, and is projected to continue growing at an impressive CAGR of 13.2% until 2035.
| Attributes | Details |
|---|---|
| Hyperlocal Services Market Historical CAGR for | 10.3% |
The global hyperlocal services market faces regulatory hurdles, supply chain disruptions, fierce competition, consumer privacy concerns, and cybersecurity threats, hindering its growth potential and posing significant challenges.
Crucial factors that are anticipated to influence the demand for hyperlocal services through 2035.
Industry participants are going to desire to be wise and flexible over the anticipated period since these difficult attributes position the industry for success in subsequent decades.
High Prevalence of Digitalization and Smartphone Usage Fuels Growth in Demand of Hyperlocal Services
The hyperlocal services market is experiencing rapid growth due to the widespread use of smartphones and advanced digital technologies. Smartphones have revolutionized consumer interactions with local businesses, allowing easy access to food delivery, grocery shopping, home services, and transportation. This convenience-driven approach aligns with modern consumers' on-demand lifestyle, rapidly expanding the demand for hyperlocal services.
Digitalization has improved consumer-business connectivity, enabling efficient communication, transactions, and feedback. Hyperlocal service providers use digital platforms to engage with customers, showcase offerings, and gather insights. Utilizing data analytics and artificial intelligence, they can personalize recommendations, optimize service delivery, and enhance customer experiences.
Digital payment solutions, such as contactless methods and mobile wallets, have transformed transactions, enhancing trust, security, and financial transparency. Smartphones and digitalization are expanding the hyperlocal services market in the coming decade.
Focus on Contactless Delivery Drives Global Demand for Hyperlocal Services
The hyperlocal services sector has moved toward contactless delivery and better sanitary practices due to the global COVID-19 epidemic.
Security health measures aim to reduce physical interactions and viral transmission risks, with delivery personnel trained to maintain social distancing and hygiene protocols, increasing demand for contactless delivery in hyperlocal services. Implementing transparent communication channels has increased the demand for hyperlocal solutions by providing customers with updates on order status and safety measures.
Hyperlocal services are gaining popularity due to innovative solutions like QR code menus, virtual consultations, and drone deliveries, enhancing safety and efficiency in various industries. Hyperlocal service providers are gaining trust and navigating challenges by prioritizing customer safety and transparency, with contactless delivery services increasing global demand for hyperlocal services.
Hyperlocal Service Industry Matures Millennial and Gen-Z Consumer base
Millennials and Gen Z consumers drive the hyperlocal services market due to their tech-savvy lifestyles and preference for convenience. Gen-Z consumers rely heavily on smartphones and digital platforms for daily activities, making hyperlocal services ideal for their on-the-go lifestyles. Millennials value authenticity, sustainability, and supporting local businesses, which aligns with their values, propelling millennial consumers' demand for hyperlocal services.
Hyperlocal services allow consumers to engage with neighborhood vendors, discover hidden gems, and contribute to their communities' economies. Platforms like Hyperlocal use data analytics and AI-driven algorithms to deliver personalized experiences and optimize service delivery; therefore, the demand for hyperlocal services is high among the consumer base of millennials and Gen-Z. This trend drives the hyperlocal services market's growth and reshapes local commerce.
This section offers in-depth analyses of particular hyperlocal services market sectors. The two main topics of the research are the segment with the food ordering services as a service type and the residential segment as end user. Through a comprehensive examination, this section attempts to provide a fuller knowledge of these segments and their relevance in the larger context of the hyperlocal service industry.
| Attributes | Details |
|---|---|
| Top Service Type | Food Ordering Services |
| Market share in 2025 | 38% |
Consumers' requirements drive the demand for food ordering. Registering a significant market share of 38% in 2025, the following drives displays the growth of the demand for food ordering services:
| Attributes | Details |
|---|---|
| Top End User | Residential |
| Market share in 2025 | 64.0% |
The high utilization of hyperlocal services in the residential consumer base, acquiring a prominent 64.0% market share in 2025. The development of demand for hyperlocal services in residential areas from the following drivers:
The United States, China, Japan, Germany, Australia, and New Zealand are some of the most predominant regions on the global stage, and this section anticipates looking at their hyperlocal service industry. A thorough investigation examines the several aspects influencing these provinces' need for, acceptance of, and interactions with hyperlocal services.
| Countries | CAGR from 2025 to 2035 |
|---|---|
| United States | 10.1% |
| Germany | 3.7% |
| Japan | 6.0% |
| China | 13.7% |
| ANZ region | 16.7% |
The United States service industry is developing the demand for hyperlocal solutions with a promising CAGR of 10.1% from 2025 to 2035. Here are a few of the major trends:
The demand for hyperlocal services in China is expected to develop at a rapid CAGR of 13.7%. The following factors are propelling the hyperlocal industry's expanding demand for technological development:
The hyperlocal service industry in Germany demands sustainability in its operation, and the demand for hyperlocal services is predicted to extend at a sluggish CAGR of 3.7% between 2025 and 2035. Some of the primary trends in the industry are:
The demand for hyperlocal services in Japan is expected to register a CAGR of 6.0% from 2025 to 2035. Some of the primary trends are:
The hyperlocal service industry in Australia and New Zealand is expected to register a staggering CAGR of 16.7% by 2035. Among the primary drivers are:
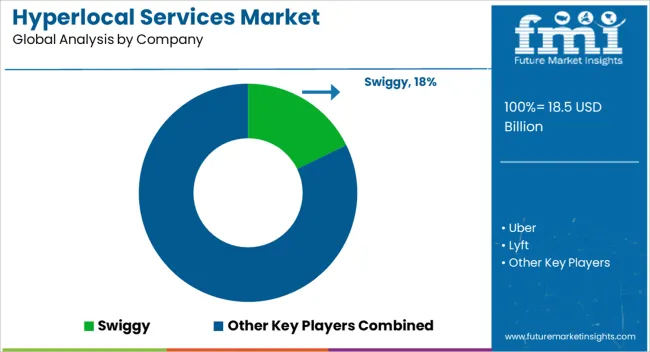
Market participants influence the global hyperlocal services industry's future through new tactics, technical breakthroughs, and strategic collaborations. These companies, which range from quick-starting startups to well-established tech behemoths, are using new consumer patterns and preferences to propel the development of hyperlocal services.
Market participants are creating innovative technologies like drone delivery services, AI-driven recommendation engines, and blockchain-based solutions to improve client experiences, streamline operations, and expand service offerings through research and development investments.
Furthermore, by forming strategic alliances with regional companies, logistics service providers, and online retailers, industry participants may broaden their customer base, enter new markets, and take advantage of economies of scale to get a competitive advantage.
In addition, industry participants are actively tackling sustainability issues by implementing eco-friendly procedures, encouraging ethical sourcing, and lowering carbon footprints to meet the increasing demand from customers for ecologically friendly products. The combined efforts of market players influence the hyperlocal services industry's direction, generating innovation and fuelling its global expansion in the forthcoming decade.
Recent Developments in the Hyperlocal Services Industry

The global hyperlocal services market is estimated to be valued at USD 18.5 billion in 2025.
The market size for the hyperlocal services market is projected to reach USD 63.9 billion by 2035.
The hyperlocal services market is expected to grow at a 13.2% CAGR between 2025 and 2035.
The key product types in hyperlocal services market are food ordering services, grocery ordering services, home utility services, logistics services and others.
In terms of end-user, residential segment to command 72.6% share in the hyperlocal services market in 2025.


Our Research Products

The "Full Research Suite" delivers actionable market intel, deep dives on markets or technologies, so clients act faster, cut risk, and unlock growth.

The Leaderboard benchmarks and ranks top vendors, classifying them as Established Leaders, Leading Challengers, or Disruptors & Challengers.

Locates where complements amplify value and substitutes erode it, forecasting net impact by horizon

We deliver granular, decision-grade intel: market sizing, 5-year forecasts, pricing, adoption, usage, revenue, and operational KPIs—plus competitor tracking, regulation, and value chains—across 60 countries broadly.

Spot the shifts before they hit your P&L. We track inflection points, adoption curves, pricing moves, and ecosystem plays to show where demand is heading, why it is changing, and what to do next across high-growth markets and disruptive tech

Real-time reads of user behavior. We track shifting priorities, perceptions of today’s and next-gen services, and provider experience, then pace how fast tech moves from trial to adoption, blending buyer, consumer, and channel inputs with social signals (#WhySwitch, #UX).

Partner with our analyst team to build a custom report designed around your business priorities. From analysing market trends to assessing competitors or crafting bespoke datasets, we tailor insights to your needs.
Supplier Intelligence
Discovery & Profiling
Capacity & Footprint
Performance & Risk
Compliance & Governance
Commercial Readiness
Who Supplies Whom
Scorecards & Shortlists
Playbooks & Docs
Category Intelligence
Definition & Scope
Demand & Use Cases
Cost Drivers
Market Structure
Supply Chain Map
Trade & Policy
Operating Norms
Deliverables
Buyer Intelligence
Account Basics
Spend & Scope
Procurement Model
Vendor Requirements
Terms & Policies
Entry Strategy
Pain Points & Triggers
Outputs
Pricing Analysis
Benchmarks
Trends
Should-Cost
Indexation
Landed Cost
Commercial Terms
Deliverables
Brand Analysis
Positioning & Value Prop
Share & Presence
Customer Evidence
Go-to-Market
Digital & Reputation
Compliance & Trust
KPIs & Gaps
Outputs
Full Research Suite comprises of:
Market outlook & trends analysis
Interviews & case studies
Strategic recommendations
Vendor profiles & capabilities analysis
5-year forecasts
8 regions and 60+ country-level data splits
Market segment data splits
12 months of continuous data updates
DELIVERED AS:
PDF EXCEL ONLINE
Hyperlocal Grocery Delivery Market Analysis by Food Type, Business Model, Purchaser Type, Delivery Type, End User, and Region Through 2035
Hyperlocal Food Delivery Market Trends - Convenience & Growth 2025 to 2035
Hyperlocal Delivery App Market Growth – Trends & Forecast 2024-2034
M2M Services Market Size and Share Forecast Outlook 2025 to 2035
B2B Services Review Platforms Market Size and Share Forecast Outlook 2025 to 2035
Bot Services Market Size and Share Forecast Outlook 2025 to 2035
Spa Services Market Size and Share Forecast Outlook 2025 to 2035
Microservices Orchestration Market Growth - Trends & Forecast 2025 to 2035
VOIP Services Market Analysis - Trends, Growth & Forecast through 2034
Global AI HR Services Market Size and Share Forecast Outlook 2025 to 2035
Legal Services Market Size and Share Forecast Outlook 2025 to 2035
Oracle Services Market Analysis – Trends & Forecast 2024-2034
Seismic Services Market Size and Share Forecast Outlook 2025 to 2035
AR Tour Services Market Analysis - Size and Share Forecast Outlook 2025 to 2035
Tableau Services Market Size and Share Forecast Outlook 2025 to 2035
Managed Services Market Analysis - Size, Share, and Forecast Outlook 2025 to 2035
Walk-in Services Market Growth – Trends & Forecast 2024-2034
The AI Legal Services Market Analysis - Size and Share Forecast Outlook 2025 to 2035
Podiatry Services Market Analysis - Size, Share, and Forecast Outlook 2025 to 2035
Catering Services Market Analysis by Service Type, Application and End User and Region Through 2035

Thank you!
You will receive an email from our Business Development Manager. Please be sure to check your SPAM/JUNK folder too.
Chat With
MaRIA