Hyperspectral Imaging for Seal Integrity Market Size and Share Forecast Outlook 2025 to 2035

The hyperspectral imaging for seal integrity market is anticipated to grow from USD 2.9 billion in 2025 to USD 6.1 billion by 2035, registering a total increase of USD 3.1 billion over the decade. This marks a 106.9% overall expansion, with the market projected to grow at a compound annual growth rate (CAGR) of 7.5%.
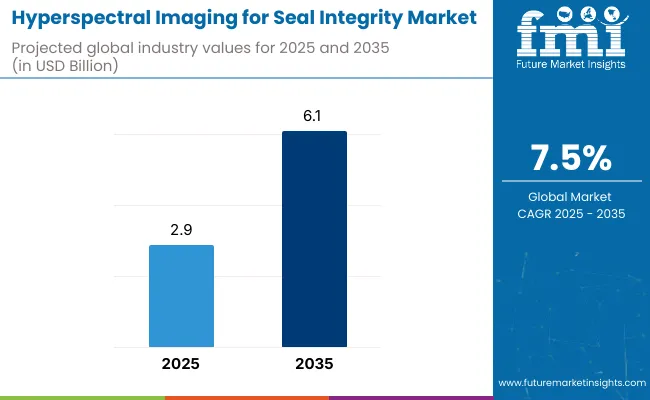
Quick Stats for Hyperspectral Imaging for Seal Integrity Market

  • Market Value (2025): USD 2.9 billion
  • Market Forecast Value (2035): USD 6.1 billion
  • Market Forecast CAGR: 7.5%
  • Leading Segment in 2025: Near Infrared (46.1%)
  • Key Growth Regions: North America (United States is the fastest-growing market with 8.4% CAGR)
  • Top Key Players: Engilico Engineering Solutions NV, Specim, Spectral Imaging Ltd, Headwall Group, Cubert GmbH, Middleton Spectral Visualization (MSV).

Hyperspectral Imaging For Seal Integrity Market

Metric Value
Industry Size (2025E) USD 2.9 billion
Industry Value (2035F) USD 6.1 billion
CAGR (2025 to 2035) 7.5%

By the end of the forecast period, the market is expected to more than double, with a 2.1 increase in size. In the first five-year period (2025-2030), the market increases from USD 2.9 billion to USD 4.1 billion, contributing USD 1.1 billion, or 35.5% of the total decade growth. Adoption is driven by the food & beverage and pharmaceutical sectors, where real-time, non-destructive inspection of flexible and rigid packaging becomes a regulatory and operational priority. Short-wave infrared (SWIR) systems dominate during this phase, supported by heightened need for high-resolution defect detection in MAP (modified atmosphere packaging) applications.

In the second half (2030-2035), the market advances from USD 4.1 billion to USD 6.1 billion, contributing USD 2.0 billion, or 64.5% of total growth. Accelerated deployment of AI-powered hyperspectral platforms, integration with inline quality control systems, and edge-processing capabilities make the technology accessible for medium-sized enterprises. Growth is further bolstered by sustainability mandates, which demand reliable seal validation in recyclable and bio-based materials, where micro-defects compromise shelf life and safety.

From 2020 to 2024, the hyperspectral imaging for seal integrity market grew from USD 2.2 billion to USD 2.7 billion, driven by hardware-centric adoption across food, pharma, and medical device packaging lines that require non-destructive, high-speed inspection systems. During this period, the competitive landscape was dominated by equipment manufacturers controlling nearly 70% of revenue, with leaders such as Engilico, Specim, Headwall Group, and Cubert GmbH focusing on hyperspectral vision systems tailored to detect seal contamination, wrinkles, and product-in-seal anomalies.

Competitive differentiation relied on wavelength precision, inspection speed, and inline automation compatibility, while AI-based analytics software was typically bundled with equipment rather than positioned as a standalone revenue stream. Service-based models including calibration support and vision system upgrades contributed less than 10% of the total market value.

Demand for hyperspectral imaging in seal inspection will expand to USD 6.1 billion in 2035, and the revenue mix will shift as AI analytics, remote diagnostics, and subscription-based software layers grow to over 40% share. Traditional hardware vendors face growing competition from machine vision startups and automation providers offering cloud-integrated platforms, edge-AI algorithms, and real-time QC dashboards.

Major imaging system providers are pivoting to hybrid models, embedding adaptive machine learning, multi-material inspection capabilities, and predictive maintenance modules to preserve market relevance. Emerging players continue to gain share by offering open-architecture systems, sustainability-linked rejection algorithms, and format-flexible deployments. The competitive advantage is moving away from hardware precision alone to intelligent inspection ecosystems, workflow scalability, and recurring software-driven revenue streams.

Why the Hyperspectral Imaging for Seal Integrity Market is growing?

Increasing demand for advanced quality assurance systems in food, pharmaceuticals, and high-value packaging applications is driving the growth of the hyperspectral imaging (HSI) for seal integrity market. Hyperspectral cameras provide non-invasive, real-time inspection of sealed packages by capturing hundreds of spectral bands, enabling the detection of defects such as leaks, incomplete seals, contamination, and delamination without damaging the product. This technology ensures compliance with stringent safety regulations and enhances consumer trust.

Short-wave infrared (SWIR) and visible-near-infrared (VNIR) imaging systems have gained popularity due to their ability to analyze materials at the molecular level and detect subtle irregularities invisible to the human eye or standard machine vision systems. These hyperspectral setups offer high accuracy, rapid inspection speeds, and are capable of integration into inline production environments with minimal disruption.

Industries such as ready-to-eat meals, modified atmosphere packaging (MAP), pharmaceuticals, and baby food are driving demand for non-destructive seal verification to reduce recalls, ensure safety, and maintain product integrity. HSI systems enhance process control, reduce packaging waste, and improve efficiency across sterile or sensitive packaging lines.

Segmental Analysis

The market is segmented by spectrum range, system type, application, industry compliance, end-use industry, and region. Spectrum range includes visible (VIS), near infrared (NIR), and short-wave infrared (SWIR), offering distinct detection capabilities for surface and subsurface seal analysis. System type segmentation comprises inline conveyor-based systems, offline bench-top units, and handheld scanners, enabling real-time, lab-based, and portable inspection flexibility. Application areas include seal defect detection, contaminant detection, and film thickness verification, supporting comprehensive quality assurance in critical packaging operations.

Industry compliance covers food safety (FSMA), pharma (GMP), and medical device packaging standards, ensuring hyperspectral systems align with regulatory mandates and audit requirements. End-use industries include food & beverage, pharmaceuticals, medical devices, and defense packaging, all of which demand high-integrity seals for safety, sterility, and shelf stability. Regionally, the market is segmented into North America, Europe, Asia-Pacific, Latin America, and the Middle East & Africa.
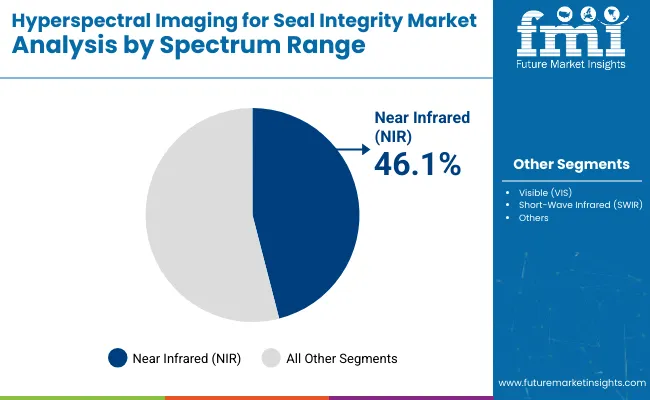
Near Infrared (NIR) Segment Leads Due to Superior Penetration and Accuracy

Hyperspectral Imaging For Seal Integrity Market By Spectrum

The near infrared (NIR) segment is projected to command the highest share of 46.1% in 2025 in the hyperspectral imaging (HSI) market for seal integrity applications. This dominance is attributed to the NIR wavelength’s ability to penetrate deeper into packaging materials and accurately detect contaminants or seal voids invisible to standard visual inspection systems. NIR’s ability to capture detailed spectral fingerprints of organic and polymeric materials makes it especially valuable in food and pharmaceutical packaging environments where micro-defects can compromise safety or shelf life.

The technology’s high sensitivity enables early defect detection, reducing product recalls and improving batch consistency. NIR sensors can operate under varying light conditions and integrate with AI-based vision systems for real-time decision-making. Regulatory bodies like the FDA and EFSA recognize NIR-based hyperspectral systems as valid compliance tools for high-risk packaging, particularly in perishables. As demand for hygienic and tamper-evident packaging intensifies, the NIR-based HSI system is expected to gain sustained market preference.
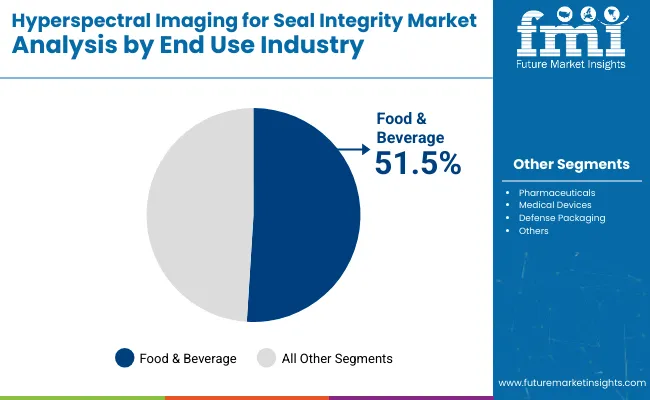
Food & Beverage Sector to Dominate End Use as Compliance Requirements Intensify

Hyperspectral Imaging For Seal Integrity Market By Enduse

The food & beverage sector is anticipated to hold the largest share of 51.5% in 2025 within the hyperspectral imaging for seal integrity market. This growth stems from rising scrutiny under the Food Safety Modernization Act (FSMA) and equivalent global standards, which require validated inspection protocols for primary and secondary packaging. Food processors are adopting hyperspectral solutions to ensure integrity in thermoformed trays, sealed pouches, and vacuum packs where oxygen or moisture ingress can rapidly degrade product quality.

From ready-to-eat meals to dairy and protein-based products, seal assurance has become a critical control point. HSI systems help detect under-seals, foreign particles, or inconsistencies caused by filling errors. Inline deployment of hyperspectral cameras enables non-contact, high-speed inspection without interrupting flow. With growing consumer demand for transparency and extended freshness, the food and beverage industry is expected to remain the largest and fastest-growing user segment for seal integrity validation technologies.
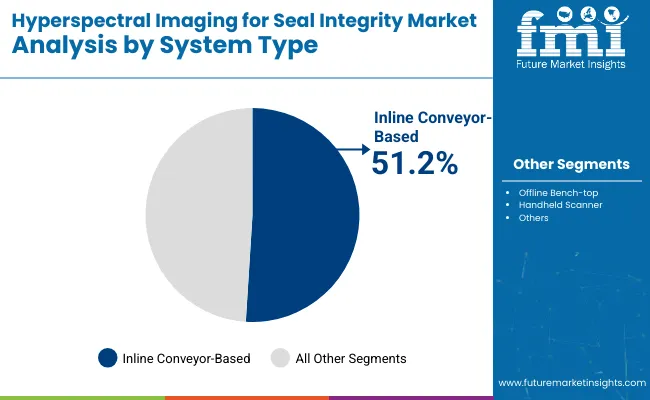
Inline Conveyor-Based Systems to Lead Integration Across High-Speed Lines

Hyperspectral Imaging For Seal Integrity Market By System

The inline conveyor-based segment is projected to lead the hyperspectral imaging market with a 51.2% share in 2025. These systems are increasingly favored by packaging facilities for their ability to conduct seamless, non-destructive inspection of seals without disrupting production speed. Installed over conveyor belts, inline HSI setups analyze spectral data in real time, flagging anomalies such as incomplete seals, air gaps, or contaminant entrapments before the next processing step.

Their integration with PLCs, robotics, and smart production dashboards supports predictive maintenance and ensures compliance with Good Manufacturing Practices (GMP). Inline systems also minimize human error associated with manual sampling. Industries like pharmaceuticals, dairy, and ready meals rely on this technology to maintain high throughput while meeting strict seal validation protocols. As Industry 4.0 adoption accelerates, inline hyperspectral solutions are expected to dominate for their real-time intelligence and automation compatibility.
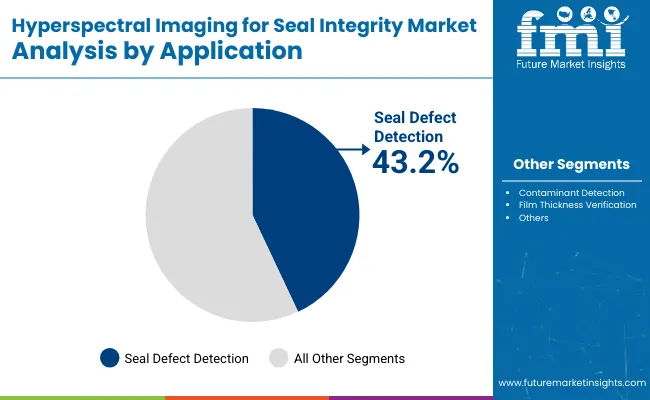
Seal Defect Detection to Remain Primary Application Focus in Quality Assurance

Hyperspectral Imaging For Seal Integrity Market By Application

Seal defect detection is projected to emerge as the leading application segment with a 43.2% share in 2025, highlighting its central role in packaging quality control. As packaging evolves to include sustainable, multilayered, or recyclable materials, ensuring seal integrity becomes more complex. Hyperspectral imaging helps overcome this challenge by identifying micro-defects like leaks, delamination, seal creases, or contamination without physically altering the package.

Advanced imaging algorithms analyze spectral deviations along the seal area, enabling the differentiation between good and faulty seals with high precision. This capability significantly reduces the rate of false rejects and improves inspection reliability. Manufacturers in both food and pharma are deploying these systems to comply with increasingly stringent regulatory norms. With growing reliance on automated packaging systems, seal defect detection via HSI is set to remain the cornerstone application, supporting product safety and brand reputation.
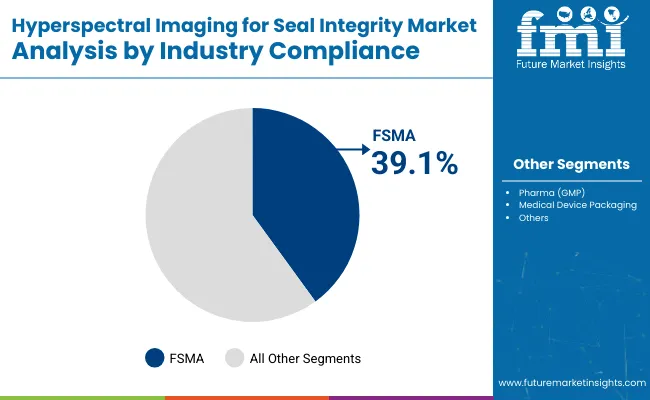
FSMA Compliance Drives Hyperspectral Adoption in Regulated Packaging

Hyperspectral Imaging For Seal Integrity Market By Industry

The FSMA compliance segment is expected to hold a 39.1% share in 2025, as hyperspectral imaging increasingly aligns with regulatory expectations for food safety. The USA Food Safety Modernization Act mandates proactive risk prevention, including the detection of packaging defects that can compromise food integrity. HSI systems equipped with FSMA-compliant validation protocols are gaining traction in facilities processing dairy, meats, and ready-to-eat meals.

These systems help demonstrate due diligence during audits by producing image logs, spectral maps, and automated reports for traceability. Their deployment reduces dependency on manual inspection while enhancing repeatability and documentation accuracy. Compliance with FSMA has now become a strong purchasing driver for hyperspectral systems, especially among USA-based and export-oriented processors. As regulators globally adopt similar standards, FSMA-compliant seal integrity technologies are likely to experience robust adoption across food and pharma value chains.

What are the Drivers, Restraints, and Key Trends of the Hyperspectral Imaging for Seal Integrity Market?

System complexity and calibration challenges limit broader implementation, even as demand rises across pharmaceuticals, food packaging, and medical devices for non-invasive, high-resolution inspection technologies that verify seal quality and detect micro-defects in real time.

Non-destructive Quality Assurance in Regulated Packaging Environments

Hyperspectral imaging (HSI) is gaining strong traction in industries such as pharmaceuticals, food & beverage, and sterile medical packaging due to its ability to detect invisible or sub-surface seal defects. Unlike traditional visual inspection or X-ray, HSI provides pixel-level chemical and structural analysis, enabling early detection of channel leaks, voids, delamination, and particulate contamination. It supports compliance with stringent quality standards such as FDA CFR 21, EU MDR, and ISO 11607 for sterile packaging validation.

In aseptic environments and vacuum-sealed product lines, hyperspectral imaging ensures 100% in-line seal integrity without damaging the packaging. As product safety becomes non-negotiable, manufacturers are increasingly integrating HSI into automated inspection frameworks for sterile barrier systems and modified atmosphere packaging (MAP).

High Capital Costs and Data Interpretation Complexity

Despite its technical superiority, adoption of hyperspectral imaging for seal inspection is hindered by high capital expenditure and system sophistication. Equipment typically involves costly cameras, tunable filters, and hyperspectral lighting setups, which require specialized calibration to match packaging substrates and product contents. The vast data output generated per inspection demands robust computing infrastructure and skilled data analysts to interpret wavelength signatures and material spectra.

False positives or interpretation errors can disrupt production or cause unnecessary product rejection. These barriers can be significant for small or medium enterprises without in-house optical engineering or machine vision expertise, limiting adoption in cost-sensitive or decentralized packaging operations.

AI-powered Defect Classification and Inline System Integration

A key trend driving the hyperspectral imaging market for seal inspection is the convergence with AI and real-time automation. Machine learning algorithms are now being trained to differentiate acceptable variability from actual defects, reducing false alarms and improving classification accuracy. HSI systems are also being miniaturized and integrated directly into packaging lines using compact sensors and real-time analytics software. These inline configurations eliminate the need for offline quality checks and enhance line efficiency without compromising resolution.

modular setups with remote calibration and adaptive lighting are supporting multi-material packaging ranging from clear films to foil laminates. As regulatory oversight strengthens and zero-defect goals intensify, hyperspectral imaging is rapidly transitioning from a lab-grade solution to an industrial packaging standard.
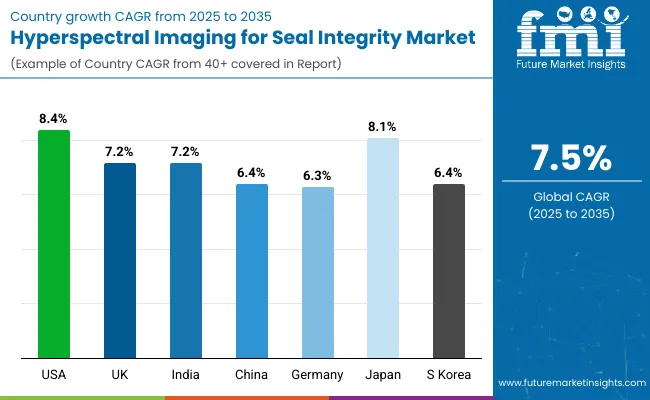
Analysis of Hyperspectral Imaging for Seal Integrity Market by Key Countries

Hyperspectral Imaging For Seal Integrity Market By Country

The global hyperspectral imaging (HSI) market for seal integrity verification is entering a high-growth phase, fueled by demand for non-destructive, real-time, and high-precision inspection in food, pharmaceuticals, and sterile medical packaging. HSI enables spectral-level analysis of seal defects, contamination, and barrier breaches that are otherwise invisible to RGB or thermal cameras.

The USA and Japan are leading adoption due to stringent quality regulations in pharma and medical device packaging. Emerging economies such as India and the UK are scaling investment in AI-powered inline inspection systems. Germany and South Korea are deploying HSI within smart factory initiatives, while China is integrating hyperspectral sensors in high-speed blister, pouch, and tray-sealing lines.

Sales Outlook for Hyperspectral Imaging in Seal Integrity United States

The hyperspectral imaging market for seal integrity in the United States is projected to grow at a CAGR of 8.4%, driven by regulatory pressure from the FDA, ASTM standards, and consumer safety mandates. USA pharmaceutical and food packaging facilities are replacing traditional vision systems with HSI-enabled cameras capable of detecting foreign particles, incomplete seals, and delamination in real-time.

  • Sterile medical packaging lines are integrating HSI for multi-layer seal defect detection.
  • Food safety initiatives are boosting adoption in vacuum-sealed, MAP, and retort pouch inspection.
  • OEMs are launching HSI-enabled systems compatible with robotic pick-and-place and rejection mechanisms.

Growth and Expansion Outlook for Hyperspectral Imaging in Seal Integrity United Kingdom

The UK hyperspectral imaging market for seal inspection is forecast to grow at a CAGR of 7.2%, driven by compliance with MHRA, FSA, and ISO packaging integrity standards. British pharma and dairy industries are deploying HSI for contamination detection and seal uniformity across high-speed FFS lines. Startups and automation integrators are introducing compact, AI-driven HSI modules tailored for SMEs.

  • Pharma blister lines are using HSI to identify micro-channel leakage and material separation.
  • Food packaging units are scanning tray lidding films for residue, wrinkles, and incomplete welds.
  • UK-based integrators are offering plug-and-play HSI retrofits for legacy optical inspection systems.

Growth and Expansion Outlook for Hyperspectral Imaging in Seal Integrity India

India’s hyperspectral imaging market for seal integrity is projected to grow at a CAGR of 7.2%, supported by expanding pharmaceutical exports, medical device production, and automation of food safety inspections. Indian firms are adopting HSI-enabled modules for real-time pouch and strip seal checks. Government compliance audits and WHO-GMP requirements for export packaging are also accelerating investment.

  • Export-focused pharma plants are installing HSI systems to validate seal uniformity across blister packs.
  • Medical nutrition and oral care brands are using HSI to detect fiber, gel, or sealant contamination.
  • Indian OEMs are collaborating with European suppliers for local integration of HSI in rotary sealing units.

Sales Outlook for Hyperspectral Imaging in Seal Integrity China

The hyperspectral imaging market in China for seal integrity is expected to grow at a CAGR of 6.4%, driven by domestic food safety campaigns, e-pharma packaging, and advanced inspection in electronics and medical devices. Chinese packaging facilities are embedding HSI sensors in pouch and tray-sealing lines for real-time validation without halting production. AI-based interpretation and multi-band visualization are enabling early detection of seal anomalies.

  • Food exporters are using HSI to inspect seal lamination and barrier layer penetration in sachets.
  • E-pharma players are deploying inline HSI for strip packs and inhaler seals.
  • Local machine vision startups are scaling AI-enhanced hyperspectral cameras for OEM adoption.

In-depth Analysis of Hyperspectral Imaging in Seal Integrity Germany

Germany’s hyperspectral imaging market for seal integrity is forecast to grow at a CAGR of 6.3%, driven by pharma-grade compliance standards, cleanroom packaging, and traceability automation. German manufacturers are using HSI not just for seal presence, but also to assess surface chemistry, contamination, and seal integrity under varying material combinations.

  • Pharma packaging lines are implementing HSI to detect seal migration and sealing voids in PET and aluminum.
  • Meat and deli packaging companies are integrating HSI for vacuum-sealed tray inspections.
  • OEMs are launching servo-synced HSI units with machine learning algorithms for adaptive seal grading.

Growth Outlook for Hyperspectral Imaging in Seal Integrity Japan

The hyperspectral imaging market for seal inspection in Japan is expected to grow at a CAGR of 8.1%, backed by advanced pharmaceutical manufacturing, robotics-integrated packaging lines, and premium hygiene standards in functional food packaging. Japanese companies are using HSI for spectral signature-based anomaly detection in laminate seals and multilayer sachets.

  • High-end nutritional packs are tested via inline HSI to ensure uniform barrier performance.
  • Pharma lines are using spectral scanning for leak detection and chemical layer assessment.
  • Japanese vision system OEMs are miniaturizing HSI sensors for portable and benchtop validation tools.

Opportunity Analysis of Hyperspectral Imaging in Seal Integrity South Korea

South Korea’s hyperspectral imaging market for seal integrity is projected to grow at a CAGR of 6.4%, driven by growth in export-ready K-food, OTC pharma, and clinical nutrition products. The focus is on integrating HSI with existing high-speed packaging lines without increasing reject rates or process time. Korean firms are embedding compact HSI heads in rotary blister and sachet sealing equipment to comply with FDA, EU, and ASEAN regulations.

  • HSI is being adopted in medical device pouches and diagnostic test kit packaging.
  • K-food tray lines are integrating multi-band vision units to detect sealing gaps and adhesive inconsistencies.
  • Korean automation providers are bundling HSI with rejection arms and cloud-based image logging.

Competitive Landscape of Hyperspectral Imaging for Seal Integrity Market

The hyperspectral imaging for seal integrity market is moderately fragmented, with optical technology leaders, packaging quality assurance innovators, and precision sensor specialists competing across food, pharmaceutical, and medical device packaging lines.

Global leaders such as Headwall Group and Specim hold significant market share, driven by their advanced hyperspectral cameras, real-time data processing capabilities, and seamless integration with high-speed packaging systems. Their strategies increasingly emphasize AI-enabled defect recognition, spectral range customization, and non-destructive seal analysis for thermoformed trays, pouches, and flow packs.

Established mid-sized players including Cubert GmbH and Engilico focus on inline and offline hyperspectral solutions tailored for seal quality inspection. These companies are enhancing adoption through robust spectral calibration, intuitive interface software, and compatibility with vacuum-formed, lidding film, and flexible packaging materials. Their systems are especially relevant for high-risk, high-value segments such as ready-to-eat meals, sterile medical goods, and pharmaceutical blister packs.

Key Development Hyperspectral Imaging in Seal Integrity

  • 2025, Engilico presents its new in‑machine HyperScope® seal inspection system at IFFA 2025.
  • June 10th, 2025, Photonics Finland has awarded Specim, Spectral Imaging Ltd the title of Photonics Finland Company of the Year 2024, recognizing the company’s outstanding contributions to the photonics industry in Finland and beyond.
  • Key Companies
  • Engilico Engineering Solutions NV
  • Specim, Spectral Imaging Ltd
  • Headwall Group
  • Cubert GmbH
  • Middleton Spectral Visualization (MSV)

Scope of the Report

Item Value
Quantitative Units USD 2.9 Billion
By Spectrum Range Visible (VIS), Near Infrared (NIR), and Short-Wave Infrared (SWIR)
By System Type Inline Conveyor-based, Offline Bench-top, and Handheld Scanner
By Application Seal Defect Detection, Contaminant Detection, and Film Thickness Verification
By Industry Compliance Food Safety (FSMA), Pharma (GMP), and Medical Device Packaging
By End-Use Industry Food & Beverage, Pharmaceuticals, Medical Devices, and Defense Packaging
Key Companies Profiled Engilico Engineering Solutions NV, Specim, Spectral Imaging Ltd, Headwall Group, Middleton Spectral Visualization (MSV), and Cubert GmbH
Additional Attributes Non-destructive and real-time seal inspection technology, increasing demand in FSMA- and GMP-compliant packaging lines, use of SWIR imaging for multilayer seal layer detection, integration of AI/ML for defect classification, growing adoption in pharmaceutical and medical device packaging, improved food safety compliance via inline conveyor-based systems, rise in deployment of handheld scanners in QA labs, advances in spectral mapping for thin film validation, enhanced quality assurance in aseptic environments, and rapid technology expansion in North America, Germany, Japan, and South Korea

Key Segmentation

By Spectrum Range:

  • Visible (VIS)
  • Near Infrared (NIR)
  • Short-Wave Infrared (SWIR)

By System Type:

  • Inline Conveyor-based
  • Offline Bench-top
  • Handheld Scanner

By Application:

  • Seal Defect Detection
  • Contaminant Detection
  • Film Thickness Verification

By Industry Compliance:

  • Food Safety (FSMA)
  • Pharma (GMP)
  • Medical Device Packaging

By End-Use Industry:

  • Food & Beverage
  • Pharmaceuticals
  • Medical Devices
  • Defense Packaging

By Region:

  • North America
  • Europe
  • Asia-Pacific
  • Latin America
  • Middle East & Africa

Table of Content

  1. Executive Summary
    • Global Market Outlook
    • Demand-side Trends
    • Supply-side Trends
    • Technology Roadmap Analysis
    • Analysis and Recommendations
  2. Market Overview
    • Market Coverage / Taxonomy
    • Market Definition / Scope / Limitations
  3. Market Background
    • Market Dynamics
      • Drivers
      • Restraints
      • Opportunity
      • Trends
    • Scenario Forecast
      • Demand in Optimistic Scenario
      • Demand in Likely Scenario
      • Demand in Conservative Scenario
    • Opportunity Map Analysis
    • Product Life Cycle Analysis
    • Supply Chain Analysis
      • Supply Side Participants and their Roles
        • Producers
        • Mid-Level Participants (Traders/ Agents/ Brokers)
        • Wholesalers and Distributors
      • Value Added and Value Created at Node in the Supply Chain
      • List of Raw Material Suppliers
      • List of Existing and Potential Buyer’s
    • Investment Feasibility Matrix
    • Value Chain Analysis
      • Profit Margin Analysis
      • Wholesalers and Distributors
      • Retailers
    • PESTLE and Porter’s Analysis
    • Regulatory Landscape
      • By Key Regions
      • By Key Countries
    • Regional Parent Market Outlook
    • Production and Consumption Statistics
    • Import and Export Statistics
  4. Global Market Analysis 2020 to 2024 and Forecast, 2025 to 2035
    • Historical Market Size Value (USD Million) & Volume (Units) Analysis, 2020 to 2024
    • Current and Future Market Size Value (USD Million) & Volume (Units) Projections, 2025 to 2035
      • Y-o-Y Growth Trend Analysis
      • Absolute $ Opportunity Analysis
  5. Global Market Pricing Analysis 2020 to 2024 and Forecast 2025 to 2035
  6. Global Market Analysis 2020 to 2024 and Forecast 2025 to 2035, By Spectrum Range
    • Introduction / Key Findings
    • Historical Market Size Value (USD Million) & Volume (Units) Analysis By Spectrum Range, 2020 to 2024
    • Current and Future Market Size Value (USD Million) & Volume (Units) Analysis and Forecast By Spectrum Range, 2025 to 2035
      • Visible (VIS)
      • Near Infrared (NIR)
      • Short-Wave Infrared (SWIR)
    • Y-o-Y Growth Trend Analysis By Spectrum Range, 2020 to 2024
    • Absolute $ Opportunity Analysis By Spectrum Range, 2025 to 2035
  7. Global Market Analysis 2020 to 2024 and Forecast 2025 to 2035, By System Type
    • Introduction / Key Findings
    • Historical Market Size Value (USD Million) & Volume (Units) Analysis By System Type, 2020 to 2024
    • Current and Future Market Size Value (USD Million) & Volume (Units) Analysis and Forecast By System Type, 2025 to 2035
      • Inline Conveyor-based
      • Offline Bench-top
      • Handheld Scanner
    • Y-o-Y Growth Trend Analysis By System Type, 2020 to 2024
    • Absolute $ Opportunity Analysis By System Type, 2025 to 2035
  8. Global Market Analysis 2020 to 2024 and Forecast 2025 to 2035, By Application
    • Introduction / Key Findings
    • Historical Market Size Value (USD Million) & Volume (Units) Analysis By Application, 2020 to 2024
    • Current and Future Market Size Value (USD Million) & Volume (Units) Analysis and Forecast By Application, 2025 to 2035
      • Seal Defect Detection
      • Contaminant Detection
      • Film Thickness Verification
    • Y-o-Y Growth Trend Analysis By Application, 2020 to 2024
    • Absolute $ Opportunity Analysis By Application, 2025 to 2035
  9. Global Market Analysis 2020 to 2024 and Forecast 2025 to 2035, By Industry Compliance
    • Introduction / Key Findings
    • Historical Market Size Value (USD Million) & Volume (Units) Analysis By Industry Compliance, 2020 to 2024
    • Current and Future Market Size Value (USD Million) & Volume (Units) Analysis and Forecast By Industry Compliance, 2025 to 2035
      • Food Safety (FSMA)
      • Pharma (GMP)
      • Medical Device Packaging
    • Y-o-Y Growth Trend Analysis By Industry Compliance, 2020 to 2024
    • Absolute $ Opportunity Analysis By Industry Compliance, 2025 to 2035
  10. Global Market Analysis 2020 to 2024 and Forecast 2025 to 2035, By End-Use Industry
    • Introduction / Key Findings
    • Historical Market Size Value (USD Million) & Volume (Units) Analysis By End-Use Industry, 2020 to 2024
    • Current and Future Market Size Value (USD Million) & Volume (Units) Analysis and Forecast By End-Use Industry, 2025 to 2035
      • Food & Beverage
      • Pharmaceuticals
      • Medical Devices
      • Defense Packaging
    • Y-o-Y Growth Trend Analysis By End-Use Industry, 2020 to 2024
    • Absolute $ Opportunity Analysis By End-Use Industry, 2025 to 2035
  11. Global Market Analysis 2020 to 2024 and Forecast 2025 to 2035, By Region
    • Introduction
    • Historical Market Size Value (USD Million) & Volume (Units) Analysis By Region, 2020 to 2024
    • Current Market Size Value (USD Million) & Volume (Units) Analysis and Forecast By Region, 2025 to 2035
      • North America
      • Latin America
      • Europe
      • East Asia
      • South Asia
      • Oceania
      • MEA
    • Market Attractiveness Analysis By Region
  12. North America Market Analysis 2020 to 2024 and Forecast 2025 to 2035, By Country
    • Historical Market Size Value (USD Million) & Volume (Units) Trend Analysis By Market Taxonomy, 2020 to 2024
    • Market Size Value (USD Million) & Volume (Units) Forecast By Market Taxonomy, 2025 to 2035
      • By Country
        • USA
        • Canada
      • By Spectrum Range
      • By System Type
      • By Application
      • By Industry Compliance
      • By End-Use Industry
    • Market Attractiveness Analysis
      • By Country
      • By Spectrum Range
      • By System Type
      • By Application
      • By Industry Compliance
      • By End-Use Industry
    • Key Takeaways
  13. Latin America Market Analysis 2020 to 2024 and Forecast 2025 to 2035, By Country
    • Historical Market Size Value (USD Million) & Volume (Units) Trend Analysis By Market Taxonomy, 2020 to 2024
    • Market Size Value (USD Million) & Volume (Units) Forecast By Market Taxonomy, 2025 to 2035
      • By Country
        • Brazil
        • Mexico
        • Argentina
        • Chile
        • Peru
        • Rest of Latin America
      • By Spectrum Range
      • By System Type
      • By Application
      • By Industry Compliance
      • By End-Use Industry
    • Market Attractiveness Analysis
      • By Country
      • By Spectrum Range
      • By System Type
      • By Application
      • By Industry Compliance
      • By End-Use Industry
    • Key Takeaways
  14. Europe Market Analysis 2020 to 2024 and Forecast 2025 to 2035, By Country
    • Historical Market Size Value (USD Million) & Volume (Units) Trend Analysis By Market Taxonomy, 2020 to 2024
    • Market Size Value (USD Million) & Volume (Units) Forecast By Market Taxonomy, 2025 to 2035
      • By Country
        • Germany
        • Italy
        • France
        • UK
        • Spain
        • Russia
        • BENELUX
        • Rest of Europe
      • By Spectrum Range
      • By System Type
      • By Application
      • By Industry Compliance
      • By End-Use Industry
    • Market Attractiveness Analysis
      • By Country
      • By Spectrum Range
      • By System Type
      • By Application
      • By Industry Compliance
      • By End-Use Industry
    • Key Takeaways
  15. East Asia Market Analysis 2020 to 2024 and Forecast 2025 to 2035, By Country
    • Historical Market Size Value (USD Million) & Volume (Units) Trend Analysis By Market Taxonomy, 2020 to 2024
    • Market Size Value (USD Million) & Volume (Units) Forecast By Market Taxonomy, 2025 to 2035
      • By Country
        • China
        • Japan
        • South Korea
      • By Spectrum Range
      • By System Type
      • By Application
      • By Industry Compliance
      • By End-Use Industry
    • Market Attractiveness Analysis
      • By Country
      • By Spectrum Range
      • By System Type
      • By Application
      • By Industry Compliance
      • By End-Use Industry
    • Key Takeaways
  16. South Asia Market Analysis 2020 to 2024 and Forecast 2025 to 2035, By Country
    • Historical Market Size Value (USD Million) & Volume (Units) Trend Analysis By Market Taxonomy, 2020 to 2024
    • Market Size Value (USD Million) & Volume (Units) Forecast By Market Taxonomy, 2025 to 2035
      • By Country
        • India
        • Thailand
        • Malaysia
        • Indonesia
        • Rest of South Asia
      • By Spectrum Range
      • By System Type
      • By Application
      • By Industry Compliance
      • By End-Use Industry
    • Market Attractiveness Analysis
      • By Country
      • By Spectrum Range
      • By System Type
      • By Application
      • By Industry Compliance
      • By End-Use Industry
    • Key Takeaways
  17. Oceania Market Analysis 2020 to 2024 and Forecast 2025 to 2035, By Country
    • Historical Market Size Value (USD Million) & Volume (Units) Trend Analysis By Market Taxonomy, 2020 to 2024
    • Market Size Value (USD Million) & Volume (Units) Forecast By Market Taxonomy, 2025 to 2035
      • By Country
        • Australia
        • New Zealand
      • By Spectrum Range
      • By System Type
      • By Application
      • By Industry Compliance
      • By End-Use Industry
    • Market Attractiveness Analysis
      • By Country
      • By Spectrum Range
      • By System Type
      • By Application
      • By Industry Compliance
      • By End-Use Industry
    • Key Takeaways
  18. MEA Market Analysis 2020 to 2024 and Forecast 2025 to 2035, By Country
    • Historical Market Size Value (USD Million) & Volume (Units) Trend Analysis By Market Taxonomy, 2020 to 2024
    • Market Size Value (USD Million) & Volume (Units) Forecast By Market Taxonomy, 2025 to 2035
      • By Country
        • GCC
        • Rest of MEA
      • By Spectrum Range
      • By System Type
      • By Application
      • By Industry Compliance
      • By End-Use Industry
    • Market Attractiveness Analysis
      • By Country
      • By Spectrum Range
      • By System Type
      • By Application
      • By Industry Compliance
      • By End-Use Industry
    • Key Takeaways
  19. Key Countries Market Analysis
    • USA
      • Pricing Analysis
      • Market Share Analysis, 2024
        • By Spectrum Range
        • By System Type
        • By Application
        • By Industry Compliance
        • By End-Use Industry
    • Canada
      • Pricing Analysis
      • Market Share Analysis, 2024
        • By Spectrum Range
        • By System Type
        • By Application
        • By Industry Compliance
        • By End-Use Industry
    • Brazil
      • Pricing Analysis
      • Market Share Analysis, 2024
        • By Spectrum Range
        • By System Type
        • By Application
        • By Industry Compliance
        • By End-Use Industry
    • Mexico
      • Pricing Analysis
      • Market Share Analysis, 2024
        • By Spectrum Range
        • By System Type
        • By Application
        • By Industry Compliance
        • By End-Use Industry
    • Argentina
      • Pricing Analysis
      • Market Share Analysis, 2024
        • By Spectrum Range
        • By System Type
        • By Application
        • By Industry Compliance
        • By End-Use Industry
  20. Market Structure Analysis
    • Competition Dashboard
    • Competition Benchmarking
    • Market Share Analysis of Top Players
      • By Regional
      • By Spectrum Range
      • By System Type
      • By Application
      • By Industry Compliance
      • By End-Use Industry
  21. Competition Analysis
    • Competition Deep Dive
      • Engilico Engineering Solutions NV
        • Overview
        • Product Portfolio
        • Profitability by Market Segments (Product/Age /Sales Channel/Region)
        • Sales Footprint
        • Strategy Overview
          • Marketing Strategy
          • Product Strategy
          • Channel Strategy
      • Specim, Spectral Imaging Ltd
        • Overview
        • Product Portfolio
        • Profitability by Market Segments (Product/Age /Sales Channel/Region)
        • Sales Footprint
        • Strategy Overview
          • Marketing Strategy
          • Product Strategy
          • Channel Strategy
      • Headwall Group
        • Overview
        • Product Portfolio
        • Profitability by Market Segments (Product/Age /Sales Channel/Region)
        • Sales Footprint
        • Strategy Overview
          • Marketing Strategy
          • Product Strategy
          • Channel Strategy
      • Middleton Spectral Visualization (MSV)
        • Overview
        • Product Portfolio
        • Profitability by Market Segments (Product/Age /Sales Channel/Region)
        • Sales Footprint
        • Strategy Overview
          • Marketing Strategy
          • Product Strategy
          • Channel Strategy
      • Cubert GmbH
        • Overview
        • Product Portfolio
        • Profitability by Market Segments (Product/Age /Sales Channel/Region)
        • Sales Footprint
        • Strategy Overview
          • Marketing Strategy
          • Product Strategy
          • Channel Strategy
  22. Assumptions & Acronyms Used
  23. Research Methodology

List of Tables

  • Table 1: Global Market Value (USD Million) Forecast by Region, 2020-2035
  • Table 2: Global Market Volume (Units) Forecast by Region, 2020-2035
  • Table 3: Global Market Value (USD Million) Forecast By Spectrum Range, 2020-2035
  • Table 4: Global Market Volume (Units) Forecast By Spectrum Range, 2020-2035
  • Table 5: Global Market Value (USD Million) Forecast By System Type, 2020-2035
  • Table 6: Global Market Volume (Units) Forecast By System Type, 2020-2035
  • Table 7: Global Market Value (USD Million) Forecast By Application, 2020-2035
  • Table 8: Global Market Volume (Units) Forecast By Application, 2020-2035
  • Table 9: Global Market Value (USD Million) Forecast By Industry Compliance, 2020-2035
  • Table 10: Global Market Volume (Units) Forecast By Industry Compliance, 2020-2035
  • Table 11: Global Market Value (USD Million) Forecast By End-Use Industry, 2020-2035
  • Table 12: Global Market Volume (Units) Forecast By End-Use Industry, 2020-2035
  • Table 13: North America Market Value (USD Million) Forecast by Country, 2020-2035
  • Table 14: North America Market Volume (Units) Forecast by Country, 2020-2035
  • Table 15: North America Market Value (USD Million) Forecast By Spectrum Range, 2020-2035
  • Table 16: North America Market Volume (Units) Forecast By Spectrum Range, 2020-2035
  • Table 17: North America Market Value (USD Million) Forecast By System Type, 2020-2035
  • Table 18: North America Market Volume (Units) Forecast By System Type, 2020-2035
  • Table 19: North America Market Value (USD Million) Forecast By Application, 2020-2035
  • Table 20: North America Market Volume (Units) Forecast By Application, 2020-2035
  • Table 21: North America Market Value (USD Million) Forecast By Industry Compliance, 2020-2035
  • Table 22: North America Market Volume (Units) Forecast By Industry Compliance, 2020-2035
  • Table 23: North America Market Value (USD Million) Forecast By End-Use Industry, 2020-2035
  • Table 24: North America Market Volume (Units) Forecast By End-Use Industry, 2020-2035
  • Table 25: Latin America Market Value (USD Million) Forecast by Country, 2020-2035
  • Table 26: Latin America Market Volume (Units) Forecast by Country, 2020-2035
  • Table 27: Latin America Market Value (USD Million) Forecast By Spectrum Range, 2020-2035
  • Table 28: Latin America Market Volume (Units) Forecast By Spectrum Range, 2020-2035
  • Table 29: Latin America Market Value (USD Million) Forecast By System Type, 2020-2035
  • Table 30: Latin America Market Volume (Units) Forecast By System Type, 2020-2035
  • Table 31: Latin America Market Value (USD Million) Forecast By Application, 2020-2035
  • Table 32: Latin America Market Volume (Units) Forecast By Application, 2020-2035
  • Table 33: Latin America Market Value (USD Million) Forecast By Industry Compliance, 2020-2035
  • Table 34: Latin America Market Volume (Units) Forecast By Industry Compliance, 2020-2035
  • Table 35: Latin America Market Value (USD Million) Forecast By End-Use Industry, 2020-2035
  • Table 36: Latin America Market Volume (Units) Forecast By End-Use Industry, 2020-2035
  • Table 37: Europe Market Value (USD Million) Forecast by Country, 2020-2035
  • Table 38: Europe Market Volume (Units) Forecast by Country, 2020-2035
  • Table 39: Europe Market Value (USD Million) Forecast By Spectrum Range, 2020-2035
  • Table 40: Europe Market Volume (Units) Forecast By Spectrum Range, 2020-2035
  • Table 41: Europe Market Value (USD Million) Forecast By System Type, 2020-2035
  • Table 42: Europe Market Volume (Units) Forecast By System Type, 2020-2035
  • Table 43: Europe Market Value (USD Million) Forecast By Application, 2020-2035
  • Table 44: Europe Market Volume (Units) Forecast By Application, 2020-2035
  • Table 45: Europe Market Value (USD Million) Forecast By Industry Compliance, 2020-2035
  • Table 46: Europe Market Volume (Units) Forecast By Industry Compliance, 2020-2035
  • Table 47: Europe Market Value (USD Million) Forecast By End-Use Industry, 2020-2035
  • Table 48: Europe Market Volume (Units) Forecast By End-Use Industry, 2020-2035
  • Table 49: East Asia Market Value (USD Million) Forecast by Country, 2020-2035
  • Table 50: East Asia Market Volume (Units) Forecast by Country, 2020-2035
  • Table 51: East Asia Market Value (USD Million) Forecast By Spectrum Range, 2020-2035
  • Table 52: East Asia Market Volume (Units) Forecast By Spectrum Range, 2020-2035
  • Table 53: East Asia Market Value (USD Million) Forecast By System Type, 2020-2035
  • Table 54: East Asia Market Volume (Units) Forecast By System Type, 2020-2035
  • Table 55: East Asia Market Value (USD Million) Forecast By Application, 2020-2035
  • Table 56: East Asia Market Volume (Units) Forecast By Application, 2020-2035
  • Table 57: East Asia Market Value (USD Million) Forecast By Industry Compliance, 2020-2035
  • Table 58: East Asia Market Volume (Units) Forecast By Industry Compliance, 2020-2035
  • Table 59: East Asia Market Value (USD Million) Forecast By End-Use Industry, 2020-2035
  • Table 60: East Asia Market Volume (Units) Forecast By End-Use Industry, 2020-2035
  • Table 61: South Asia Market Value (USD Million) Forecast by Country, 2020-2035
  • Table 62: South Asia Market Volume (Units) Forecast by Country, 2020-2035
  • Table 63: South Asia Market Value (USD Million) Forecast By Spectrum Range, 2020-2035
  • Table 64: South Asia Market Volume (Units) Forecast By Spectrum Range, 2020-2035
  • Table 65: South Asia Market Value (USD Million) Forecast By System Type, 2020-2035
  • Table 66: South Asia Market Volume (Units) Forecast By System Type, 2020-2035
  • Table 67: South Asia Market Value (USD Million) Forecast By Application, 2020-2035
  • Table 68: South Asia Market Volume (Units) Forecast By Application, 2020-2035
  • Table 69: South Asia Market Value (USD Million) Forecast By Industry Compliance, 2020-2035
  • Table 70: South Asia Market Volume (Units) Forecast By Industry Compliance, 2020-2035
  • Table 71: South Asia Market Value (USD Million) Forecast By End-Use Industry, 2020-2035
  • Table 72: South Asia Market Volume (Units) Forecast By End-Use Industry, 2020-2035
  • Table 73: Oceania Market Value (USD Million) Forecast by Country, 2020-2035
  • Table 74: Oceania Market Volume (Units) Forecast by Country, 2020-2035
  • Table 75: Oceania Market Value (USD Million) Forecast By Spectrum Range, 2020-2035
  • Table 76: Oceania Market Volume (Units) Forecast By Spectrum Range, 2020-2035
  • Table 77: Oceania Market Value (USD Million) Forecast By System Type, 2020-2035
  • Table 78: Oceania Market Volume (Units) Forecast By System Type, 2020-2035
  • Table 79: Oceania Market Value (USD Million) Forecast By Application, 2020-2035
  • Table 80: Oceania Market Volume (Units) Forecast By Application, 2020-2035
  • Table 81: Oceania Market Value (USD Million) Forecast By Industry Compliance, 2020-2035
  • Table 82: Oceania Market Volume (Units) Forecast By Industry Compliance, 2020-2035
  • Table 83: Oceania Market Value (USD Million) Forecast By End-Use Industry, 2020-2035
  • Table 84: Oceania Market Volume (Units) Forecast By End-Use Industry, 2020-2035
  • Table 85: MEA Market Value (USD Million) Forecast by Country, 2020-2035
  • Table 86: MEA Market Volume (Units) Forecast by Country, 2020-2035
  • Table 87: MEA Market Value (USD Million) Forecast By Spectrum Range, 2020-2035
  • Table 88: MEA Market Volume (Units) Forecast By Spectrum Range, 2020-2035
  • Table 89: MEA Market Value (USD Million) Forecast By System Type, 2020-2035
  • Table 90: MEA Market Volume (Units) Forecast By System Type, 2020-2035
  • Table 91: MEA Market Value (USD Million) Forecast By Application, 2020-2035
  • Table 92: MEA Market Volume (Units) Forecast By Application, 2020-2035
  • Table 93: MEA Market Value (USD Million) Forecast By Industry Compliance, 2020-2035
  • Table 94: MEA Market Volume (Units) Forecast By Industry Compliance, 2020-2035
  • Table 95: MEA Market Value (USD Million) Forecast By End-Use Industry, 2020-2035
  • Table 96: MEA Market Volume (Units) Forecast By End-Use Industry, 2020-2035

List of Figures

  • Figure 1: Global Market Volume (Units) Forecast 2020-2035
  • Figure 2: Global Market Pricing Analysis
  • Figure 3: Global Market Value (USD Million) Forecast 2020-2035
  • Figure 4: Global Market Value Share and BPS Analysis By Spectrum Range, 2025 and 2035
  • Figure 5: Global Market Y-o-Y Growth Comparison By Spectrum Range, 2025-2035
  • Figure 6: Global Market Attractiveness Analysis By Spectrum Range
  • Figure 7: Global Market Value Share and BPS Analysis By System Type, 2025 and 2035
  • Figure 8: Global Market Y-o-Y Growth Comparison By System Type, 2025-2035
  • Figure 9: Global Market Attractiveness Analysis By System Type
  • Figure 10: Global Market Value Share and BPS Analysis By Application, 2025 and 2035
  • Figure 11: Global Market Y-o-Y Growth Comparison By Application, 2025-2035
  • Figure 12: Global Market Attractiveness Analysis By Application
  • Figure 13: Global Market Value Share and BPS Analysis By Industry Compliance, 2025 and 2035
  • Figure 14: Global Market Y-o-Y Growth Comparison By Industry Compliance, 2025-2035
  • Figure 15: Global Market Attractiveness Analysis By Industry Compliance
  • Figure 16: Global Market Value Share and BPS Analysis By End-Use Industry, 2025 and 2035
  • Figure 17: Global Market Y-o-Y Growth Comparison By End-Use Industry, 2025-2035
  • Figure 18: Global Market Attractiveness Analysis By End-Use Industry
  • Figure 19: Global Market Value (USD Million) Share and BPS Analysis by Region, 2025 and 2035
  • Figure 20: Global Market Y-o-Y Growth Comparison by Region, 2025-2035
  • Figure 21: Global Market Attractiveness Analysis by Region
  • Figure 22: North America Market Incremental $ Opportunity, 2025-2035
  • Figure 23: Latin America Market Incremental $ Opportunity, 2025-2035
  • Figure 24: Europe Market Incremental $ Opportunity, 2025-2035
  • Figure 25: East Asia Market Incremental $ Opportunity, 2025-2035
  • Figure 26: South Asia Market Incremental $ Opportunity, 2025-2035
  • Figure 27: Oceania Market Incremental $ Opportunity, 2025-2035
  • Figure 28: MEA Market Incremental $ Opportunity, 2025-2035
  • Figure 29: North America Market Value Share and BPS Analysis by Country, 2025 and 2035
  • Figure 30: North America Market Value Share and BPS Analysis By Spectrum Range, 2025 and 2035
  • Figure 31: North America Market Y-o-Y Growth Comparison By Spectrum Range, 2025-2035
  • Figure 32: North America Market Attractiveness Analysis By Spectrum Range
  • Figure 33: North America Market Value Share and BPS Analysis By System Type, 2025 and 2035
  • Figure 34: North America Market Y-o-Y Growth Comparison By System Type, 2025-2035
  • Figure 35: North America Market Attractiveness Analysis By System Type
  • Figure 36: North America Market Value Share and BPS Analysis By Application, 2025 and 2035
  • Figure 37: North America Market Y-o-Y Growth Comparison By Application, 2025-2035
  • Figure 38: North America Market Attractiveness Analysis By Application
  • Figure 39: North America Market Value Share and BPS Analysis By Industry Compliance, 2025 and 2035
  • Figure 40: North America Market Y-o-Y Growth Comparison By Industry Compliance, 2025-2035
  • Figure 41: North America Market Attractiveness Analysis By Industry Compliance
  • Figure 42: North America Market Value Share and BPS Analysis By End-Use Industry, 2025 and 2035
  • Figure 43: North America Market Y-o-Y Growth Comparison By End-Use Industry, 2025-2035
  • Figure 44: North America Market Attractiveness Analysis By End-Use Industry
  • Figure 45: Latin America Market Value Share and BPS Analysis by Country, 2025 and 2035
  • Figure 46: Latin America Market Value Share and BPS Analysis By Spectrum Range, 2025 and 2035
  • Figure 47: Latin America Market Y-o-Y Growth Comparison By Spectrum Range, 2025-2035
  • Figure 48: Latin America Market Attractiveness Analysis By Spectrum Range
  • Figure 49: Latin America Market Value Share and BPS Analysis By System Type, 2025 and 2035
  • Figure 50: Latin America Market Y-o-Y Growth Comparison By System Type, 2025-2035
  • Figure 51: Latin America Market Attractiveness Analysis By System Type
  • Figure 52: Latin America Market Value Share and BPS Analysis By Application, 2025 and 2035
  • Figure 53: Latin America Market Y-o-Y Growth Comparison By Application, 2025-2035
  • Figure 54: Latin America Market Attractiveness Analysis By Application
  • Figure 55: Latin America Market Value Share and BPS Analysis By Industry Compliance, 2025 and 2035
  • Figure 56: Latin America Market Y-o-Y Growth Comparison By Industry Compliance, 2025-2035
  • Figure 57: Latin America Market Attractiveness Analysis By Industry Compliance
  • Figure 58: Latin America Market Value Share and BPS Analysis By End-Use Industry, 2025 and 2035
  • Figure 59: Latin America Market Y-o-Y Growth Comparison By End-Use Industry, 2025-2035
  • Figure 60: Latin America Market Attractiveness Analysis By End-Use Industry
  • Figure 61: Europe Market Value Share and BPS Analysis by Country, 2025 and 2035
  • Figure 62: Europe Market Value Share and BPS Analysis By Spectrum Range, 2025 and 2035
  • Figure 63: Europe Market Y-o-Y Growth Comparison By Spectrum Range, 2025-2035
  • Figure 64: Europe Market Attractiveness Analysis By Spectrum Range
  • Figure 65: Europe Market Value Share and BPS Analysis By System Type, 2025 and 2035
  • Figure 66: Europe Market Y-o-Y Growth Comparison By System Type, 2025-2035
  • Figure 67: Europe Market Attractiveness Analysis By System Type
  • Figure 68: Europe Market Value Share and BPS Analysis By Application, 2025 and 2035
  • Figure 69: Europe Market Y-o-Y Growth Comparison By Application, 2025-2035
  • Figure 70: Europe Market Attractiveness Analysis By Application
  • Figure 71: Europe Market Value Share and BPS Analysis By Industry Compliance, 2025 and 2035
  • Figure 72: Europe Market Y-o-Y Growth Comparison By Industry Compliance, 2025-2035
  • Figure 73: Europe Market Attractiveness Analysis By Industry Compliance
  • Figure 74: Europe Market Value Share and BPS Analysis By End-Use Industry, 2025 and 2035
  • Figure 75: Europe Market Y-o-Y Growth Comparison By End-Use Industry, 2025-2035
  • Figure 76: Europe Market Attractiveness Analysis By End-Use Industry
  • Figure 77: East Asia Market Value Share and BPS Analysis by Country, 2025 and 2035
  • Figure 78: East Asia Market Value Share and BPS Analysis By Spectrum Range, 2025 and 2035
  • Figure 79: East Asia Market Y-o-Y Growth Comparison By Spectrum Range, 2025-2035
  • Figure 80: East Asia Market Attractiveness Analysis By Spectrum Range
  • Figure 81: East Asia Market Value Share and BPS Analysis By System Type, 2025 and 2035
  • Figure 82: East Asia Market Y-o-Y Growth Comparison By System Type, 2025-2035
  • Figure 83: East Asia Market Attractiveness Analysis By System Type
  • Figure 84: East Asia Market Value Share and BPS Analysis By Application, 2025 and 2035
  • Figure 85: East Asia Market Y-o-Y Growth Comparison By Application, 2025-2035
  • Figure 86: East Asia Market Attractiveness Analysis By Application
  • Figure 87: East Asia Market Value Share and BPS Analysis By Industry Compliance, 2025 and 2035
  • Figure 88: East Asia Market Y-o-Y Growth Comparison By Industry Compliance, 2025-2035
  • Figure 89: East Asia Market Attractiveness Analysis By Industry Compliance
  • Figure 90: East Asia Market Value Share and BPS Analysis By End-Use Industry, 2025 and 2035
  • Figure 91: East Asia Market Y-o-Y Growth Comparison By End-Use Industry, 2025-2035
  • Figure 92: East Asia Market Attractiveness Analysis By End-Use Industry
  • Figure 93: South Asia Market Value Share and BPS Analysis by Country, 2025 and 2035
  • Figure 94: South Asia Market Value Share and BPS Analysis By Spectrum Range, 2025 and 2035
  • Figure 95: South Asia Market Y-o-Y Growth Comparison By Spectrum Range, 2025-2035
  • Figure 96: South Asia Market Attractiveness Analysis By Spectrum Range
  • Figure 97: South Asia Market Value Share and BPS Analysis By System Type, 2025 and 2035
  • Figure 98: South Asia Market Y-o-Y Growth Comparison By System Type, 2025-2035
  • Figure 99: South Asia Market Attractiveness Analysis By System Type
  • Figure 100: South Asia Market Value Share and BPS Analysis By Application, 2025 and 2035
  • Figure 101: South Asia Market Y-o-Y Growth Comparison By Application, 2025-2035
  • Figure 102: South Asia Market Attractiveness Analysis By Application
  • Figure 103: South Asia Market Value Share and BPS Analysis By Industry Compliance, 2025 and 2035
  • Figure 104: South Asia Market Y-o-Y Growth Comparison By Industry Compliance, 2025-2035
  • Figure 105: South Asia Market Attractiveness Analysis By Industry Compliance
  • Figure 106: South Asia Market Value Share and BPS Analysis By End-Use Industry, 2025 and 2035
  • Figure 107: South Asia Market Y-o-Y Growth Comparison By End-Use Industry, 2025-2035
  • Figure 108: South Asia Market Attractiveness Analysis By End-Use Industry
  • Figure 109: Oceania Market Value Share and BPS Analysis by Country, 2025 and 2035
  • Figure 110: Oceania Market Value Share and BPS Analysis By Spectrum Range, 2025 and 2035
  • Figure 111: Oceania Market Y-o-Y Growth Comparison By Spectrum Range, 2025-2035
  • Figure 112: Oceania Market Attractiveness Analysis By Spectrum Range
  • Figure 113: Oceania Market Value Share and BPS Analysis By System Type, 2025 and 2035
  • Figure 114: Oceania Market Y-o-Y Growth Comparison By System Type, 2025-2035
  • Figure 115: Oceania Market Attractiveness Analysis By System Type
  • Figure 116: Oceania Market Value Share and BPS Analysis By Application, 2025 and 2035
  • Figure 117: Oceania Market Y-o-Y Growth Comparison By Application, 2025-2035
  • Figure 118: Oceania Market Attractiveness Analysis By Application
  • Figure 119: Oceania Market Value Share and BPS Analysis By Industry Compliance, 2025 and 2035
  • Figure 120: Oceania Market Y-o-Y Growth Comparison By Industry Compliance, 2025-2035
  • Figure 121: Oceania Market Attractiveness Analysis By Industry Compliance
  • Figure 122: Oceania Market Value Share and BPS Analysis By End-Use Industry, 2025 and 2035
  • Figure 123: Oceania Market Y-o-Y Growth Comparison By End-Use Industry, 2025-2035
  • Figure 124: Oceania Market Attractiveness Analysis By End-Use Industry
  • Figure 125: MEA Market Value Share and BPS Analysis by Country, 2025 and 2035
  • Figure 126: MEA Market Value Share and BPS Analysis By Spectrum Range, 2025 and 2035
  • Figure 127: MEA Market Y-o-Y Growth Comparison By Spectrum Range, 2025-2035
  • Figure 128: MEA Market Attractiveness Analysis By Spectrum Range
  • Figure 129: MEA Market Value Share and BPS Analysis By System Type, 2025 and 2035
  • Figure 130: MEA Market Y-o-Y Growth Comparison By System Type, 2025-2035
  • Figure 131: MEA Market Attractiveness Analysis By System Type
  • Figure 132: MEA Market Value Share and BPS Analysis By Application, 2025 and 2035
  • Figure 133: MEA Market Y-o-Y Growth Comparison By Application, 2025-2035
  • Figure 134: MEA Market Attractiveness Analysis By Application
  • Figure 135: MEA Market Value Share and BPS Analysis By Industry Compliance, 2025 and 2035
  • Figure 136: MEA Market Y-o-Y Growth Comparison By Industry Compliance, 2025-2035
  • Figure 137: MEA Market Attractiveness Analysis By Industry Compliance
  • Figure 138: MEA Market Value Share and BPS Analysis By End-Use Industry, 2025 and 2035
  • Figure 139: MEA Market Y-o-Y Growth Comparison By End-Use Industry, 2025-2035
  • Figure 140: MEA Market Attractiveness Analysis By End-Use Industry
  • Figure 141: Global Market - Tier Structure Analysis
  • Figure 142: Global Market - Company Share Analysis

Frequently Asked Questions

How big is the hyperspectral imaging for seal integrity market in 2025?

The global hyperspectral imaging for seal integrity market is estimated to be valued at USD 2.9 billion in 2025

What will be the size of the hyperspectral imaging for seal integrity market in 2035?

The market size for the hyperspectral imaging for seal integrity market is projected to reach USD 6.1 billion by 2035.

How much will be the hyperspectral imaging for seal integrity market growth between 2025 and 2035?

The hyperspectral imaging for seal integrity market is expected to grow at a CAGR of 7.5% between 2025 and 2035.

What are the key spectral technology types in the hyperspectral imaging for seal integrity market?

The key spectral technology types in this market include near infrared (NIR), short-wave infrared (SWIR), visible spectrum (VIS), and extended IR imaging systems.

Which spectral segment is expected to contribute significant share in the hyperspectral imaging for seal integrity market in 2025?

In terms of spectral technology, the near infrared (NIR) segment is expected to account for the highest share of 46.1% in the hyperspectral imaging for seal integrity market in 2025.

Explore Similar Insights

Future Market Insights

Hyperspectral Imaging for Seal Integrity Market