The global olive oil market is projected to grow from USD 14.6 billion in 2025 to USD 19.7 billion by 2035, registering a CAGR of 2.9%.
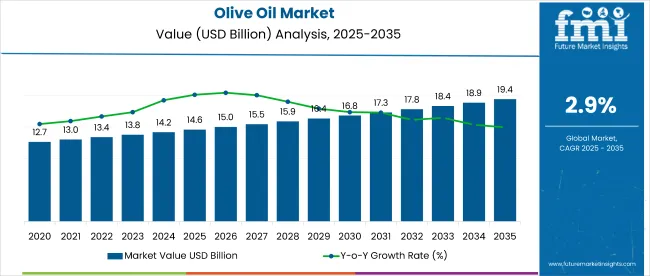
The market expansion is being driven by increasing consumer preference for healthy and nutrient-rich oils, rising awareness about associated health benefits, and growing demand from the food, pharmaceutical, and cosmetics industries. Increasing adoption in cooking, dietary supplements, and personal care products is further contributing to broader market growth.
The market holds a significant position within its parent categories but varies in share across them. Within the edible vegetable oils market, this product accounts for approximately 8-10% of total sales due to competition from more affordable alternatives like soybean and canola oils. In the specialty oils segment, its share is notably higher, ranging from 30-35%, reflecting premium positioning and health-driven appeal.
For natural and organic variants, the share stands around 25-28%, driven by rising demand for clean-label and organic offerings. In the healthy cooking oils segment, this category dominates with a share exceeding 40%, supported by increasing global health consciousness.
Government regulations impacting the market focus on food safety, product labeling, and quality standards. Frameworks such as the European Union’s PDO (Protected Designation of Origin) certifications, FDA guidelines in the United States, and Codex Alimentarius standards ensure authenticity, safety, and consistent quality. These regulatory measures promote higher manufacturing standards, reduce product adulteration, and enhance traceability, ultimately strengthening consumer trust and accelerating market adoption.
Japan is projected to be the fastest-growing market, expected to expand at a CAGR of 3.5% from 2025 to 2035. Household/retail will lead the end use segment with a 48% share, while hypermarkets/supermarkets will dominate the distribution channel with a 50% share in 2025. The USA, Germany, France, and the UK markets are also expected to grow steadily at CAGRs of 3.2%, 3.3%, 2.9%, and 3%, respectively.
The market is segmented by product, end use, distribution channel, and region. By product, the market is divided into refined, extra virgin, virgin, and olive pomace oil. In terms of end use, the market is classified into household/retail, foodservice/HoReCa, food manufacturing, and others (pharmaceuticals, cosmetics, animal feed, and personal care).
By distribution channel, the market is segmented into hypermarkets/supermarkets, convenience stores, specialty stores, and online retailing. Regionally, the market is classified into North America, Latin America, Europe, Asia Pacific, and the Middle East & Africa (MEA).
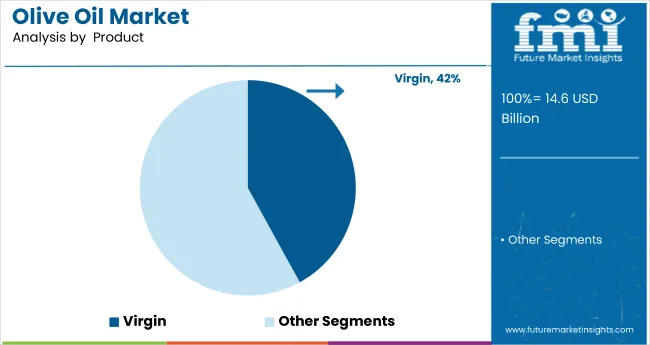
Extra virgin is expected to dominate the product segment by 2025, capturing a 42% market share. Its superior quality, rich flavor, and well-recognized health benefits are driving strong consumer preference globally.
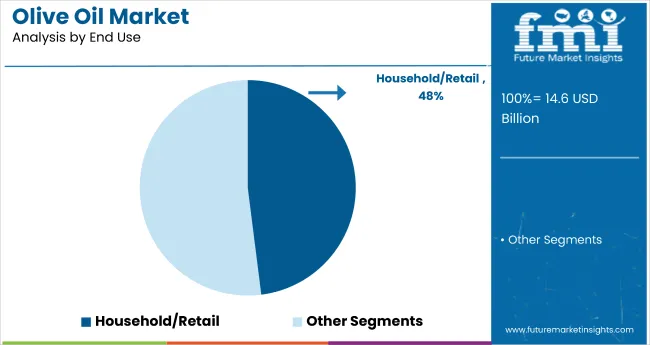
The household/retail is projected to lead the end use segment by 2025, holding about 48% of the global market share, driven by increasing consumer demand for healthy cooking oils and rising awareness of olive oil’s benefits.
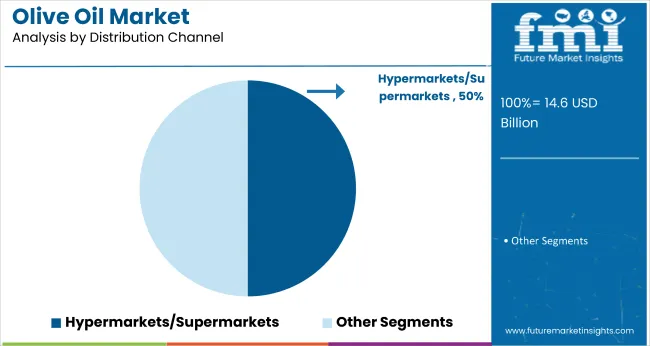
Hypermarkets and supermarkets are expected to dominate the distribution channel segment by 2025, capturing around 50% of the market share. This dominance is attributed to wide product availability, competitive pricing, and the convenience they offer to consumers.
The global olive oil market is experiencing steady growth, driven by increasing consumer awareness of health benefits and demand for premium, nutrient-rich cooking oils. Olive oil plays a vital role in promoting heart health and is widely used in culinary, pharmaceutical, and cosmetic applications.
Recent Trends in the Olive Oil Market
Challenges in the Olive Oil Market
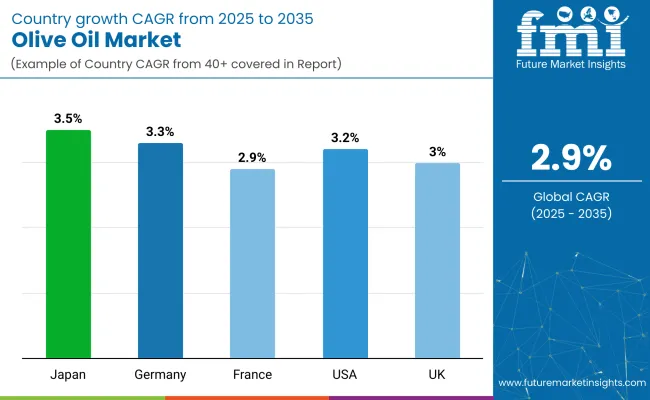
Japan momentum is driven by rising health consciousness, increasing adoption of Mediterranean diets, and government initiatives promoting natural and organic food products. Germany and France maintain steady demand driven by EU regulations supporting organic farming and sustainable agriculture. In contrast, developed economies such as the USA (3.2% CAGR), UK (3%), and Japan (3.5%) are expected to expand at a steady 1.03 to 1.20 times the global growth rate.
Japan leads the market growth, driven by strong demand for premium and organic products, as well as innovation in cosmetics and nutraceuticals. The USA follows with significant expansion due to increasing health awareness, product variety, and premiumization.
The UK and Germany show steady growth supported by rising consumer interest in Mediterranean diets, sustainability, and product certifications. France’s market growth closely tracks the global average, fueled by culinary traditions and government support for organic farming. Overall, Japan and the USA are the fastest-growing markets, while Germany, the UK, and France maintain consistent, stable demand.
The report covers an in-depth analysis of 40+ countries; five top-performing OECD countries are highlighted below.
The Japan olive oil revenue is growing at a CAGR of 3.5% from 2025 to 2035. Growth is driven by rising health awareness, increasing use of healthy oils in cooking and personal care, and growing demand for premium and organic products. Japan prioritizes high-quality, authentic plant-based oils and has a growing market for oil-based cosmetics and nutraceuticals, especially those derived from Mediterranean sources such as olive.
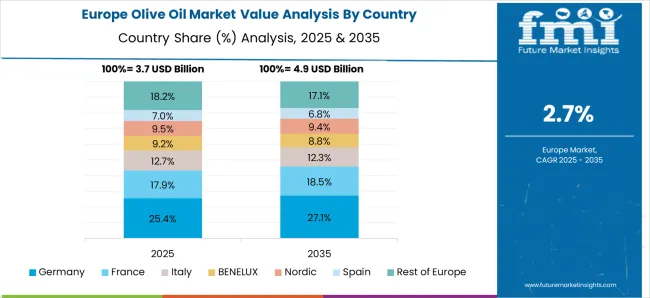
Olive oil sales in Germany are expected to expand at a CAGR of 3.3% during the forecast period, slightly above the global average. EU organic farming regulations and consumer interest in sustainable products are key growth drivers. Popular applications include cooking, foodservice, and personal care.
The French olive oil market is projected to grow at a 2.9% CAGR during the forecast period, closely tracking the global average. Demand is driven by French culinary traditions, organic food consumption, and government support for sustainable agriculture. Key sectors include foodservice, retail, and cosmetics.
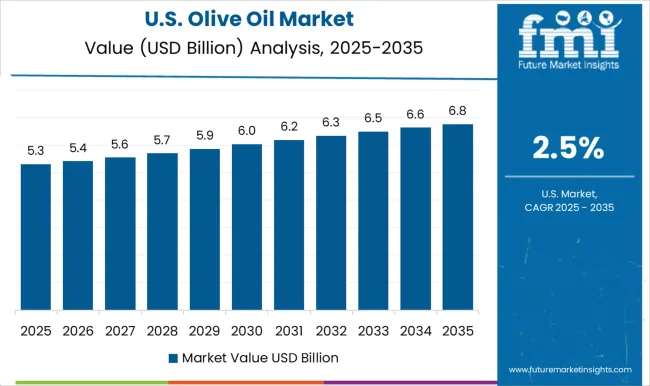
The USA olive oil market is projected to grow at a 3.2% CAGR during the forecast period, exceeding the global average by 1.10 times. Growth is supported by increasing consumer interest in health and wellness, expanding product variety, and rising adoption in foodservice and retail channels.
The UK olive oil revenue is projected to witness steady growth at a CAGR of 3% from 2025 to 2035, slightly exceeding the global average. Growth is supported by increasing health awareness, interest in Mediterranean cuisine, and expanding retail and online channels. The market favors extra virgin olive oil and specialty blends. Brexit-related trade adjustments have caused cautious investment but demand remains steady across retail and foodservice sectors.
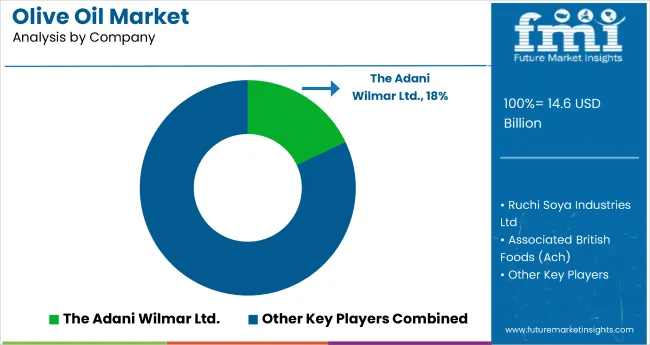
The market is moderately consolidated, with leading players like Adani Wilmar Ltd., Ruchi Soya Industries Ltd., Associated British Foods (Ach), Del Monte Foods, and Cargill dominating the industry. These companies offer a wide range of high-quality olive oil products catering to household, foodservice, and industrial consumers. Adani Wilmar Ltd. focuses on premium product offerings and wide distribution networks, while Ruchi Soya Industries Ltd. emphasizes organic and health-oriented oils.
Associated British Foods delivers branded olive oils with a strong retail presence. Del Monte Foods is known for its diversified product portfolio, and Cargill provides bulk and specialty oils. Other key players like Tucan Company, EU, Victorian Olive Groves, Archer Daniels Midland Company, and Grampians Olive contribute by supplying specialty and value-added olive oil products globally.
Recent Olive Oil Industry News
In November 2024, Grampians Olive Co.’s 2024 organic EVOOs earned top accolades at the Australian Golden Olive and International Olive Awards, including Best in Class and multiple medals, showcasing outstanding flavor and quality despite a challenging, low-yield harvest season.
| Report Attributes | Details |
|---|---|
| Market Size (2025) | USD 14.6 billion |
| Projected Market Size (2035) | USD 19.7 billion |
| CAGR (2025 to 2035) | 2.9% |
| Base Year for Estimation | 2024 |
| Historical Period | 2020 to 2024 |
| Projections Period | 2025 to 2035 |
| Report Parameter | USD billion for value/volume in metric tons |
| Product Type Analyzed | Refined, Extra Virgin, Virgin, and Olive Pomace Oil |
| End Use Analyzed | Household/Retail, Foodservice/HoReCa, Food Manufacturing, and Others (Pharmaceuticals, Cosmetics, Animal Feed, and Personal Care) |
| Distribution Channel Analyzed | Hypermarkets/Supermarkets, Convenience Stores, Specialty Stores, and Online Retailing |
| Regions Covered | North America, Latin America, Western Europe, South Asia, East Asia, Eastern Europe, Middle East & Africa |
| Countries Covered | United States, United Kingdom, Germany, France, Japan, China, India, Brazil, South Korea, Australia |
| Key Players Influencing the Market | The Adani Wilmar Ltd., Ruchi Soya Industries Ltd, Associated British Foods (Ach), Del Monte Foods, Cargill, Tucan Company, EU, Victorian Olive Groves, Archer Daniels Midland Company, and GRAMPIANS OLIVE |
| Additional Attributes | Volume sales by product type, market share by distribution channel, consumer trend impact, regulatory overview, competitive benchmarking |
The global olive oil market is estimated to be valued at USD 14.6 billion in 2025.
The market size for the olive oil market is projected to reach USD 19.4 billion by 2035.
The olive oil market is expected to grow at a 2.9% CAGR between 2025 and 2035.
The key product types in olive oil market are refined, extra virgin, virgin and olive pomace oil.
In terms of end user, household/retail segment to command 52.3% share in the olive oil market in 2025.


Our Research Products

The "Full Research Suite" delivers actionable market intel, deep dives on markets or technologies, so clients act faster, cut risk, and unlock growth.

The Leaderboard benchmarks and ranks top vendors, classifying them as Established Leaders, Leading Challengers, or Disruptors & Challengers.

Locates where complements amplify value and substitutes erode it, forecasting net impact by horizon

We deliver granular, decision-grade intel: market sizing, 5-year forecasts, pricing, adoption, usage, revenue, and operational KPIs—plus competitor tracking, regulation, and value chains—across 60 countries broadly.

Spot the shifts before they hit your P&L. We track inflection points, adoption curves, pricing moves, and ecosystem plays to show where demand is heading, why it is changing, and what to do next across high-growth markets and disruptive tech

Real-time reads of user behavior. We track shifting priorities, perceptions of today’s and next-gen services, and provider experience, then pace how fast tech moves from trial to adoption, blending buyer, consumer, and channel inputs with social signals (#WhySwitch, #UX).

Partner with our analyst team to build a custom report designed around your business priorities. From analysing market trends to assessing competitors or crafting bespoke datasets, we tailor insights to your needs.
Supplier Intelligence
Discovery & Profiling
Capacity & Footprint
Performance & Risk
Compliance & Governance
Commercial Readiness
Who Supplies Whom
Scorecards & Shortlists
Playbooks & Docs
Category Intelligence
Definition & Scope
Demand & Use Cases
Cost Drivers
Market Structure
Supply Chain Map
Trade & Policy
Operating Norms
Deliverables
Buyer Intelligence
Account Basics
Spend & Scope
Procurement Model
Vendor Requirements
Terms & Policies
Entry Strategy
Pain Points & Triggers
Outputs
Pricing Analysis
Benchmarks
Trends
Should-Cost
Indexation
Landed Cost
Commercial Terms
Deliverables
Brand Analysis
Positioning & Value Prop
Share & Presence
Customer Evidence
Go-to-Market
Digital & Reputation
Compliance & Trust
KPIs & Gaps
Outputs
Full Research Suite comprises of:
Market outlook & trends analysis
Interviews & case studies
Strategic recommendations
Vendor profiles & capabilities analysis
5-year forecasts
8 regions and 60+ country-level data splits
Market segment data splits
12 months of continuous data updates
DELIVERED AS:
PDF EXCEL ONLINE
Oily Waste Can Market Size and Share Forecast Outlook 2025 to 2035
Oil and Gas Seal Market Size and Share Forecast Outlook 2025 to 2035
Oil Coalescing Filter Market Size and Share Forecast Outlook 2025 to 2035
Oil-immersed Iron Core Series Reactor Market Size and Share Forecast Outlook 2025 to 2035
Oil and Gas Sensor Market Forecast Outlook 2025 to 2035
Oil Packing Machine Market Forecast and Outlook 2025 to 2035
Oil and Gas Pipeline Coating Market Forecast and Outlook 2025 to 2035
Oilfield Scale Inhibitor Market Size and Share Forecast Outlook 2025 to 2035
Oil-in-Water Anionic Emulsifier Market Size and Share Forecast Outlook 2025 to 2035
Oil and Gas Field Services Market Size and Share Forecast Outlook 2025 to 2035
Olive Market Size and Share Forecast Outlook 2025 to 2035
Oil Control Shampoo Market Size and Share Forecast Outlook 2025 to 2035
Oil Expellers Market Size and Share Forecast Outlook 2025 to 2035
Oilfield Stimulation Chemicals Market Size and Share Forecast Outlook 2025 to 2035
Oiler Kits Market Size and Share Forecast Outlook 2025 to 2035
Oil Pressure Sensor Market Size and Share Forecast Outlook 2025 to 2035
Oil Filled Power Transformer Market Size and Share Forecast Outlook 2025 to 2035
Oily Skin Control Products Market Analysis - Size and Share Forecast Outlook 2025 to 2035
Oil Immersed Shunt Reactor Market Size and Share Forecast Outlook 2025 to 2035
Oil Country Tubular Goods Market Size and Share Forecast Outlook 2025 to 2035

Thank you!
You will receive an email from our Business Development Manager. Please be sure to check your SPAM/JUNK folder too.
Chat With
MaRIA