Industrial RO Skids Market Size and Share Forecast Outlook 2025 to 2035

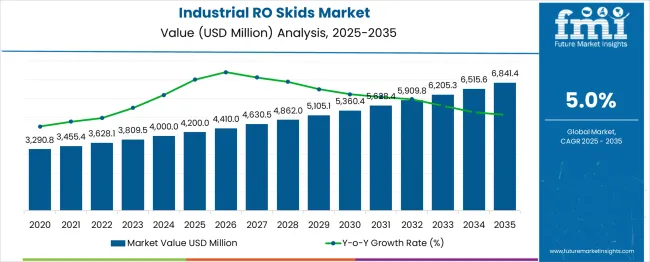
The global industrial RO skids market is projected to grow from USD 4,200.0 million in 2025 to approximately USD 6,841.3 million by 2035, recording an absolute increase of USD 2,641.3 million over the forecast period. This translates into a total growth of 62.9%, with the market forecast to expand at a compound annual growth rate (CAGR) of 5.0% between 2025 and 2035. The overall market size is expected to grow by nearly 1.63X during the same period, supported by the rising demand for water treatment solutions and increasing industrial water purification requirements across diverse manufacturing sectors.
Quick Stats for Industrial RO Skids Market

  • Industrial RO Skids Market Value (2025): USD 4,200.0 million
  • Industrial RO Skids Market Forecast Value (2035): USD 6,841.3 million
  • Industrial RO Skids Market Forecast CAGR: 5.0%
  • Leading Capacity Segment in Industrial RO Skids Market: 51-200 m³/h (46.0%)
  • Key Growth Regions in Industrial RO Skids Market: North America, Asia Pacific, and Europe
  • Key Players in Industrial RO Skids Market: Aquatech International, Fluence Corporation, H2O Innovation, IDE Technologies, Kovalus Separation (ex-Koch Membrane), Kurita America, Pentair, Toray Membrane, Veolia Water Technologies & Solutions, Xylem (Evoqua)

Industrial Ro Skids Market Market Value Analysis

Between 2025 and 2030, the industrial RO skids market is projected to expand from USD 4,200.0 million to USD 5,360.4 million, resulting in a value increase of USD 1,160.4 million, which represents 43.9% of the total forecast growth for the decade. This phase of growth will be shaped by rising demand for clean water in industrial processes, increasing regulatory requirements for water treatment, and growing awareness among manufacturers about the importance of sustainable water management. Service providers and manufacturers are expanding their production capabilities to address the growing complexity of modern industrial water treatment systems.

From 2030 to 2035, the market is forecast to grow from USD 5,360.4 million to USD 6,841.3 million, adding another USD 1,480.9 million, which constitutes 56.1% of the overall ten-year expansion. This period is expected to be characterized by expansion of modular containerized solutions, integration of advanced membrane technologies, and development of standardized treatment protocols across different industrial applications. The growing adoption of water recycling and reuse systems will drive demand for more sophisticated RO skid solutions and specialized technical expertise.

Industrial RO Skids Market Key Takeaways

Metric Value
Estimated Value in (2025E) USD 4,200.0 million
Forecast Value in (2035F) USD 6,841.3 million
Forecast CAGR (2025 to 2035) 5.0%

Between 2020 and 2025, the industrial RO skids market experienced steady expansion, driven by increasing industrial water treatment requirements and growing awareness of water scarcity issues. The market developed as manufacturing facilities recognized the need for specialized equipment to meet stringent water quality standards. Environmental regulations and sustainability initiatives began emphasizing proper water treatment procedures to maintain compliance and reduce environmental impact.

Why the Industrial RO Skids Market is Growing?

Market expansion is being supported by the rapid increase in industrial water treatment requirements worldwide and the corresponding need for efficient, reliable reverse osmosis solutions. Modern industrial facilities rely on high-quality treated water for various processes including manufacturing, cooling, and cleaning applications. Even minor variations in water quality can significantly impact production efficiency and product quality standards.

The growing complexity of water treatment regulations and increasing environmental compliance requirements are driving demand for professional RO skid solutions from certified manufacturers with appropriate technology and expertise. Regulatory agencies are increasingly requiring comprehensive water treatment documentation to maintain operational permits and ensure environmental compliance. Industry standards and manufacturer specifications are establishing standardized treatment procedures that require specialized equipment and trained operators.

Segmental Analysis

The market is segmented by capacity, configuration, feedwater type, end-use sector, and region. By capacity, the market is divided into ≤50 m³/h, 51-200 m³/h, and >200 m³/h segments. Based on configuration, the market is categorized into skid-mounted standard, modular containerized, and mobile/trailer-mounted systems. In terms of feedwater type, the market is segmented into well/surface water, recycle/reuse (effluent/process), seawater (SWRO), and others. By end-use sector, the market spans food & beverage processing, chemicals & petrochemicals, power generation & utilities, water & wastewater utilities, metals & mining, pulp & paper, automotive & transportation, electronics & semiconductors, oil & gas, and construction & building services. Regionally, the market is divided into North America, Europe, Asia Pacific, Latin America, and Middle East & Africa.

By Capacity, 51-200 m³/h Segment Accounts for 46% Market Share

The 51-200 m³/h capacity segment is projected to account for 46% of the industrial RO skids market in 2025, underscoring its role as the most widely adopted capacity range. Medium-capacity RO systems are ideally suited for manufacturing facilities, chemical processing plants, and utilities that require dependable water treatment without the high operating costs of large-scale units. These systems provide a balance between efficiency, flexibility, and affordability, making them attractive to industries with varied but substantial water demands.

Their modularity allows for scalable deployment, accommodating growth or changes in process requirements. The segment benefits from well-established manufacturing practices, broad supplier availability, and standardization of components, which simplifies both procurement and maintenance. As industries face increasing pressure to optimize resource efficiency while maintaining compliance with water quality standards, the 51-200 m³/h range will continue to serve as the backbone of industrial RO skid adoption.
By Configuration, Skid-Mounted Standard Segment Accounts for 55% Market Share

Industrial Ro Skids Market Analysis By Configuration

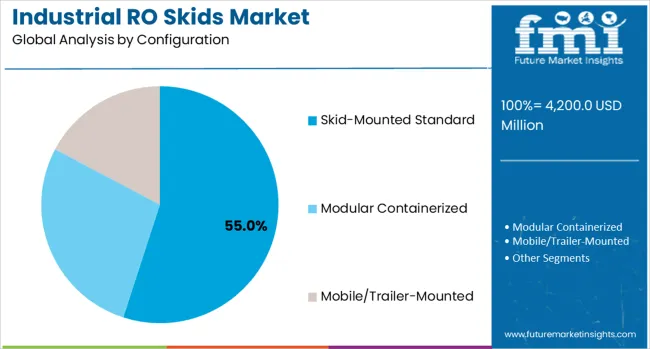
Skid-mounted standard configurations are expected to represent 55% of industrial RO skid demand in 2025, highlighting their leadership in industrial water treatment. These systems are pre-engineered and factory-tested, ensuring reliability and reducing commissioning times once deployed on-site. Standard skid systems are particularly valued for their cost-effectiveness, as economies of scale lower both production and procurement costs. Their compact, integrated design simplifies installation and provides consistent performance for a wide variety of industrial applications, including boiler feedwater treatment, process water preparation, and utility operations.

With industries increasingly prioritizing fast deployment and minimal downtime, skid-mounted standard systems offer significant operational advantages over custom-built units. Suppliers also continue to innovate within this category, offering advanced automation, remote monitoring, and energy-efficient membranes as standard features. This combination of reliability, affordability, and convenience ensures that skid-mounted standard configurations maintain their dominant market position.
By Feedwater Type, Recycle/Reuse Segment Accounts for 40% Market Share

Industrial Ro Skids Market Analysis By Feedwater Type

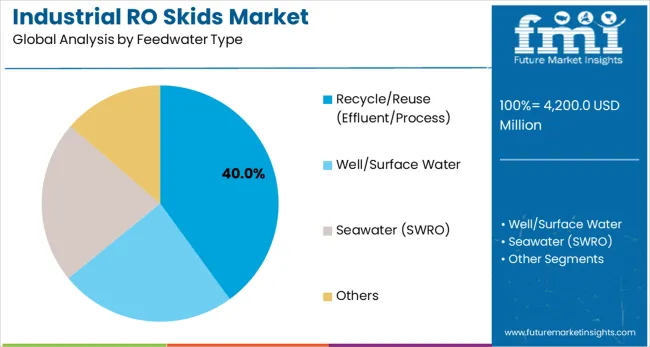
The recycle/reuse feedwater segment is projected to contribute 40% of the industrial RO skids market in 2025, reflecting the growing importance of water conservation in industrial operations. These systems treat wastewater streams, process effluents, and secondary sources to enable reuse, reducing dependence on freshwater intake and lowering discharge costs. Adoption is strongly driven by tightening environmental regulations, sustainability commitments, and the financial benefits of minimizing water sourcing expenses.

Industrial sectors such as textiles, power generation, and petrochemicals increasingly prioritize circular water strategies, where RO skids play a critical role in maintaining consistent quality for reuse applications. Advances in membrane technology, fouling resistance, and energy recovery devices have further improved the cost-effectiveness of recycle/reuse solutions. As water scarcity intensifies globally, industries are investing in these systems not only for compliance but also as a strategic approach to operational resilience.
By End-Use Sector, Food & Beverage Processing Segment Accounts for 14% Market Share

Industrial Ro Skids Market Analysis By End Use Sector

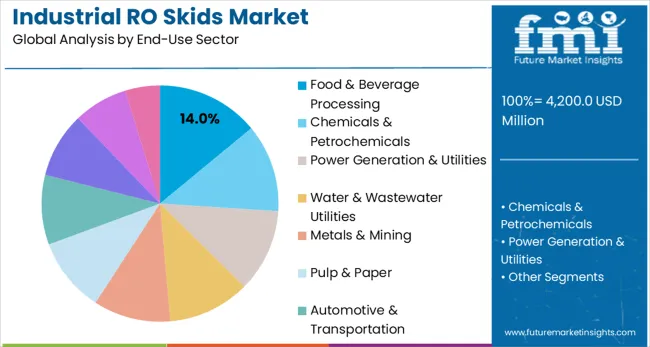
The food and beverage processing sector is estimated to hold 14% of the industrial RO skids market in 2025, making it the largest single end-use segment despite its relatively modest percentage share. This industry requires consistent supplies of high-quality treated water for manufacturing, cleaning, sanitation, and ingredient processing. Stringent hygiene standards and regulatory frameworks demand RO systems that can reliably remove contaminants while ensuring compliance with international food safety guidelines.

The segment benefits from the growing global demand for packaged foods, beverages, and dairy products, which amplifies investment in advanced water treatment systems. RO skids are particularly valued for their ability to deliver purified water at scale while maintaining flexibility across multiple production lines. With consumer and regulatory expectations rising, food and beverage processors remain steady drivers of demand for reliable, compliant, and efficient RO skid systems.

What are the Drivers, Restraints, and Key Trends of the Industrial RO Skids Market?

The industrial RO skids market is advancing steadily due to increasing water treatment requirements and growing recognition of water scarcity issues. However, the market faces challenges including high capital costs, need for regular membrane replacement and maintenance, and varying water quality requirements across different industrial applications. Technological innovation and standardization efforts continue to influence system performance and market development patterns.

Expansion of Modular and Mobile Treatment Solutions

The growing deployment of modular containerized and mobile RO systems is enabling flexible water treatment capabilities at remote locations, temporary sites, and facilities with varying capacity requirements. Mobile units equipped with trailer-mounted systems provide rapid deployment and operational flexibility for emergency situations and temporary applications. These solutions are particularly valuable for construction projects, mining operations, and disaster response scenarios that require immediate water treatment capabilities.

Integration of Advanced Membrane and Automation Technologies

Modern RO skid manufacturers are incorporating advanced membrane technologies and automated control systems that improve treatment efficiency and reduce operational complexity. Integration of smart sensors, remote monitoring capabilities, and predictive maintenance systems enables optimized system performance and reduced downtime. Advanced membrane materials also support treatment of challenging water sources including high-salinity and contaminated feedwater streams.
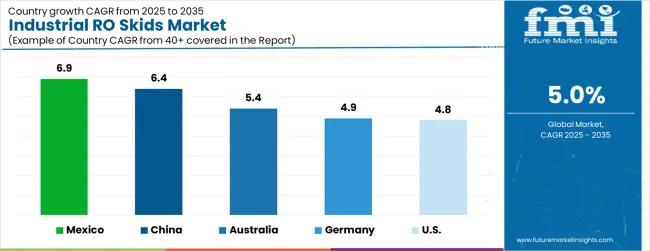
Analysis of Industrial RO Skids Market by Key Country

Industrial Ro Skids Market Cagr Analysis By Country

Country CAGR
Mexico 6.9%
China 6.4%
Australia 5.4%
Germany 4.95
USA 4.8%

The industrial RO skids market is growing rapidly, with Mexico leading at a 6.9% CAGR through 2035, driven by expanding manufacturing sector, water scarcity concerns, and increasing industrial water treatment regulations. China follows at 6.4%, supported by massive industrial growth, environmental compliance requirements, and government initiatives for water conservation. Australia grows steadily at 5.4%, addressing water scarcity challenges and expanding mining operations. Germany records 4.9%, emphasizing advanced manufacturing and environmental sustainability. The USA shows steady growth at 4.8%, focusing on infrastructure modernization and regulatory compliance. Overall, Mexico and China emerge as the leading drivers of global industrial RO skids market expansion.

The report covers an in-depth analysis of 40+ countries; five top-performing countries are highlighted below.

Mexico Leads Regional Market Growth with Industrial Expansion

Revenue from Industrial RO Skids in Mexico is projected to exhibit the highest growth rate with a CAGR of 6.9% through 2035, driven by rapid industrial development and increasing water treatment requirements in manufacturing sectors. The country's expanding automotive, electronics, and chemical industries are creating significant demand for high-quality treated water. Major manufacturing facilities are implementing comprehensive water treatment systems to support production operations and meet environmental compliance requirements.

  • Government water conservation initiatives are mandating efficient water treatment and reuse systems, driving demand for advanced RO skid solutions throughout industrial facilities.
  • Industrial development programs are supporting establishment of manufacturing hubs that require sophisticated water treatment infrastructure and specialized RO systems for diverse applications.

China Demonstrates Strong Market Potential with Industrial Modernization

Revenue from Industrial RO Skids in China is expanding at a CAGR of 6.4%, supported by massive industrial growth and increasing environmental compliance requirements. The country's manufacturing sector modernization and water scarcity concerns are driving demand for efficient water treatment solutions. Industrial facilities across electronics, chemicals, and textiles sectors are implementing advanced RO systems to meet production requirements and regulatory standards.

  • Environmental protection policies are requiring comprehensive water treatment and recycling systems, creating opportunities for RO skid manufacturers serving diverse industrial applications.
  • Industrial water management initiatives are promoting adoption of advanced treatment technologies that support sustainable manufacturing and reduced environmental impact.

Australia Maintains Strong Growth with Mining and Manufacturing Demand

Revenue from Industrial RO Skids in Australia is growing at a CAGR of 5.4%, driven by expanding mining operations and increasing water treatment requirements in remote locations. The country's mining sector and water scarcity challenges are creating demand for mobile and containerized RO systems. Industrial facilities are implementing advanced water treatment solutions to address challenging water sources and environmental constraints.

  • Mining sector expansion is driving demand for specialized RO systems capable of treating high-salinity groundwater and process effluents in remote operational environments.
  • Water conservation programs are encouraging adoption of water recycling and reuse technologies that support sustainable industrial operations and regulatory compliance.

Germany Focuses on Advanced Manufacturing and Environmental Compliance

Demand for Industrial RO Skids in Germany is projected to grow at a CAGR of 4.9%, supported by the country's emphasis on advanced manufacturing and environmental sustainability. German industrial facilities are implementing sophisticated water treatment systems that meet stringent environmental standards and support high-precision manufacturing processes. The market is characterized by focus on technological innovation, energy efficiency, and compliance with comprehensive environmental regulations.

  • Manufacturing industry investments are prioritizing advanced water treatment technologies that demonstrate superior efficiency and environmental performance while meeting German industrial standards.
  • Environmental compliance programs are ensuring comprehensive water management systems among industrial facilities, enabling sustainable operations that support diverse manufacturing requirements.

United States Emphasizes Infrastructure Modernization and Regulatory Compliance

Demand for Industrial RO Skids in the USA is expanding at a CAGR of 4.8%, driven by infrastructure modernization and increasing regulatory requirements for water treatment. Industrial facilities across diverse sectors are upgrading water treatment systems to meet environmental standards and improve operational efficiency. The market benefits from established manufacturing infrastructure and comprehensive regulatory framework supporting water quality compliance.
  • Industrial facility modernization is enabling adoption of advanced RO systems that improve water quality, reduce operational costs, and enhance environmental compliance across manufacturing sectors.
  • Regulatory compliance programs are driving consistent demand for reliable water treatment solutions that meet federal and state environmental standards and support sustainable industrial operations.

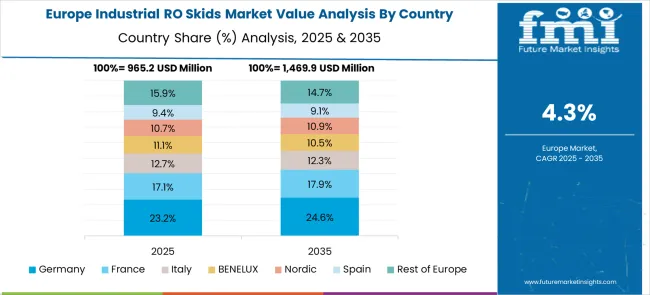
Europe Market Split by Country

Industrial Ro Skids Market Europe Country Market Share Analysis, 2025 & 2035

The European industrial RO skids market demonstrates sophisticated development across major economies with Germany leading through its advanced manufacturing capabilities and strong industrial water treatment sector, supported by companies like Veolia Water Technologies & Solutions and Pentair pioneering innovative membrane technologies for diverse industrial applications. The UK and France show significant growth in food processing and chemical industries, where stringent water quality standards drive demand for advanced RO systems. German companies leverage their engineering expertise to develop comprehensive treatment solutions, while international players like Aquatech International and Xylem (Evoqua) establish strong European presence.

Italy and Spain exhibit expanding adoption in automotive and power generation sectors, driven by environmental regulations and sustainable manufacturing initiatives. Nordic countries emphasize energy-efficient solutions and environmental compliance, while Eastern European markets show growing interest in upgrading industrial water infrastructure. The market benefits from strict EU environmental regulations, Industry 4.0 adoption, and the region's leadership in precision manufacturing, positioning Europe as a key innovation center for next-generation industrial RO skid solutions across multiple water treatment applications.
Competitive Landscape of Industrial RO Skids Market

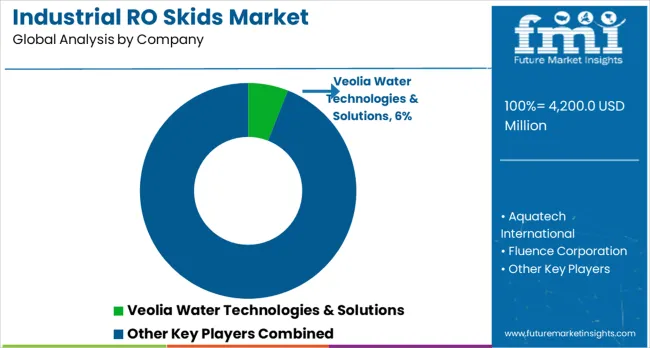
Industrial Ro Skids Market Analysis By Company

The industrial RO skids market is defined by competition among specialized equipment manufacturers, water treatment companies, and engineering firms. Companies are investing in advanced membrane technologies, modular system designs, automation capabilities, and comprehensive service support to deliver efficient, reliable, and cost-effective water treatment solutions. Strategic partnerships, technological innovation, and geographic expansion are central to strengthening product portfolios and market presence.

ABRA/Driven Brands operates globally, providing comprehensive Industrial RO Skids with focus on reliability, efficiency, and technical support. Aquatech International, USA-based, offers advanced water treatment solutions with emphasis on custom engineering and process optimization. Fluence Corporation, operating globally, provides modular and containerized RO systems for diverse industrial applications. H2O Innovation, Canada, delivers innovative water treatment technologies with focus on sustainability and operational efficiency.

IDE Technologies, Israel, emphasizes advanced desalination and water treatment solutions with proven track record in challenging applications. Kovalus Separation (ex-Koch Membrane), USA, offers comprehensive membrane technologies and system integration capabilities. Kurita America, Japan/USA, provides sophisticated water treatment solutions with emphasis on chemical and industrial applications. Pentair, USA, delivers comprehensive water treatment systems with focus on reliability and service support.

Toray Membrane, Japan, offers advanced membrane technologies and system solutions for industrial water treatment applications. Veolia Water Technologies & Solutions, France/Global, provides comprehensive water treatment services and technology solutions worldwide. Xylem (Evoqua), USA, delivers advanced water treatment systems with focus on automation and digital integration capabilities.

Key Players in the Industrial RO Skids Market

  • Aquatech International
  • Fluence Corporation
  • H2O Innovation
  • IDE Technologies
  • Kovalus Separation (ex-Koch Membrane)
  • Kurita America
  • Pentair
  • Toray Membrane
  • Veolia Water Technologies & Solutions
  • Xylem (Evoqua)

Scope of the Report

Items Values
Quantitative Units (2025) USD 4,200.0 million
Capacity Segments ≤50 m³/h, 51-200 m³/h, >200 m³/h
Configuration Skid-Mounted Standard, Modular Containerized, Mobile/Trailer-Mounted
Feedwater Type Well/Surface Water, Recycle/Reuse, Seawater, Others
End-Use Sectors Food & Beverage, Chemicals, Power Generation, Water Utilities, Mining, Pulp & Paper, Automotive, Electronics, Oil & Gas, Construction
Regions Covered North America, Europe, Asia Pacific, Latin America, Middle East & Africa
Countries Covered United States, Canada, Mexico, Germany, United Kingdom, France, China, Japan, South Korea, India, Australia, Brazil and 40+ countries
Key Companies Profiled Aquatech International, Fluence Corporation, H2O Innovation, IDE Technologies, Kovalus Separation, Kurita America, Pentair, Toray Membrane, Veolia Water Technologies, and Xylem (Evoqua)
Additional Attributes Dollar sales by membrane type and skid capacity, regional demand trends, competitive landscape, buyer preferences for modular versus custom-engineered units, integration with smart water management platforms, innovations in energy recovery, advanced pretreatment, and sustainable membrane materials

Industrial RO Skids Market by Segments

Capacity (m³/h):

  • ≤50 m³/h
  • 51-200 m³/h
  • 200 m³/h

Configuration:

  • Skid-Mounted Standard
  • Modular Containerized
  • Mobile/Trailer-Mounted

Feedwater Type:

  • Well/Surface Water
  • Recycle/Reuse (Effluent/Process)
  • Seawater (SWRO)
  • Others

End-Use Sector:

  • Food & Beverage Processing
  • Chemicals & Petrochemicals
  • Power Generation & Utilities
  • Water & Wastewater Utilities
  • Metals & Mining
  • Pulp & Paper
  • Automotive & Transportation
  • Electronics & Semiconductors
  • Oil & Gas (Up/Downstream)
  • Construction & Building Services

Region:

  • North America
    • United States
    • Canada
    • Mexico
  • Europe
    • Germany
    • United Kingdom
    • France
    • Italy
    • Spain
    • Nordic
    • Rest of Europe
  • Asia Pacific
    • China
    • Japan
    • South Korea
    • India
    • Australia
    • Rest of Asia Pacific
  • Latin America
    • Brazil
    • Argentina
    • Rest of Latin America
  • Middle East & Africa
    • Saudi Arabia
    • UAE
    • South Africa
    • Rest of Middle East & Africa

Table of Content

  1. Executive Summary
    • Global Market Outlook
    • Demand-side Trends
    • Supply-side Trends
    • Technology Roadmap Analysis
    • Analysis and Recommendations
  2. Market Overview
    • Market Coverage / Taxonomy
    • Market Definition / Scope / Limitations
  3. Market Background
    • Market Dynamics
      • Drivers
      • Restraints
      • Opportunity
      • Trends
    • Scenario Forecast
      • Demand in Optimistic Scenario
      • Demand in Likely Scenario
      • Demand in Conservative Scenario
    • Opportunity Map Analysis
    • Product Life Cycle Analysis
    • Supply Chain Analysis
    • Investment Feasibility Matrix
    • Value Chain Analysis
    • PESTLE and Porter’s Analysis
    • Regulatory Landscape
    • Regional Parent Market Outlook
    • Production and Consumption Statistics
    • Import and Export Statistics
  4. Global Market Analysis 2020 to 2024 and Forecast, 2025 to 2035
    • Historical Market Size Value (USD Million) Analysis, 2020 to 2024
    • Current and Future Market Size Value (USD Million) Projections, 2025 to 2035
      • Y-o-Y Growth Trend Analysis
      • Absolute $ Opportunity Analysis
  5. Global Market Pricing Analysis 2020 to 2024 and Forecast 2025 to 2035
  6. Global Market Analysis 2020 to 2024 and Forecast 2025 to 2035, By Capacity (m³/h)
    • Introduction / Key Findings
    • Historical Market Size Value (USD Million) Analysis By Capacity (m³/h) , 2020 to 2024
    • Current and Future Market Size Value (USD Million) Analysis and Forecast By Capacity (m³/h) , 2025 to 2035
      • 51-200
      • ≤50
      • >200
      • Special mission
      • Others
    • Y-o-Y Growth Trend Analysis By Capacity (m³/h) , 2020 to 2024
    • Absolute $ Opportunity Analysis By Capacity (m³/h) , 2025 to 2035
  7. Global Market Analysis 2020 to 2024 and Forecast 2025 to 2035, By End-Use Sector
    • Introduction / Key Findings
    • Historical Market Size Value (USD Million) Analysis By End-Use Sector, 2020 to 2024
    • Current and Future Market Size Value (USD Million) Analysis and Forecast By End-Use Sector, 2025 to 2035
      • Food & Beverage Processing
      • Chemicals & Petrochemicals
      • Power Generation & Utilities
      • Water & Wastewater Utilities
      • Metals & Mining
      • Pulp & Paper
      • Automotive & Transportation
      • Electronics & Semiconductors
      • Oil & Gas (Up/Downstream)
      • Construction & Building Services
    • Y-o-Y Growth Trend Analysis By End-Use Sector, 2020 to 2024
    • Absolute $ Opportunity Analysis By End-Use Sector, 2025 to 2035
  8. Global Market Analysis 2020 to 2024 and Forecast 2025 to 2035, By Configuration
    • Introduction / Key Findings
    • Historical Market Size Value (USD Million) Analysis By Configuration, 2020 to 2024
    • Current and Future Market Size Value (USD Million) Analysis and Forecast By Configuration, 2025 to 2035
      • Skid-Mounted Standard
      • Modular Containerized
      • Mobile/Trailer-Mounted
      • Online/other
      • Other
    • Y-o-Y Growth Trend Analysis By Configuration, 2020 to 2024
    • Absolute $ Opportunity Analysis By Configuration, 2025 to 2035
  9. Global Market Analysis 2020 to 2024 and Forecast 2025 to 2035, By Feedwater Type
    • Introduction / Key Findings
    • Historical Market Size Value (USD Million) Analysis By Feedwater Type, 2020 to 2024
    • Current and Future Market Size Value (USD Million) Analysis and Forecast By Feedwater Type, 2025 to 2035
      • Recycle/Reuse (Effluent/Process)
      • Well/Surface Water
      • Seawater (SWRO)
      • Others
      • Rest of World
    • Y-o-Y Growth Trend Analysis By Feedwater Type, 2020 to 2024
    • Absolute $ Opportunity Analysis By Feedwater Type, 2025 to 2035
  10. Global Market Analysis 2020 to 2024 and Forecast 2025 to 2035, By Region
    • Introduction
    • Historical Market Size Value (USD Million) Analysis By Region, 2020 to 2024
    • Current Market Size Value (USD Million) Analysis and Forecast By Region, 2025 to 2035
      • North America
      • Latin America
      • Western Europe
      • Eastern Europe
      • East Asia
      • South Asia and Pacific
      • Middle East & Africa
    • Market Attractiveness Analysis By Region
  11. North America Market Analysis 2020 to 2024 and Forecast 2025 to 2035, By Country
    • Historical Market Size Value (USD Million) Trend Analysis By Market Taxonomy, 2020 to 2024
    • Market Size Value (USD Million) Forecast By Market Taxonomy, 2025 to 2035
      • By Country
        • USA
        • Canada
        • Mexico
      • By Capacity (m³/h)
      • By End-Use Sector
      • By Configuration
      • By Feedwater Type
    • Market Attractiveness Analysis
      • By Country
      • By Capacity (m³/h)
      • By End-Use Sector
      • By Configuration
      • By Feedwater Type
    • Key Takeaways
  12. Latin America Market Analysis 2020 to 2024 and Forecast 2025 to 2035, By Country
    • Historical Market Size Value (USD Million) Trend Analysis By Market Taxonomy, 2020 to 2024
    • Market Size Value (USD Million) Forecast By Market Taxonomy, 2025 to 2035
      • By Country
        • Brazil
        • Chile
        • Rest of Latin America
      • By Capacity (m³/h)
      • By End-Use Sector
      • By Configuration
      • By Feedwater Type
    • Market Attractiveness Analysis
      • By Country
      • By Capacity (m³/h)
      • By End-Use Sector
      • By Configuration
      • By Feedwater Type
    • Key Takeaways
  13. Western Europe Market Analysis 2020 to 2024 and Forecast 2025 to 2035, By Country
    • Historical Market Size Value (USD Million) Trend Analysis By Market Taxonomy, 2020 to 2024
    • Market Size Value (USD Million) Forecast By Market Taxonomy, 2025 to 2035
      • By Country
        • Germany
        • UK
        • Italy
        • Spain
        • France
        • Nordic
        • BENELUX
        • Rest of Western Europe
      • By Capacity (m³/h)
      • By End-Use Sector
      • By Configuration
      • By Feedwater Type
    • Market Attractiveness Analysis
      • By Country
      • By Capacity (m³/h)
      • By End-Use Sector
      • By Configuration
      • By Feedwater Type
    • Key Takeaways
  14. Eastern Europe Market Analysis 2020 to 2024 and Forecast 2025 to 2035, By Country
    • Historical Market Size Value (USD Million) Trend Analysis By Market Taxonomy, 2020 to 2024
    • Market Size Value (USD Million) Forecast By Market Taxonomy, 2025 to 2035
      • By Country
        • Russia
        • Poland
        • Hungary
        • Balkan & Baltic
        • Rest of Eastern Europe
      • By Capacity (m³/h)
      • By End-Use Sector
      • By Configuration
      • By Feedwater Type
    • Market Attractiveness Analysis
      • By Country
      • By Capacity (m³/h)
      • By End-Use Sector
      • By Configuration
      • By Feedwater Type
    • Key Takeaways
  15. East Asia Market Analysis 2020 to 2024 and Forecast 2025 to 2035, By Country
    • Historical Market Size Value (USD Million) Trend Analysis By Market Taxonomy, 2020 to 2024
    • Market Size Value (USD Million) Forecast By Market Taxonomy, 2025 to 2035
      • By Country
        • China
        • Japan
        • South Korea
      • By Capacity (m³/h)
      • By End-Use Sector
      • By Configuration
      • By Feedwater Type
    • Market Attractiveness Analysis
      • By Country
      • By Capacity (m³/h)
      • By End-Use Sector
      • By Configuration
      • By Feedwater Type
    • Key Takeaways
  16. South Asia and Pacific Market Analysis 2020 to 2024 and Forecast 2025 to 2035, By Country
    • Historical Market Size Value (USD Million) Trend Analysis By Market Taxonomy, 2020 to 2024
    • Market Size Value (USD Million) Forecast By Market Taxonomy, 2025 to 2035
      • By Country
        • India
        • ASEAN
        • Australia & New Zealand
        • Rest of South Asia and Pacific
      • By Capacity (m³/h)
      • By End-Use Sector
      • By Configuration
      • By Feedwater Type
    • Market Attractiveness Analysis
      • By Country
      • By Capacity (m³/h)
      • By End-Use Sector
      • By Configuration
      • By Feedwater Type
    • Key Takeaways
  17. Middle East & Africa Market Analysis 2020 to 2024 and Forecast 2025 to 2035, By Country
    • Historical Market Size Value (USD Million) Trend Analysis By Market Taxonomy, 2020 to 2024
    • Market Size Value (USD Million) Forecast By Market Taxonomy, 2025 to 2035
      • By Country
        • Kingdom of Saudi Arabia
        • Other GCC Countries
        • Turkiye
        • South Africa
        • Other African Union
        • Rest of Middle East & Africa
      • By Capacity (m³/h)
      • By End-Use Sector
      • By Configuration
      • By Feedwater Type
    • Market Attractiveness Analysis
      • By Country
      • By Capacity (m³/h)
      • By End-Use Sector
      • By Configuration
      • By Feedwater Type
    • Key Takeaways
  18. Key Countries Market Analysis
    • USA
      • Pricing Analysis
      • Market Share Analysis, 2024
        • By Capacity (m³/h)
        • By End-Use Sector
        • By Configuration
        • By Feedwater Type
    • Canada
      • Pricing Analysis
      • Market Share Analysis, 2024
        • By Capacity (m³/h)
        • By End-Use Sector
        • By Configuration
        • By Feedwater Type
    • Mexico
      • Pricing Analysis
      • Market Share Analysis, 2024
        • By Capacity (m³/h)
        • By End-Use Sector
        • By Configuration
        • By Feedwater Type
    • Brazil
      • Pricing Analysis
      • Market Share Analysis, 2024
        • By Capacity (m³/h)
        • By End-Use Sector
        • By Configuration
        • By Feedwater Type
    • Chile
      • Pricing Analysis
      • Market Share Analysis, 2024
        • By Capacity (m³/h)
        • By End-Use Sector
        • By Configuration
        • By Feedwater Type
    • Germany
      • Pricing Analysis
      • Market Share Analysis, 2024
        • By Capacity (m³/h)
        • By End-Use Sector
        • By Configuration
        • By Feedwater Type
    • UK
      • Pricing Analysis
      • Market Share Analysis, 2024
        • By Capacity (m³/h)
        • By End-Use Sector
        • By Configuration
        • By Feedwater Type
    • Italy
      • Pricing Analysis
      • Market Share Analysis, 2024
        • By Capacity (m³/h)
        • By End-Use Sector
        • By Configuration
        • By Feedwater Type
    • Spain
      • Pricing Analysis
      • Market Share Analysis, 2024
        • By Capacity (m³/h)
        • By End-Use Sector
        • By Configuration
        • By Feedwater Type
    • France
      • Pricing Analysis
      • Market Share Analysis, 2024
        • By Capacity (m³/h)
        • By End-Use Sector
        • By Configuration
        • By Feedwater Type
    • India
      • Pricing Analysis
      • Market Share Analysis, 2024
        • By Capacity (m³/h)
        • By End-Use Sector
        • By Configuration
        • By Feedwater Type
    • ASEAN
      • Pricing Analysis
      • Market Share Analysis, 2024
        • By Capacity (m³/h)
        • By End-Use Sector
        • By Configuration
        • By Feedwater Type
    • Australia & New Zealand
      • Pricing Analysis
      • Market Share Analysis, 2024
        • By Capacity (m³/h)
        • By End-Use Sector
        • By Configuration
        • By Feedwater Type
    • China
      • Pricing Analysis
      • Market Share Analysis, 2024
        • By Capacity (m³/h)
        • By End-Use Sector
        • By Configuration
        • By Feedwater Type
    • Japan
      • Pricing Analysis
      • Market Share Analysis, 2024
        • By Capacity (m³/h)
        • By End-Use Sector
        • By Configuration
        • By Feedwater Type
    • South Korea
      • Pricing Analysis
      • Market Share Analysis, 2024
        • By Capacity (m³/h)
        • By End-Use Sector
        • By Configuration
        • By Feedwater Type
    • Russia
      • Pricing Analysis
      • Market Share Analysis, 2024
        • By Capacity (m³/h)
        • By End-Use Sector
        • By Configuration
        • By Feedwater Type
    • Poland
      • Pricing Analysis
      • Market Share Analysis, 2024
        • By Capacity (m³/h)
        • By End-Use Sector
        • By Configuration
        • By Feedwater Type
    • Hungary
      • Pricing Analysis
      • Market Share Analysis, 2024
        • By Capacity (m³/h)
        • By End-Use Sector
        • By Configuration
        • By Feedwater Type
    • Kingdom of Saudi Arabia
      • Pricing Analysis
      • Market Share Analysis, 2024
        • By Capacity (m³/h)
        • By End-Use Sector
        • By Configuration
        • By Feedwater Type
    • Turkiye
      • Pricing Analysis
      • Market Share Analysis, 2024
        • By Capacity (m³/h)
        • By End-Use Sector
        • By Configuration
        • By Feedwater Type
    • South Africa
      • Pricing Analysis
      • Market Share Analysis, 2024
        • By Capacity (m³/h)
        • By End-Use Sector
        • By Configuration
        • By Feedwater Type
  19. Market Structure Analysis
    • Competition Dashboard
    • Competition Benchmarking
    • Market Share Analysis of Top Players
      • By Regional
      • By Capacity (m³/h)
      • By End-Use Sector
      • By Configuration
      • By Feedwater Type
  20. Competition Analysis
    • Competition Deep Dive
      • Veolia Water Technologies & Solutions
        • Overview
        • Product Portfolio
        • Profitability by Market Segments (Product/Age /Sales Channel/Region)
        • Sales Footprint
        • Strategy Overview
          • Marketing Strategy
          • Product Strategy
          • Channel Strategy
      • Aquatech International
      • Fluence Corporation
      • H2O Innovation
      • IDE Technologies
      • Kovalus Separation (ex-Koch Membrane)
      • Kurita America
      • Pentair
      • Toray Membrane
      • Xylem (Evoqua)
  21. Assumptions & Acronyms Used
  22. Research Methodology

List of Tables

  • Table 1: Global Market Value (USD Million) Forecast by Region, 2020-2035
  • Table 2: Global Market Value (USD Million) Forecast by Capacity (m³/h) , 2020-2035
  • Table 3: Global Market Value (USD Million) Forecast by End-Use Sector, 2020-2035
  • Table 4: Global Market Value (USD Million) Forecast by Configuration, 2020-2035
  • Table 5: Global Market Value (USD Million) Forecast by Feedwater Type, 2020-2035
  • Table 6: North America Market Value (USD Million) Forecast by Country, 2020-2035
  • Table 7: North America Market Value (USD Million) Forecast by Capacity (m³/h) , 2020-2035
  • Table 8: North America Market Value (USD Million) Forecast by End-Use Sector, 2020-2035
  • Table 9: North America Market Value (USD Million) Forecast by Configuration, 2020-2035
  • Table 10: North America Market Value (USD Million) Forecast by Feedwater Type, 2020-2035
  • Table 11: Latin America Market Value (USD Million) Forecast by Country, 2020-2035
  • Table 12: Latin America Market Value (USD Million) Forecast by Capacity (m³/h) , 2020-2035
  • Table 13: Latin America Market Value (USD Million) Forecast by End-Use Sector, 2020-2035
  • Table 14: Latin America Market Value (USD Million) Forecast by Configuration, 2020-2035
  • Table 15: Latin America Market Value (USD Million) Forecast by Feedwater Type, 2020-2035
  • Table 16: Western Europe Market Value (USD Million) Forecast by Country, 2020-2035
  • Table 17: Western Europe Market Value (USD Million) Forecast by Capacity (m³/h) , 2020-2035
  • Table 18: Western Europe Market Value (USD Million) Forecast by End-Use Sector, 2020-2035
  • Table 19: Western Europe Market Value (USD Million) Forecast by Configuration, 2020-2035
  • Table 20: Western Europe Market Value (USD Million) Forecast by Feedwater Type, 2020-2035
  • Table 21: Eastern Europe Market Value (USD Million) Forecast by Country, 2020-2035
  • Table 22: Eastern Europe Market Value (USD Million) Forecast by Capacity (m³/h) , 2020-2035
  • Table 23: Eastern Europe Market Value (USD Million) Forecast by End-Use Sector, 2020-2035
  • Table 24: Eastern Europe Market Value (USD Million) Forecast by Configuration, 2020-2035
  • Table 25: Eastern Europe Market Value (USD Million) Forecast by Feedwater Type, 2020-2035
  • Table 26: East Asia Market Value (USD Million) Forecast by Country, 2020-2035
  • Table 27: East Asia Market Value (USD Million) Forecast by Capacity (m³/h) , 2020-2035
  • Table 28: East Asia Market Value (USD Million) Forecast by End-Use Sector, 2020-2035
  • Table 29: East Asia Market Value (USD Million) Forecast by Configuration, 2020-2035
  • Table 30: East Asia Market Value (USD Million) Forecast by Feedwater Type, 2020-2035
  • Table 31: South Asia and Pacific Market Value (USD Million) Forecast by Country, 2020-2035
  • Table 32: South Asia and Pacific Market Value (USD Million) Forecast by Capacity (m³/h) , 2020-2035
  • Table 33: South Asia and Pacific Market Value (USD Million) Forecast by End-Use Sector, 2020-2035
  • Table 34: South Asia and Pacific Market Value (USD Million) Forecast by Configuration, 2020-2035
  • Table 35: South Asia and Pacific Market Value (USD Million) Forecast by Feedwater Type, 2020-2035
  • Table 36: Middle East & Africa Market Value (USD Million) Forecast by Country, 2020-2035
  • Table 37: Middle East & Africa Market Value (USD Million) Forecast by Capacity (m³/h) , 2020-2035
  • Table 38: Middle East & Africa Market Value (USD Million) Forecast by End-Use Sector, 2020-2035
  • Table 39: Middle East & Africa Market Value (USD Million) Forecast by Configuration, 2020-2035
  • Table 40: Middle East & Africa Market Value (USD Million) Forecast by Feedwater Type, 2020-2035

List of Figures

  • Figure 1: Global Market Pricing Analysis
  • Figure 2: Global Market Value (USD Million) Forecast 2020-2035
  • Figure 3: Global Market Value Share and BPS Analysis by Capacity (m³/h) , 2025 and 2035
  • Figure 4: Global Market Y-o-Y Growth Comparison by Capacity (m³/h) , 2025-2035
  • Figure 5: Global Market Attractiveness Analysis by Capacity (m³/h)
  • Figure 6: Global Market Value Share and BPS Analysis by End-Use Sector, 2025 and 2035
  • Figure 7: Global Market Y-o-Y Growth Comparison by End-Use Sector, 2025-2035
  • Figure 8: Global Market Attractiveness Analysis by End-Use Sector
  • Figure 9: Global Market Value Share and BPS Analysis by Configuration, 2025 and 2035
  • Figure 10: Global Market Y-o-Y Growth Comparison by Configuration, 2025-2035
  • Figure 11: Global Market Attractiveness Analysis by Configuration
  • Figure 12: Global Market Value Share and BPS Analysis by Feedwater Type, 2025 and 2035
  • Figure 13: Global Market Y-o-Y Growth Comparison by Feedwater Type, 2025-2035
  • Figure 14: Global Market Attractiveness Analysis by Feedwater Type
  • Figure 15: Global Market Value (USD Million) Share and BPS Analysis by Region, 2025 and 2035
  • Figure 16: Global Market Y-o-Y Growth Comparison by Region, 2025-2035
  • Figure 17: Global Market Attractiveness Analysis by Region
  • Figure 18: North America Market Incremental Dollar Opportunity, 2025-2035
  • Figure 19: Latin America Market Incremental Dollar Opportunity, 2025-2035
  • Figure 20: Western Europe Market Incremental Dollar Opportunity, 2025-2035
  • Figure 21: Eastern Europe Market Incremental Dollar Opportunity, 2025-2035
  • Figure 22: East Asia Market Incremental Dollar Opportunity, 2025-2035
  • Figure 23: South Asia and Pacific Market Incremental Dollar Opportunity, 2025-2035
  • Figure 24: Middle East & Africa Market Incremental Dollar Opportunity, 2025-2035
  • Figure 25: North America Market Value Share and BPS Analysis by Country, 2025 and 2035
  • Figure 26: North America Market Value Share and BPS Analysis by Capacity (m³/h) , 2025 and 2035
  • Figure 27: North America Market Y-o-Y Growth Comparison by Capacity (m³/h) , 2025-2035
  • Figure 28: North America Market Attractiveness Analysis by Capacity (m³/h)
  • Figure 29: North America Market Value Share and BPS Analysis by End-Use Sector, 2025 and 2035
  • Figure 30: North America Market Y-o-Y Growth Comparison by End-Use Sector, 2025-2035
  • Figure 31: North America Market Attractiveness Analysis by End-Use Sector
  • Figure 32: North America Market Value Share and BPS Analysis by Configuration, 2025 and 2035
  • Figure 33: North America Market Y-o-Y Growth Comparison by Configuration, 2025-2035
  • Figure 34: North America Market Attractiveness Analysis by Configuration
  • Figure 35: North America Market Value Share and BPS Analysis by Feedwater Type, 2025 and 2035
  • Figure 36: North America Market Y-o-Y Growth Comparison by Feedwater Type, 2025-2035
  • Figure 37: North America Market Attractiveness Analysis by Feedwater Type
  • Figure 38: Latin America Market Value Share and BPS Analysis by Country, 2025 and 2035
  • Figure 39: Latin America Market Value Share and BPS Analysis by Capacity (m³/h) , 2025 and 2035
  • Figure 40: Latin America Market Y-o-Y Growth Comparison by Capacity (m³/h) , 2025-2035
  • Figure 41: Latin America Market Attractiveness Analysis by Capacity (m³/h)
  • Figure 42: Latin America Market Value Share and BPS Analysis by End-Use Sector, 2025 and 2035
  • Figure 43: Latin America Market Y-o-Y Growth Comparison by End-Use Sector, 2025-2035
  • Figure 44: Latin America Market Attractiveness Analysis by End-Use Sector
  • Figure 45: Latin America Market Value Share and BPS Analysis by Configuration, 2025 and 2035
  • Figure 46: Latin America Market Y-o-Y Growth Comparison by Configuration, 2025-2035
  • Figure 47: Latin America Market Attractiveness Analysis by Configuration
  • Figure 48: Latin America Market Value Share and BPS Analysis by Feedwater Type, 2025 and 2035
  • Figure 49: Latin America Market Y-o-Y Growth Comparison by Feedwater Type, 2025-2035
  • Figure 50: Latin America Market Attractiveness Analysis by Feedwater Type
  • Figure 51: Western Europe Market Value Share and BPS Analysis by Country, 2025 and 2035
  • Figure 52: Western Europe Market Value Share and BPS Analysis by Capacity (m³/h) , 2025 and 2035
  • Figure 53: Western Europe Market Y-o-Y Growth Comparison by Capacity (m³/h) , 2025-2035
  • Figure 54: Western Europe Market Attractiveness Analysis by Capacity (m³/h)
  • Figure 55: Western Europe Market Value Share and BPS Analysis by End-Use Sector, 2025 and 2035
  • Figure 56: Western Europe Market Y-o-Y Growth Comparison by End-Use Sector, 2025-2035
  • Figure 57: Western Europe Market Attractiveness Analysis by End-Use Sector
  • Figure 58: Western Europe Market Value Share and BPS Analysis by Configuration, 2025 and 2035
  • Figure 59: Western Europe Market Y-o-Y Growth Comparison by Configuration, 2025-2035
  • Figure 60: Western Europe Market Attractiveness Analysis by Configuration
  • Figure 61: Western Europe Market Value Share and BPS Analysis by Feedwater Type, 2025 and 2035
  • Figure 62: Western Europe Market Y-o-Y Growth Comparison by Feedwater Type, 2025-2035
  • Figure 63: Western Europe Market Attractiveness Analysis by Feedwater Type
  • Figure 64: Eastern Europe Market Value Share and BPS Analysis by Country, 2025 and 2035
  • Figure 65: Eastern Europe Market Value Share and BPS Analysis by Capacity (m³/h) , 2025 and 2035
  • Figure 66: Eastern Europe Market Y-o-Y Growth Comparison by Capacity (m³/h) , 2025-2035
  • Figure 67: Eastern Europe Market Attractiveness Analysis by Capacity (m³/h)
  • Figure 68: Eastern Europe Market Value Share and BPS Analysis by End-Use Sector, 2025 and 2035
  • Figure 69: Eastern Europe Market Y-o-Y Growth Comparison by End-Use Sector, 2025-2035
  • Figure 70: Eastern Europe Market Attractiveness Analysis by End-Use Sector
  • Figure 71: Eastern Europe Market Value Share and BPS Analysis by Configuration, 2025 and 2035
  • Figure 72: Eastern Europe Market Y-o-Y Growth Comparison by Configuration, 2025-2035
  • Figure 73: Eastern Europe Market Attractiveness Analysis by Configuration
  • Figure 74: Eastern Europe Market Value Share and BPS Analysis by Feedwater Type, 2025 and 2035
  • Figure 75: Eastern Europe Market Y-o-Y Growth Comparison by Feedwater Type, 2025-2035
  • Figure 76: Eastern Europe Market Attractiveness Analysis by Feedwater Type
  • Figure 77: East Asia Market Value Share and BPS Analysis by Country, 2025 and 2035
  • Figure 78: East Asia Market Value Share and BPS Analysis by Capacity (m³/h) , 2025 and 2035
  • Figure 79: East Asia Market Y-o-Y Growth Comparison by Capacity (m³/h) , 2025-2035
  • Figure 80: East Asia Market Attractiveness Analysis by Capacity (m³/h)
  • Figure 81: East Asia Market Value Share and BPS Analysis by End-Use Sector, 2025 and 2035
  • Figure 82: East Asia Market Y-o-Y Growth Comparison by End-Use Sector, 2025-2035
  • Figure 83: East Asia Market Attractiveness Analysis by End-Use Sector
  • Figure 84: East Asia Market Value Share and BPS Analysis by Configuration, 2025 and 2035
  • Figure 85: East Asia Market Y-o-Y Growth Comparison by Configuration, 2025-2035
  • Figure 86: East Asia Market Attractiveness Analysis by Configuration
  • Figure 87: East Asia Market Value Share and BPS Analysis by Feedwater Type, 2025 and 2035
  • Figure 88: East Asia Market Y-o-Y Growth Comparison by Feedwater Type, 2025-2035
  • Figure 89: East Asia Market Attractiveness Analysis by Feedwater Type
  • Figure 90: South Asia and Pacific Market Value Share and BPS Analysis by Country, 2025 and 2035
  • Figure 91: South Asia and Pacific Market Value Share and BPS Analysis by Capacity (m³/h) , 2025 and 2035
  • Figure 92: South Asia and Pacific Market Y-o-Y Growth Comparison by Capacity (m³/h) , 2025-2035
  • Figure 93: South Asia and Pacific Market Attractiveness Analysis by Capacity (m³/h)
  • Figure 94: South Asia and Pacific Market Value Share and BPS Analysis by End-Use Sector, 2025 and 2035
  • Figure 95: South Asia and Pacific Market Y-o-Y Growth Comparison by End-Use Sector, 2025-2035
  • Figure 96: South Asia and Pacific Market Attractiveness Analysis by End-Use Sector
  • Figure 97: South Asia and Pacific Market Value Share and BPS Analysis by Configuration, 2025 and 2035
  • Figure 98: South Asia and Pacific Market Y-o-Y Growth Comparison by Configuration, 2025-2035
  • Figure 99: South Asia and Pacific Market Attractiveness Analysis by Configuration
  • Figure 100: South Asia and Pacific Market Value Share and BPS Analysis by Feedwater Type, 2025 and 2035
  • Figure 101: South Asia and Pacific Market Y-o-Y Growth Comparison by Feedwater Type, 2025-2035
  • Figure 102: South Asia and Pacific Market Attractiveness Analysis by Feedwater Type
  • Figure 103: Middle East & Africa Market Value Share and BPS Analysis by Country, 2025 and 2035
  • Figure 104: Middle East & Africa Market Value Share and BPS Analysis by Capacity (m³/h) , 2025 and 2035
  • Figure 105: Middle East & Africa Market Y-o-Y Growth Comparison by Capacity (m³/h) , 2025-2035
  • Figure 106: Middle East & Africa Market Attractiveness Analysis by Capacity (m³/h)
  • Figure 107: Middle East & Africa Market Value Share and BPS Analysis by End-Use Sector, 2025 and 2035
  • Figure 108: Middle East & Africa Market Y-o-Y Growth Comparison by End-Use Sector, 2025-2035
  • Figure 109: Middle East & Africa Market Attractiveness Analysis by End-Use Sector
  • Figure 110: Middle East & Africa Market Value Share and BPS Analysis by Configuration, 2025 and 2035
  • Figure 111: Middle East & Africa Market Y-o-Y Growth Comparison by Configuration, 2025-2035
  • Figure 112: Middle East & Africa Market Attractiveness Analysis by Configuration
  • Figure 113: Middle East & Africa Market Value Share and BPS Analysis by Feedwater Type, 2025 and 2035
  • Figure 114: Middle East & Africa Market Y-o-Y Growth Comparison by Feedwater Type, 2025-2035
  • Figure 115: Middle East & Africa Market Attractiveness Analysis by Feedwater Type
  • Figure 116: Global Market - Tier Structure Analysis
  • Figure 117: Global Market - Company Share Analysis

Frequently Asked Questions

How big is the industrial ro skids market in 2025?

The global industrial ro skids market is estimated to be valued at USD 4,200.0 million in 2025.

What will be the size of industrial ro skids market in 2035?

The market size for the industrial ro skids market is projected to reach USD 6,841.4 million by 2035.

How much will be the industrial ro skids market growth between 2025 and 2035?

The industrial ro skids market is expected to grow at a 5.0% CAGR between 2025 and 2035.

What are the key product types in the industrial ro skids market?

The key product types in industrial ro skids market are 51–200, ≤50 and >200.

Which end-use sector segment to contribute significant share in the industrial ro skids market in 2025?

In terms of end-use sector, food & beverage processing segment to command 14.0% share in the industrial ro skids market in 2025.

Explore Similar Insights

Future Market Insights

Industrial RO Skids Market

Chat With

MaRIA

Hi There, I am MaRIA, Your Market Research Intelligence Assistant. How may I help you?