The global market for industrial safety Footwear from 2025 to 2035 will see tremendous growth. Stricter rules for safety in the work place are a powerful driving force behind this. An increase in social consciousness of workers’ rights to protection has also played some part, and new techniques are now being applied directly to the construction of protective footwear itself. Industrial safety footwear, including boots and shoes made from tough materials, is necessary for workers in all of the following industries: building construction, manufacturing, oil & gas drilling and mining.

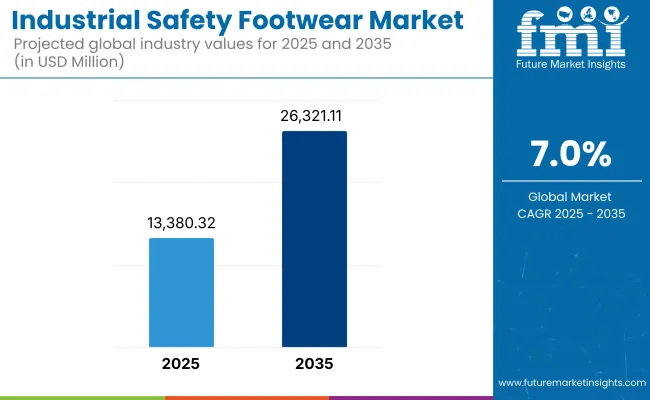
The market is projected to surpass USD 26,321.11 Million by 2035, growing at a CAGR of 7.0% during the forecast period.
North America with its strict occupational safety laws, North America is the world's largest market for industrial footwear. This is particularly true in the USA and Canada where large mass industries like manufacturing and oil & gas mean at any time there is always other demand to meet. By using smart footwear technology as well as new products developed from advanced materials, companies have not only increased worker comfort but also succeeded in reducing accidents.
Europe In countries such as Germany, France and the UK where worker safety laws are strictly enforced the market for safety footwear is driven. The region has a strong culture of safety at work, workers frequently wear protective shoes. New trends in the marketplace for safety boots include technology such as anti-fatigue soles and breathability upgrades. Newcomers are key industry players from other regions that join this trend. Also, an increasing awareness of environment safe or eco-friendly safety boots has added to market growth
The Asia-Pacific area is expected to grow as the most rapidly expanding market, taking off with the spread of industrialization and urbanization as well as rapid urban construction. Industrial safety footwear is increasingly bought by groups such as manufacturing plants and mining companies because costs are relatively low.
Challenge
Compliance with Safety Regulations
The problem facing the Industrial Safety Footwear Market is stiff operating standards imposed by different regions. Producers have to meet ever-changing safety norms, at higher cost than ever before, and with greater complexity in production.
Fluctuations in Raw Material Prices
The price of materials-leather, rubbers, synthetics - fluctuate widely, affecting manufacturer profits paradoxically. The supply chain interruptions only make things more difficult. So, price stability is also one big headache.
Opportunity
Rising Awareness of Workplace Safety
With increased awareness of occupational hazards and strict enforcement of safety regulations on the job, there is room for growth. Employers are providing more protection equipment, this will surely drive up demand for industrial safety shoes.
Advancements in Material Technology
Innovations in light and sturdy materials are increasing the comfort and layered types of protection safety shoes can offer. Developments such as compound resilient toe caps and insoles with cushioning bamboo flooring are attracting ever more customers from diverse walks of life, resulting in market growth.
The five-year period from 2020 to 2024 saw growing adoption of safety shoes as a result of tighter workplace safety regulations and heightened awareness among all sectors. While the COVID-19 pandemic further magnified risk management aspects including personal protective equipment (PPE), it also increased demand for this latest work gear.
Five years down the line-from 2025 to 2035, the shoe-making industry is expected to rise to yet newer heights with smart footwear technology, sustainable manufacturing procedures and a need for customization tailored specifically to suit industrial requirements. Construction, manufacturing and the oil & gas industries are still growing; this will provide a continuing stimulus to shoe production demand.
Market Shifts: A Comparative Analysis 2020 to 2024 vs. 2025 to 2035
| Market Shift | 2020 to 2024 Trends |
|---|---|
| Regulatory Landscape | Stricter workplace safety standards |
| Market Demand | Increased due to PPE adoption |
| Industry Adoption | Traditional protective footwear designs |
| Supply Chain and Sourcing | Regional dependence on leather and rubber |
| Market Competition | Dominated by established footwear brands |
| Market Growth Drivers | Workplace safety regulations and awareness |
| Sustainability and Energy Efficiency | Limited focus on eco-friendly materials |
| Integration of Digital Innovations | Basic comfort and durability improvements |
| Advancements in Product Design | Traditional steel-toe boots and slip-resistant soles |
| Market Shift | 2025 to 2035 Projections |
|---|---|
| Regulatory Landscape | More stringent global compliance and certification requirements |
| Market Demand | Sustained growth in industrial sectors demanding specialized footwear |
| Industry Adoption | Smart safety footwear with IoT sensors for hazard detection |
| Supply Chain and Sourcing | Shift toward sustainable and recyclable materials |
| Market Competition | Entry of new players leveraging technology and sustainability |
| Market Growth Drivers | Technological advancements and eco-conscious consumer preferences |
| Sustainability and Energy Efficiency | Expansion of biodegradable, energy-efficient footwear production |
| Integration of Digital Innovations | AI-driven design, foot pressure sensors, and smart alerts |
| Advancements in Product Design | Lightweight, ergonomic, and customizable safety footwear |

Such moves are giving the USA industrial safety footwear market an ever-larger share of demand. Construction, manufacturing and oil & gas sectors are important factors contributing to market growth. Given the consumption of 389 million pairs of certified safety shoes each year in china, demand for such products is increasing. Lightweight, ergonomic and anti-static footwear its National Invincible heat isolation electric wire footwear now accounts for over 60% of industrial safety shoe market share in China.
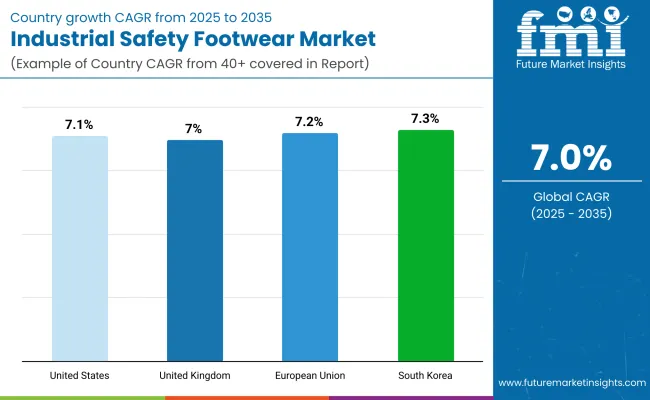
| Country | CAGR (2025 to 2035) |
|---|---|
| United States | 7.1% |
The UK market for industrial safety footwear continues to see growth, in response to young workers obsessed with freedom and European regulations cutting down on workplace accidents. With the expansion of industry and logistics sectors and rising consumer demand for eco-friendly or sustainable footwear, this will only foster more growth. Some member states have laws or rules which require staff to utilize safety gear when on the job.
| Country | CAGR (2025 to 2035) |
|---|---|
| United Kingdom | 7.0% |
The European Union market for industrial safety footwear by strengthening EU laws mandating employee safety at work. Germany, France and Italy have strong manufacturing bases, all of which need high quality protective shoes. Even products that are both stylish and safe conversely, the market is beginning to show a tendency toward comfort leading young people to request protective footwear that could also be categorized as sportswear.
| Region | CAGR (2025 to 2035) |
|---|---|
| European Union | 7.2% |
South Korea’s industrial safety footwear market is growing in line with the needs of an industry rapidly becoming mechanized and one equally quick to adopt modern workplace safety standards. The main drivers of demand for safety shoes are sectors like automotive, electronics and heavy industry. Anti-fatigue soles and smart safety shoes, among other technological advances, are making inroads with workers in manufacturing industries.
| Country | CAGR (2025 to 2035) |
|---|---|
| South Korea | 7.3% |

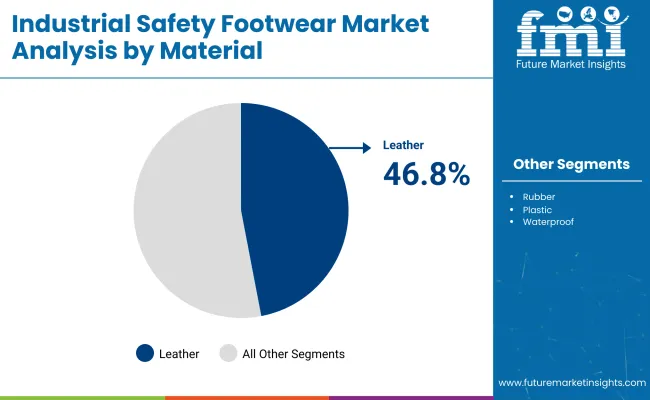
| Material | Market Share (2025) |
|---|---|
| Leather | 46.8% |
Safety footwear is essential for protecting workers from injuries due to falling objects, sharp materials, electrical hazards and chemical spills. Leather safety shoes are far and away the most popular, taking up 46.8% of the market by 2025. It is the choice of many in the industrial environment for it is long lasting, wear resistant; flexible and ventilated-traits that no other material has. Leather is best suited to dealing with impact, compression and puncture hazards.
It is the best choice for the myriad of dangerous work place which must now be found around construction sites constantly. Improved methods of leather treatment, such as waterproof coatings and fire-proof finishes, make it a more practical material for use in extreme labour situations. In many countries, manufacturers are also integrating steel toe caps, anti-skid ostrich soles and design choices aimed at improving the comfort and safety of workers into leather safety shoes and boots.
As the focus in industry shifts toward greater employee safety, more compliance with rules such as OSHA (Occupational Safety and Health Administration) and ISO safety standards, and interest in ecological, self-renewing leather alternatives, demand for leather safety footwear is expected to continue strong.

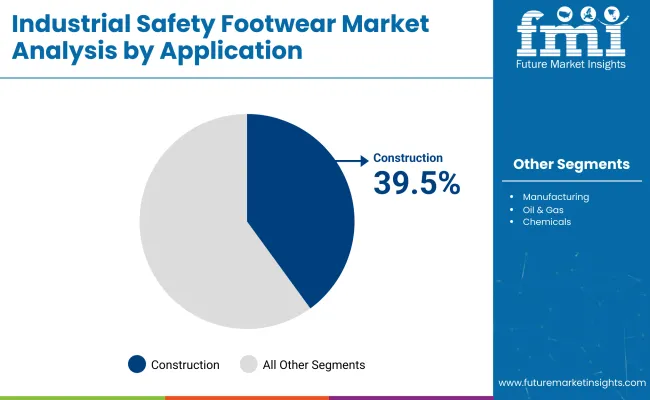
| Application | Market Share (2025) |
|---|---|
| Construction | 39.5% |
Predicted and industrial safety footwear market at 39.5% share domination the construction industry. Construction workers work in hazardous environments loaded with heavy machinery around them disco dust plows it everywhere sharp objects flying. Sharp edges are common grain of this work so those who want to keep on their toes need protective footwear that won't slip around under them.
As a result, countries around the world have now put forward strict regulations to demand that employers provide personal protective equipment (PPE) - including safety footwear. Enforcement has created a major push for reinforced boots and shoes complete with such features as toe protection slip-resistant soles electrical insulation puncture-resistant layers.
As infrastructure development and urbanization occur rapidly worldwide, and residential, commercial construction projects abound, the construction industry's requirement for durable, against impacts of various kinds’ safety footwear continues to soar.
The industrial safety footwear market is experiencing robust growth due to increasingly strict workplace safety rules, greater employee protection awareness and footwear technology developing. With its protection against hazards ranging from impact and compression to chemical contact, as well as a host of other dangers, industrial safety footwear plays a crucial role in production industries like construction, manufacturing oil & gas and mining They will be adding these features in their industrial safety boots to make the wearer even more comfortable and to enable their longevity.
Market Share Analysis by Company
| Company Name | Estimated Market Share (%) |
|---|---|
| Honeywell International | 14-18% |
| Wolverine World Wide | 12-16% |
| Bata Industrial | 10-14% |
| Uvex Group | 8-12% |
| Dunlop Protective Footwear | 6-10% |
| Other Companies (combined) | 35-45% |
| Company Name | Key Offerings/Activities |
|---|---|
| Honeywell International | In February 2024, introduced smart industrial safety boots with embedded sensors for real-time hazard detection. In January 2025, expanded its industrial footwear range with lightweight, puncture-resistant technology. |
| Wolverine World Wide | In March 2024, launched an eco-friendly industrial boot line made from recycled materials. In February 2025, announced a partnership with leading construction firms to develop industry-specific safety footwear. |
| Bata Industrial | In April 2024, introduced a breathable yet waterproof safety shoe series for extreme environments. In January 2025, integrated AI-driven sole technology for enhanced grip and anti-fatigue support. |
| Uvex Group | In May 2024, expanded its European distribution network for industrial safety footwear. In February 2025, launched a new shock-absorbing boot model for high-impact work environments. |
| Dunlop Protective Footwear | In August 2024, developed a next-generation chemical-resistant boot for the oil & gas industry. In March 2025, introduced lightweight steel-toe boots with enhanced ergonomic design. |
Key Company Insights
Honeywell International (14-18%)
A leader in safety equipment, Honeywell leverages smart technology to improve workplace safety, offering advanced industrial footwear with real-time hazard monitoring.
Wolverine World Wide (12-16%)
Focusing on sustainability, Wolverine has pioneered eco-friendly industrial safety footwear while maintaining high durability and protection standards.
Bata Industrial (10-14%)
Bata Industrial combines innovation with comfort, delivering breathable, waterproof, and AI-enhanced safety footwear tailored for extreme work conditions.
Uvex Group (8-12%)
Uvex emphasizes high-impact protection and ergonomic design, ensuring superior safety and comfort for industrial workers worldwide.
Dunlop Protective Footwear (6-10%)
Specializing in chemical and water-resistant boots, Dunlop Protective Footwear is a key player in industries requiring heavy-duty protective footwear solutions.
Other Key Players (35-45% Combined)
The overall market size for Industrial Safety Footwear market was USD 13,380.32 Million in 2025.
The Industrial Safety Footwear market is expected to reach USD 26,321.11 Million in 2035.
The demand for industrial safety footwear will be driven by stringent workplace safety regulations, rising industrialization, growing construction and manufacturing activities, increasing awareness of worker safety, and expanding applications across oil & gas, mining, and pharmaceutical sectors.
The top 5 countries which drives the development of Industrial Safety Footwear market are USA, European Union, Japan, South Korea and UK.
Construction Industry demand supplier to command significant share over the assessment period.


Full Research Suite comprises of:
Market outlook & trends analysis
Interviews & case studies
Strategic recommendations
Vendor profiles & capabilities analysis
5-year forecasts
8 regions and 60+ country-level data splits
Market segment data splits
12 months of continuous data updates
DELIVERED AS:
PDF EXCEL ONLINE
Industrial Precision Oven Market Size and Share Forecast Outlook 2025 to 2035
Industrial Water Chiller for PCB Market Size and Share Forecast Outlook 2025 to 2035
Industrial & Commercial HVLS Fans Market Size and Share Forecast Outlook 2025 to 2035
Industrial Robot Controller Market Size and Share Forecast Outlook 2025 to 2035
Industrial Wired Routers Market Size and Share Forecast Outlook 2025 to 2035
Industrial Evaporative Condensers Market Size and Share Forecast Outlook 2025 to 2035
Industrial Energy Management System Market Size and Share Forecast Outlook 2025 to 2035
Industrial Insulation Market Size and Share Forecast Outlook 2025 to 2035
Industrial Cleaner Market Size and Share Forecast Outlook 2025 to 2035
Industrial Dust Treatment System Market Size and Share Forecast Outlook 2025 to 2035
Industrial Vertical Washing Tower Market Size and Share Forecast Outlook 2025 to 2035
Industrial Pepper Market Size and Share Forecast Outlook 2025 to 2035
Industrial Electronics Packaging Market Forecast and Outlook 2025 to 2035
Industrial Absorbent Market Forecast and Outlook 2025 to 2035
Industrial Furnace Industry Analysis in Europe Forecast and Outlook 2025 to 2035
Industrial Denox System Market Size and Share Forecast Outlook 2025 to 2035
Industrial Electronic Pressure Switch Market Size and Share Forecast Outlook 2025 to 2035
Industrial WiFi Module Market Size and Share Forecast Outlook 2025 to 2035
Industrial Security System Market Forecast Outlook 2025 to 2035
Industrial Film Market Forecast Outlook 2025 to 2035

Thank you!
You will receive an email from our Business Development Manager. Please be sure to check your SPAM/JUNK folder too.
Chat With
MaRIA