
- Market Size (2026)
- USD 15.0 Bn
- Forecast (2036)
- USD 25.9 Bn
- CAGR (2026 to 2036)
- 5.6%
How big is Industrial Wastewater Treatment Chemical Market in 2026?
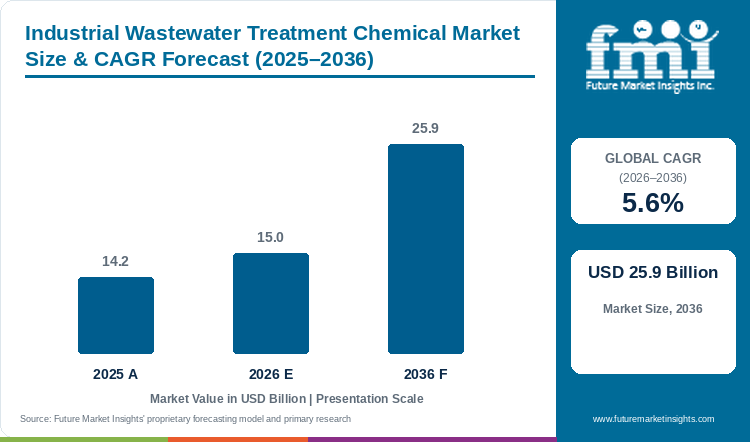
Registering a value of USD 14.2 billion in 2025, the industrial wastewater treatment chemical market expanded to USD 15.0 billion in 2026 and is anticipated to achieve USD 25.9 billion by 2036, driven by a 5.6% CAGR.
The global industrial wastewater treatment chemical market was valued at USD 14.2 billion in 2025 and is estimated to reach USD 15.0 billion in 2026. Total industry valuation is forecast to hit USD 25.9 billion by 2036, expanding at a compound annual growth rate (CAGR) of 5.6% between 2026 and 2036. Coagulants and flocculants hold an estimated 36.0% share of 2026 demand since refineries and mineral processors dose cationic emulsion breakers and polyacrylamide polymers continuously across dissolved air flotation and primary clarifier trains. Higher industrial freshwater withdrawal tariffs and zero-liquid-discharge permits force plant managers to recycle blowdown and process effluent internally rather than discharging once-through wastewater, with Statistics Canada reporting in February 2026 that capital investments in mining, oil and gas extraction are projected to reach CAD 65.3 billion (+6.8%) paired with a CAD 41.5 billion (+9.7%) utility investment expansion in 2026 [1]. Since internal water reuse requires multi-stage clarification and reverse osmosis antiscalant protection, total chemical demand outpaces standalone corrosion inhibitors at a 4.1% CAGR. Water technology groups are locking in multi-year outsourced treatment programs to capture that spend, as Veolia executed a USD 500 million 30-year agreement with SATORP in September 2025 to build and operate an 8.8-million-cubic-meter annual petrochemical effluent and spent-caustic recycling plant in Jubail [2]. Plant-level benchmarking by FMI confirms that industrial engineers renew chemical service agreements on membrane flux recovery and zero permit exceedances through 2036.
Key Market Trends & Insights
- By chemical function: Coagulants and Flocculants hold an estimated 36.0% share in 2026 since high-tonnage inorganic salts and polymers are dosed across every primary clarifier and sludge centrifuge.
- By end-use industry: Oil and Gas Refining and Petrochemicals represent 42.0% in 2026 given intensive demulsifier, sulfide scavenger, and scale inhibitor consumption across produced and process water.
- By treatment stage: Primary Mechanical Separation and Clarification accounts for 58.0% in 2026 driven by bulk chemical addition in API separators, dissolved air flotation units, and settling basins.
- By delivery format: Bulk Liquid Concentrates and Emulsions secure 53.0% in 2026 owing to closed-loop automated metering pump compatibility in hazardous refinery and chemical zones.
- By service mode: Integrated Chemical and Digital Dosing Contracts command 57.0% in 2026 through vendor-managed telemetry skids and guaranteed effluent compliance.
Regional Highlights
- Top national expansion: Canada leads national growth projections at a 6.2% CAGR through 2036 under oil-sands produced-water recycling and gold and critical-mineral tailings treatment investments.
- Broader country progression: Mexico tracks at a 6.1% CAGR ahead of Australia at 6.0% and the UK at 5.6%, while the USA advances at 5.5% and Italy records a 5.1% CAGR.
Market Size & Forecast
Table 1: Market Size and Forecast for the Industrial Wastewater Treatment Chemical Market (USD billion and CAGR percentage), 2025 to 2036
| Metric | Value |
|---|---|
| 2025 Market Size | USD 14.2 billion |
| Estimated Market Size in 2026 | USD 15.0 billion |
| Projected Market Size by 2036 | USD 25.9 billion |
| CAGR, 2026 to 2036 | 5.6% |
| Added Revenue, 2026 to 2036 | USD 10.9 billion |
Heavy industrial complexes spanning petroleum refineries and thermal power stations as well as chemical plants and paper mills face stricter regulatory caps on chemical oxygen demand and heavy-metal discharges. When factories increase cooling-tower cycles of concentration or recycle treated effluent back into boiler feedwater to conserve fresh water, dissolved calcium and silica multiply rapidly. Regulatory performance records published by the UK Water Services Regulation Authority (Ofwat) in October 2025 confirm that the GBP 104 billion PR24 investment framework enforces strict nutrient and trade-effluent compliance across industrial and utility discharges [3]. Plant utilities directors therefore combine primary clarifier coagulants with specialized cooling water treatment chemicals to prevent heat-exchanger scaling and biological fouling.
Treated-Industrial-Effluent and Specialty-Dosage Sizing
Table 2: Treated-Industrial-Effluent and Specialty-Dosage Sizing for the Industrial Wastewater Treatment Chemical Market (USD billion and operational ranges), 2025 to 2036
| Metric | 2025 | 2026 | 2036 |
|---|---|---|---|
| Market size (USD billion) | 14.2 | 15.0 | 25.9 |
| Treated industrial process & blowdown effluent (billion m3) | 185.0 to 205.0 | 195.0 to 216.0 | 320.0 to 355.0 |
| Active specialty chemical volume (million metric tons) | 6.8 to 7.4 | 7.2 to 7.8 | 11.8 to 13.0 |
| Average chemical spend per 1,000 m3 industrial effluent (USD) | 69.5 to 76.8 | 70.0 to 77.2 | 73.0 to 80.9 |
Operational note: Industrial effluent ranges reflect multi-stage dosing combining 28 to 115 ppm primary coagulants and emulsion breakers with 4.5 to 19.5 ppm scale inhibitors, biocides, and heavy-metal precipitants.
High-salinity produced water in oilfields and concentrated brine streams in industrial zero-liquid-discharge (ZLD) evaporators require thermally stable polymeric dispersants that prevent calcium carbonate and iron oxide deposition. Technical product documentation released by Nouryon in October 2026 details how Versa-TL 4 sulfonated styrene maleic acid copolymer disperses iron oxides and inhibits scale in industrial cooling and oilfield injection water systems at low feed levels [4]. Refinery and petrochemical engineers pair these copolymer dispersants with oilfield scale inhibitors to keep membrane skids and brine concentrators running without acid cleaning shutdowns.
Refinery & Closed-Loop Reuse Dosing Sizing
Table 3: Refinery and Closed-Loop Reuse Spending Indicators for the Industrial Wastewater Treatment Chemical Market (USD and dosage ranges), 2025 to 2036
| Metric | 2025 | 2026 | 2036 |
|---|---|---|---|
| Refinery DAF & API separator coagulant/polymer dose (ppm) | 25.0 to 110.0 | 28.0 to 115.0 | 35.0 to 135.0 |
| RO & thermal ZLD antiscalant and biocide dose (ppm) | 4.0 to 18.0 | 4.5 to 19.5 | 6.0 to 24.0 |
| Annual chemical spend per integrated refinery/petrochemical site (USD million) | 2.8 to 4.2 | 3.0 to 4.5 | 4.9 to 7.2 |
| Zero-liquid-discharge & closed-loop reuse chemical share (%) | 28.0% to 32.0% | 30.0% to 34.0% | 46.0% to 52.0% |
Table 4: Industrial Capex & Service Channel Spending Indicators for the Industrial Wastewater Treatment Chemical Market (USD and institutional basis), 2026
| Metric | Value | Institutional Reference Basis |
|---|---|---|
| Market size, 2026 | USD 15.0 billion | 2026 global valuation baseline |
| Canadian mining, oil & gas 2026 capital expenditure | CAD 65.3 billion (+6.8%) | Statistics Canada Capex Release (February 2026) |
| BASF sustainable water management achievement, 2025 | 73.0% of Verbund & water-stress sites | BASF Consolidated Sustainability Statement (Feb 2026) |
| Integrated Chemical & Digital Dosing revenue, 2026 | USD 8.55 billion | 57.0% service mode allocation |
Multinational chemical and manufacturing groups are systematically auditing production sites in water-stressed river basins and installing tertiary wastewater reuse trains to cut municipal freshwater intake. Corporate environmental disclosures in BASF SE's February 2026 E3 Water Sustainability Statement show that BASF achieved 73% of its sustainable water management target across Verbund and water-stress sites covering 90% of total group water withdrawal (up from 65% in 2024 after adding 11 sites in 2025) [5]. Closed-loop operation of recycled effluent trains without biofouling requires continuous dosing of oxidizing and non-oxidizing industrial biocides ahead of ultrafiltration and reverse osmosis cartridges.
Analyst Perspective
"Industrial plant managers do not buy wastewater chemicals to treat discharge for the river anymore; they buy guaranteed feedwater quality so treated effluent can go straight back into cooling towers and high-pressure boilers. Suppliers that bundle oil-water emulsion breakers, non-phosphorus antiscalants, and heavy-metal precipitants with automated optical dosing controllers will capture the highest-margin service contracts through 2036."
- Nikhil Kaitwade, Principal Consultant, Future Market Insights.
How is the industrial wastewater treatment chemical market segmented?
The industrial wastewater treatment chemical market is segmented by chemical function, end-use industry, treatment stage, delivery format, and service mode. In 2026, Coagulants and Flocculants are projected at 36.0%, Oil and Gas Refining and Petrochemicals at 42.0%, Primary Mechanical Separation and Clarification at 58.0%, Bulk Liquid Concentrates and Emulsions at 53.0%, and Integrated Chemical and Digital Dosing Contracts at 57.0%.
By chemical function: Coagulants and Flocculants as well as Scale and Corrosion Inhibitors, followed by Biocides and Disinfectants along with Antifoams and Heavy Metal Precipitants.
By end-use industry: Petroleum Refining and Petrochemicals as well as Power Generation Cooling Water, with further demand in Chemical and Fertilizer Manufacturing along with Pulp and Paper and Mineral Smelting.
By treatment stage: Primary Mechanical Separation and Clarification and Secondary Biological Sludge Dewatering; additional stages comprise Tertiary Polishing Reverse Osmosis Membrane Protection and Zero Liquid Discharge Brine Conditioning.
By delivery format: Bulk Liquid Concentrates and Emulsions and Dry Powders and Granules; remaining formats include Solid Dissolving Cartridges and Blocks and Pre-Blended Drum Formulations.
By service mode: Integrated Chemical and Digital Dosing Contracts and Merchant Bulk Chemical Supply; other modes cover Specialty Water Treatment Distributors and Equipment-Bundled Chemical Agreements.
Why do Coagulants and Flocculants lead the chemical function category?
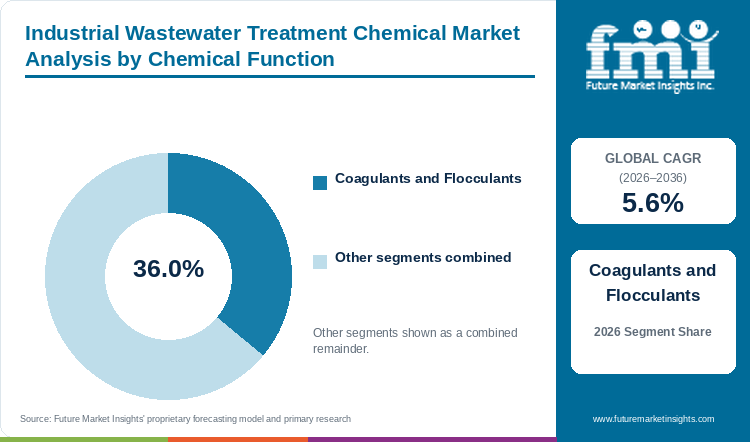
Coagulants and Flocculants hold an estimated 36.0% of chemical function demand in 2026, anchored by high-tonnage suspended-solids and emulsified-oil separation.
Table 5: Chemical Function Share for the Industrial Wastewater Treatment Chemical Market (percentage share), 2026
| Chemical Function | Share (2026) |
|---|---|
| Coagulants and Flocculants | 36.0% |
| Other Segments Combined | 64.0%* |
| Total | 100.0% |
*Note: Remaining chemical function categories account for the balance of 2026 global industrial wastewater treatment chemical demand.
Table 6: Chemical Function Leadership and Market Growth for the Industrial Wastewater Treatment Chemical Market (segment and CAGR percentage), 2026 to 2036
| Metric | Value |
|---|---|
| Global CAGR (2026 to 2036) | 5.6% |
| Leading Segment | Coagulants and Flocculants |
Coagulants and flocculants represent the largest chemical function segment in industrial wastewater treatment since primary suspended solids, colloidal clays, and emulsified hydrocarbons must be flocculated and removed before any downstream biological or membrane stage can operate. Refineries and mines as well as food plants dose polyaluminum chloride, ferric sulfate, and high-molecular-weight polyacrylamide from flocculant and coagulant solutions providers in bulk tonnage across every shift. Experimental research by Qiao et al. published in MDPI Minerals in December 2025 confirms why tailored polymer selection is critical in heavy industry, demonstrating that 10 to 12 million g/mol anionic polyacrylamide at an 80 g/t dosage maximized settling velocity and supernatant clarity in fine iron tailing slurry dewatering [6].
- Within the chemical function segment, Coagulants and Flocculants are projected to account for a leading 36.0% share in 2026, driven by continuous bulk dosing across primary clarifiers and sludge centrifuges.
- Scale and corrosion inhibitors paired with organosulfur heavy-metal precipitants are anticipated to record faster value growth through 2036 as factories install tertiary reverse osmosis and zero-liquid-discharge loops.
What sustains Oil and Gas Refining and Petrochemicals leadership in the end-use industry segment?
Oil and Gas Refining and Petrochemicals represent 42.0% of the end-use industry category in 2026, supported by desalter brine, sour water, and produced water treatment.
Oil and gas refineries, upstream produced-water facilities, and integrated petrochemical cracker complexes anchor global industrial wastewater chemical expenditure due to the extreme complexity of hydrocarbon-contaminated effluents. Crude desalters and fluid catalytic crackers generate sour water laden with emulsified oils and sulfides that require sequential dosing of reverse demulsifiers and cationic polyquaternaries paired with oilfield production chemicals. Tight selenium, benzene, and total dissolved solids discharge limits make refinery wastewater treatment highly chemical-intensive despite capital discipline across mature refining basins.
- In 2026, Oil and Gas Refining and Petrochemicals is anticipated to capture 42.0% of end-use industry demand, reflecting multi-stage chemical consumption across desalter and DAF trains.
- Corporate sustainability disclosures released by Baker Hughes in April 2026 reinforce this operational focus, documenting a 36.9% absolute Scope 1 and 2 emissions reduction paired with a 29.0% cut in total industrial waste generated and 61,270 metric tons of recovered materials in 2025 [7].
How does Primary Mechanical Separation and Clarification lead the treatment stage category?
Primary Mechanical Separation and Clarification accounts for 58.0% of treatment stage demand in 2026, driven by continuous chemical dosing across API separators, DAF units, and primary clarifiers.
Primary mechanical separation and clarification leads treatment stage expenditure since 100% of raw factory effluent passes through headworks, API oil-water separators, and dissolved air flotation (DAF) cells at high chemical dosages of 30 to 150 parts per million. Unless primary coagulation and precipitation strip free oils and multivalent metal hydroxides upfront, biological activated-sludge bacteria suffer toxicity shocks and downstream polymeric filtration membranes foul irreversibly. A global review by Nemeș et al. published in the International Journal of Molecular Sciences in February 2026 substantiates this stage hierarchy, documenting how chemical hydroxide and sulfide precipitation paired with coagulation-flocculation remains the foundational industrial barrier for heavy-metal ion removal [8].
- By treatment stage, demand for Primary Mechanical Separation and Clarification is estimated to reach 58.0% of total category share in 2026 on account of high-ppm coagulant and emulsion-breaker dosing across full plant flow.
- Tertiary polishing and reverse osmosis membrane protection is forecast to expand at the fastest rate through 2036 as zero-liquid-discharge mandates require phosphonate-free antiscalants and non-oxidizing biocides.
Why do Bulk Liquid Concentrates and Emulsions lead the delivery format category?
Bulk Liquid Concentrates and Emulsions secure 53.0% of delivery format demand in 2026, supported by automated metering pumps and zero-dust handling in hazardous industrial zones.
Bulk liquid concentrates and inverse liquid emulsions account for the majority of industrial wastewater chemical deliveries since automated refineries, power plants, and chemical complexes meter liquid products directly from tote bins or bulk storage tanks using explosion-proof diaphragm pumps. Compared with municipal sewage plants that employ dedicated operators to make down dry polymer bags, industrial process units favor ready-to-feed liquid coagulants and fast-inverting polyacrylamide emulsions that eliminate combustible polymer dust hazards. Although liquid freight costs are higher per ton than dry powders, localized chemical blending plants near major industrial corridors keep bulk liquid delivery cost-competitive.
- Automated closed-loop chemical feed across hazardous industrial plants places Bulk Liquid Concentrates and Emulsions on course to hold an estimated 53.0% share of the delivery format category in 2026.
- Regional manufacturing investments support localized liquid supply, as seen when Buckman Laboratories and Atul Ltd. announced a joint venture in August 2025 to manufacture industrial water treatment chemicals across chemical, power, and textile sectors in India and Sri Lanka [9].
What gives Integrated Chemical and Digital Dosing Contracts the leading position in service mode?
Integrated Chemical and Digital Dosing Contracts command 57.0% of service mode share in 2026, anchored by real-time optical sensors and guaranteed effluent compliance.
Industrial manufacturing plants actively procure wastewater treatment chemicals through integrated service contracts that bundle specialty formulations with inline fluorescent tracers and remote telemetry rather than buying commodity drums on the spot market. Since influent wastewater composition fluctuates hour by hour during batch chemical washes or refinery crude switches, automated dosing controllers prevent both costly chemical overdosing and environmental permit violations. Suppliers are expanding high-tech service capabilities through targeted acquisitions, as Ecolab Inc. completed its purchase of the Ovivo semiconductor ultrapure water division in December 2025 to combine circular wafer-fab water engineering with Nalco Water digital chemistry [10].
- Integrated Chemical and Digital Dosing Contracts are predicted to secure 57.0% of service mode demand in 2026, supported by automated 24-hour feed control and vendor-guaranteed effluent compliance.
- Mid-sized food, beverage, and metal-finishing factories are projected to accelerate adoption of sensor-bundled chemical agreements through 2036 to offset shortages of licensed on-site wastewater operators.
What are the drivers, restraints, and opportunities in the industrial wastewater treatment chemical market?
In the industrial wastewater treatment chemical market, zero-liquid-discharge mandates and rising industrial freshwater tariffs are projected to drive adoption whereas specialty monomer and phosphonate cost inflation restrains fixed-rate service margins and PFAS-selective precipitants and non-phosphorus antiscalants create new revenue avenues.
- Driver: Industrial freshwater scarcity, rising municipal sewer surcharges, and zero-liquid-discharge permits force factories to dose multi-stage clarification and membrane reuse chemistries.
- Restraint: Raw material cost inflation across yellow phosphorus and acrylic acid as well as energy-intensive chlor-alkali derivatives pressures margins on multi-year fixed-fee service contracts.
- Opportunity: Replacing phosphorus-based scale inhibitors and silicone defoamers with biodegradable polyaspartates, green chelants, and PFAS-selective precipitants opens new high-margin industrial accounts.
Growth Analysis and Future Potential: Qualitative Demand Catalysts
Higher freshwater abstraction fees and mandatory industrial water recycling targets across arid manufacturing basins are compelling refineries, power generators, and electronics fabs to convert once-through effluent drains into closed-loop water reclamation plants. Every cubic meter of industrial wastewater routed through tertiary ultrafiltration and reverse osmosis requires coordinated dosing of primary coagulants and sustainable antifoam agents as well as non-oxidizing biocides and silica antiscalants. Industry policy initiatives published by Veolia's Stakeholders Assembly in June 2026 reinforce this economic shift, introducing an open-source 'cost of no water' financial risk calculator to accelerate industrial and municipal water reuse commitments [11].
Risk Assessment of the Industrial Wastewater Treatment Chemical Market: Operational and Formulation Friction
Sharp swings in wholesale energy and petrochemical feedstock prices directly inflate the production cost of phosphonate scale inhibitors and quaternary ammonium biocides as well as acrylamide polymers, forcing suppliers to build greater scale across middle-market industrial accounts. When industrial water service providers lock in fixed annual fee-for-service contracts with power plants or paper mills paired with water treatment systems, sudden raw material surges compress supplier operating margins until contract indexation clauses trigger. Corporate consolidation reflects this push for scale and supply-chain resilience, as Solenis closed its buyout of NCH Corporation on November 3, 2025 to operate across 78 global manufacturing facilities and over 160 countries [12].
Commercial Opportunity Analysis: Formulation Differentiation and Value-Add Formats
Regulatory crackdowns on per- and polyfluoroalkyl substances (PFAS) and trace heavy metals as well as phosphorus discharges are creating lucrative demand for selective chemical precipitants and biodegradable green chelants. Rather than relying on orthophosphate inhibitors that trigger algal blooms or conventional hydroxide precipitation that leaves chelated metals in solution, factories specify organosulfur scavengers and advanced membrane separation technologies pretreatment. Strategic corporate investments validate this opportunity, as Kurita Water Industries announced in its May 2026 Global Water Awards release that it invested in U.S. adsorbent specialist Cyclopure in April 2026 to accelerate DEXSORB PFAS removal and Evove direct lithium extraction [13].
Industrial Wastewater Treatment Chemical Market by Country (2026 to 2036)
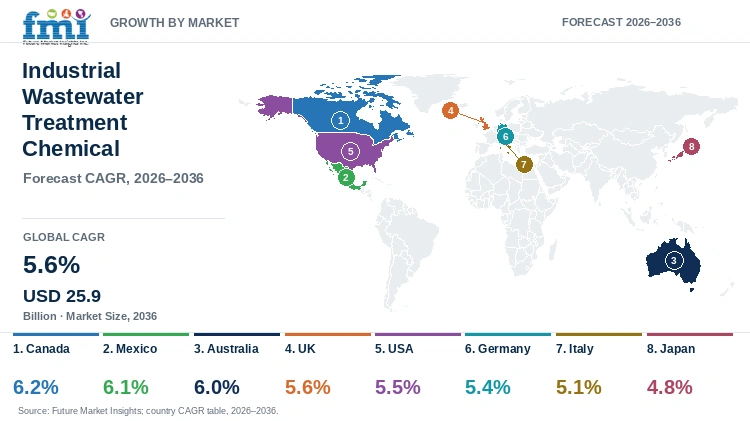
FMI country modeling indicates that Canada leads industrial wastewater treatment chemical expansion at a 6.2% CAGR through 2036, while Mexico follows at 6.1% ahead of Australia at 6.0% and the UK at 5.6%. National demand trajectories reflect oil-sands and mining capex, nearshored manufacturing compliance, and industrial effluent reuse mandates.
Table 7: Country CAGR and Primary Growth Levers for the Industrial Wastewater Treatment Chemical Market (CAGR percentage and operational drivers), 2026 to 2036
| Country | CAGR (2026 to 2036) | Primary Growth Lever |
|---|---|---|
| Canada | 6.2% | CAD 65.3B oil-sands, gold mining, and utility capital expenditure and tailings water reuse |
| Mexico | 6.1% | NOM-001-SEMARNAT-2021 COD and toxicity enforcement across nearshored manufacturing parks |
| Australia | 6.0% | Hard-rock lithium and iron ore tailings dewatering plus data-center cooling water reuse |
| UK | 5.6% | GBP 104B PR24 water-sector investment and strict industrial trade-effluent phosphorus limits |
| USA | 5.5% | EPA steam-electric power, refinery, and semiconductor PFAS and heavy-metal effluent rules |
| Germany | 5.4% | Chemical park closed-loop cooling blowdown recycling and zero-liquid-discharge evaporators |
| Italy | 5.1% | Textile, tannery, and food-processing effluent recycling across northern industrial districts |
| Japan | 4.8% | Semiconductor ultrapure wastewater reclamation and Kansai hydrogen/chemical hub recycling |
Source: Future Market Insights analysis
Canada Industrial Wastewater Treatment Chemical Market Outlook (2026 to 2036)
Demand for industrial wastewater treatment chemicals in Canada is projected to expand at a leading 6.2% CAGR between 2026 and 2036 as oil-sands steam-assisted gravity drainage (SAGD) facilities, gold and potash mines, and pulp mills invest in water recycling and tailings remediation. What distinguishes Canada from other mature Western markets is the massive volume of warm produced water and oil-sands tailings that must be deoiled, softened, and treated with silica dispersants and anionic polymers to achieve over 90% steam-generation water recycle. Regulatory tracking under Statistics Canada's August 2025 Annual Environmental Protection Expenditures Survey documents sustained corporate capital and operating outlays on industrial wastewater management and pollution abatement across Canadian resource sectors [14]. Federal Metal and Diamond Mining Effluent Regulations (MDMER) also compel Canadian base-metal concentrators to dose heavy-metal precipitants and coagulants before discharging to sub-arctic watersheds.
Key takeaway: In Canada, oil-sands produced-water recycling and base-metal mining capex as well as strict effluent rules are projected to drive a leading 6.2% CAGR.
Mexico Industrial Wastewater Treatment Chemical Market Outlook (2026 to 2036)
Mexico's automotive and electronics manufacturing corridors across Nuevo León and Coahuila as well as Bajío are undergoing rapid conversion toward on-site wastewater reclamation and tertiary polishing. Consequently, national industrial wastewater treatment chemical adoption is anticipated to advance at a 6.1% CAGR through 2036, supported by nearshored factory openings and severe municipal water rationing in northern industrial states. Official bulletins from Mexico's Comisión Nacional del Agua (CONAGUA) in June 2026 (Comunicado No. 087-26) confirm over MXN 25 million in treatment plant rehabilitation and disinfection upgrades across four plants in Mérida to enforce the stricter NOM-001-SEMARNAT-2021 wastewater discharge standard [15]. To meet NOM-001-SEMARNAT-2021 color and toxicity thresholds while securing reliable process water in Monterrey and Saltillo, industrial parks routinely contract for turnkey coagulant and RO biocide programs.
Key takeaway: In Mexico, NOM-001-SEMARNAT-2021 COD and toxicity enforcement combined with northern industrial water scarcity are anticipated to sustain a 6.1% CAGR.
Australia Industrial Wastewater Treatment Chemical Market Outlook (2026 to 2036)
In Australia, market growth is forecast to reach a 6.0% CAGR from 2026 to 2036, anchored by hard-rock lithium and iron ore concentrators in Western Australia and Queensland paired with booming hyperscale data-center cooling infrastructure in Sydney and Melbourne. Compared with European river-discharge markets, Australian mineral processors and industrial estates operate under arid-climate zero-discharge permits that require high-rate paste thickener flocculants and hypersaline reverse osmosis antiscalants. Economic spotlight statistics released by the Australian Bureau of Statistics in February 2026 show that capital expenditure intentions in the Information, Media, and Telecommunications sector hit AUD 20.1 billion for 2026-27 (up 74.9%) on rapid data-center construction and cooling fit-outs [16]. Evaporative cooling towers and industrial brine concentrators across Australia consequently generate strong demand for high-temperature polymeric scale inhibitors and non-oxidizing biocides.
Key takeaway: In Australia, mineral tailings water recovery and surging data-center cooling infrastructure are forecast to drive a 6.0% CAGR through 2036.
UK Industrial Wastewater Treatment Chemical Market Outlook (2026 to 2036)
Expenditure on industrial wastewater treatment chemicals in the UK is estimated to grow at a 5.6% CAGR between 2026 and 2036 across food and beverage processors, pharmaceutical plants, and utility trade-effluent works. What sets the UK apart from continental Europe is the historic GBP 104 billion PR24 water-sector regulatory settlement and strict Environment Agency phosphorus and storm-overflow enforcement, which directly raises trade-effluent charges (Mogden formula fees) levied on British factories discharging to public sewers. Policy reforms detailed in the UK Government's February 2026 'A New Vision for Water' White Paper confirm nearly GBP 5 billion in dedicated wastewater treatment upgrades paired with tighter industrial pollution monitoring [17]. To avoid escalating water-company trade-effluent bills, British food and brewing plants are installing on-site DAF clarification and anaerobic digestate dewatering skids dosed with ferric salts and cationic emulsions.
Key takeaway: In the UK, rising Mogden trade-effluent sewer charges and GBP 104 billion PR24 regulatory enforcement are estimated to sustain a 5.6% CAGR.
USA Industrial Wastewater Treatment Chemical Market Outlook (2026 to 2036)
Commercial industrial wastewater treatment chemical demand in the USA is anticipated to progress at a 5.5% CAGR over the 2026 to 2036 window across Gulf Coast refineries, Midwest food and power plants, and Southwest semiconductor fabs. In contrast to markets driven primarily by basic suspended-solids removal, U.S. industrial demand is driven by U.S. EPA Effluent Limitations Guidelines (ELGs) for steam-electric power flue-gas desulfurization (FGD) wastewater, trace selenium and mercury precipitation, and PFAS destruction. Corporate impact disclosures released by Ecolab Inc. in May 2026 show how North American and global industrial customers conserved 245 billion gallons of water across 40 industries in 2025 by deploying automated Nalco Water treatment and recycling programs [18]. Domestic expansion of semiconductor wafer fabrication in Arizona, Texas, and Ohio further expands high-margin contracts for ultrapure wastewater reclamation and fluoride precipitation chemistries.
Key takeaway: In the USA, EPA power and refinery effluent rules paired with semiconductor fab water reclamation are anticipated to anchor a 5.5% CAGR.
Germany Industrial Wastewater Treatment Chemical Market Outlook (2026 to 2036)
German industrial wastewater treatment chemical revenue is slated to expand at a 5.4% CAGR across the 2026 to 2036 horizon within integrated Verbund chemical parks, automotive surface-treatment lines, and paper and food factories. Germany diverges from global baseline practices through its strict Abwasserverordnung (Wastewater Ordinance) sector annexes and high industrial freshwater and wastewater discharge fees, which push chemical parks along the Rhine and Main rivers to maximize internal cooling and process water cascades. Active M&A confirms sustained investment in German water chemistry, as Kemira Oyj closed its purchase of German coagulant manufacturer SIDRA Wasserchemie in October 2026 to add two German production plants with EUR 40 million in 2025 revenue serving industrial and municipal buyers [19]. German automotive electroplating and battery-material plants also specify advanced organosulfur heavy-metal precipitants and non-phosphorus biodegradable scale inhibitors to comply with strict river-basin discharge limits.
Key takeaway: In Germany, Verbund chemical-park water cascading and strict Abwasserverordnung heavy-metal limits are slated to support a 5.4% CAGR.
Italy Industrial Wastewater Treatment Chemical Market Outlook (2026 to 2036)
Sales of industrial wastewater treatment chemicals in Italy are expected to climb at a 5.1% CAGR through 2036 across Lombardy, Veneto, and Emilia-Romagna manufacturing districts. Compared with heavy mining economies, Italian industrial effluent demand is concentrated in specialized district consortia treating high-color textile dyeing and leather tanning as well as Mediterranean food-processing wastewaters. Statistical focus reports published by the Italian National Institute of Statistics (Istat) in March 2026 show that Italy's wastewater management industry generated EUR 14.2 billion in value (95% of the EUR 15 billion water sector) while corporations funded 71% of Italy's EUR 13.5 billion national wastewater expenditure [20]. Leather tanneries in Veneto and Tuscany and textile mills in Prato and Como rely heavily on ferric chloride, polyaluminum chloride, and specialty decolorizing polyamine coagulants to meet consortium discharge limits.
Key takeaway: In Italy, corporate wastewater expenditure (71% of national spend) across textile and leather-tanning districts is expected to drive a 5.1% CAGR.
Japan Industrial Wastewater Treatment Chemical Market Outlook (2026 to 2036)
Japanese industrial wastewater treatment chemical sales are predicted to advance at a 4.8% CAGR from 2026 through 2036 across semiconductor wafer fabs, hydrogen and chemical complexes, and electronics assembly plants. What distinguishes Japan is its world-leading industrial water recovery rate (exceeding 78% in manufacturing) and rapid transition toward automated, remote-monitored chemical dosing that compensates for an aging plant engineering workforce. Regional industrial roadmaps published by the Kansai Bureau of the Ministry of Economy, Trade and Industry in April 2026 document growing smart-energy and hydrogen-hub chemical infrastructure investments across Sakai and Himeji coastal industrial zones [21]. Semiconductor foundry expansions in Kumamoto and Hokkaido also generate premium demand for calcium fluoride crystallization aids, hydrogen peroxide decomposition catalysts, and low-TOC membrane antiscalants.
Key takeaway: In Japan, semiconductor foundry water reclamation and automated remote-monitored dosing programs are predicted to sustain a 4.8% CAGR.
Full report country CAGRs cover: North America; Latin America; Western Europe; Eastern Europe; East Asia; South Asia and Pacific; Middle East and Africa.
Who are the notable companies in the industrial wastewater treatment chemical market?
Ecolab Inc. (Nalco Water), Veolia Water Technologies & Solutions, Kemira Oyj, Kurita Water Industries Ltd., Baker Hughes Company, Buckman Laboratories International, Inc., Solenis International LLC, SNF Group, ChemTreat, Inc. (Veralto Corporation), and Nouryon Chemicals Holding B.V. are the notable companies in the industrial wastewater treatment chemical market.
Competitive positioning in the industrial effluent chemicals industry separates full-service digital water management leaders, integrated coagulant and specialty polymer manufacturers, and downstream oilfield and specialty chemical formulators. Ecolab and Veolia along with Kurita and ChemTreat combine custom chemical formulations with inline optical sensors and on-site service engineers. Kemira and Solenis along with SNF and Buckman anchor global coagulant and biocide manufacturing, while Baker Hughes and Nouryon supply specialized refinery demulsifiers and polymeric scale dispersants.
- Full-Service Industrial Water and Digital Dosing Leaders: Nalco Water (Ecolab) and Veolia Water Technologies along with Kurita Water Industries and ChemTreat deliver integrated chemical programs paired with real-time telemetry and membrane reuse systems.
- Integrated Coagulant and Process Chemical Producers: Kemira Oyj and Solenis as well as SNF Group and Buckman manufacture bulk inorganic coagulants and polyacrylamide emulsions along with industrial biocides.
- Refinery, Produced-Water, and Specialty Dispersant Formulators: Baker Hughes Company and Nouryon Chemicals Holding B.V. engineer crude-unit demulsifiers and oily wastewater clarifiers as well as sulfonated copolymer scale inhibitors and biodegradable chelants.
Competitive Benchmarking: Industrial Wastewater Treatment Chemical Market
Table 8: Competitive Benchmarking for the Industrial Wastewater Treatment Chemical Market (qualitative capability ratings), 2026
| Company | Multi-Functional Chemistry | Refinery & Power Expertise | Digital Telemetry & Service | Geographic Reach |
|---|---|---|---|---|
| Ecolab Inc. (Nalco Water) | High | High | High | Global industrial water leader; closed Ovivo Electronics UPW acquisition in Dec 2025 |
| Veolia Water Technologies | High | High | High | Global Hydrex and MetClear portfolio; won USD 500M SATORP reuse contract in Sep 2025 |
| Kemira Oyj | High | Medium | High | Global coagulant, polymer, and pulp/industrial water network; acquired Water Engineering |
| Kurita Water Industries Ltd. | High | High | High | Global electronics, refinery, and PFAS treatment; formed Kurita Membrane India in June 2026 |
| Baker Hughes Company | Medium | High | High | Global downstream refinery and produced-water demulsifier and scale control programs |
| Buckman Laboratories | High | Medium | High | Global pulp, paper, leather, and chemical effluent treatment; August 2025 India JV with Atul |
| Solenis International LLC | High | Medium | High | 78 global plants across 160+ countries; integrated NCH industrial water business in Nov 2025 |
| SNF Group | Medium | High | Medium | Largest global manufacturer of polyacrylamide flocculants and polyamine coagulants |
| ChemTreat, Inc. (Veralto) | High | High | High | North and Latin American power, refinery, and data-center treatment; Veralto bought Cleanwater1 |
| Nouryon Chemicals Holding | High | High | Low | Global specialty chelants, Versa-TL copolymer dispersants, and quaternary biocides |
Evaluation basis: Multi-Functional Chemistry evaluates breadth across coagulants and scale inhibitors as well as heavy-metal precipitants, while Refinery & Power Expertise rates field credentials in sour water and FGD blowdown. Digital Telemetry & Service measures installed inline optical sensors (such as 3D TRASAR, InSight, or OPTIX) and on-site engineering teams.
Key Developments in the Industrial Wastewater Treatment Chemical Market
- Kurita Water Industries Ltd. reported in its July 31, 2026 President's Message that CSV (Creating Shared Value) water-saving and resource-recovery solutions reached JPY 58.5 billion in net sales in the fiscal year ended March 2026 along with a 14% business profit CAGR [22].
- Veralto Corporation (parent company of ChemTreat) signed a definitive agreement on August 19, 2026 to acquire water quality and odor-control provider Cleanwater1 for a net purchase price of USD 452 million [23].
- Veolia Environnement S.A. expanded its water and industrial circularity operations in India on February 26, 2026, securing two 15-year Mumbai treatment contracts (2,910 MLD) while operating Gujarat's first Zero Liquid Discharge plant in Ankleshwar and a 5 TPD carbon capture facility for Tata Steel [24].
Key Players in the Industrial Wastewater Treatment Chemical Market
Full-Service Industrial Water and Digital Dosing Leaders
- Ecolab Inc. (Nalco Water)
- Veolia Water Technologies & Solutions
- Kurita Water Industries Ltd.
- ChemTreat, Inc. (Veralto Corporation)
Integrated Coagulant, Flocculant, and Process Chemical Producers
- Kemira Oyj
- Solenis International LLC
- SNF Group
- Buckman Laboratories International, Inc.
Refinery, Produced-Water, and Specialty Dispersant Formulators
- Baker Hughes Company
- Nouryon Chemicals Holding B.V.
Industrial Wastewater Treatment Chemical Market - Report Scope
Table 9: Report Scope for the Industrial Wastewater Treatment Chemical Market (coverage fields and definitions), 2026 to 2036
| Coverage field | Report scope |
|---|---|
| Market breakdown | Chemical Function; End-Use Industry; Treatment Stage; Delivery Format; Service Mode |
| Quantitative Units | USD Billion |
| Market Definition | Includes commercial revenue from specialty and commodity chemicals dosed specifically in industrial process wastewater, cooling blowdown, and effluent recycling trains: coagulants and flocculants, scale and corrosion inhibitors, oxidizing and non-oxidizing biocides, antifoams and defoamers, pH adjusters and neutralizers, and heavy-metal precipitants (dithiocarbamates, trithiocarbonates, sulfides). Category Scope Note: Excludes municipal potable drinking water treatment, domestic municipal sewage works, standalone reverse osmosis membranes, and mechanical pumps. |
| Regions Covered | North America; Latin America; Western Europe; Eastern Europe; East Asia; South Asia and Pacific; Middle East and Africa |
| Countries Covered | Canada, Mexico, Australia, UK, USA, Germany, Italy, Japan, and additional countries in the full report |
| Key Companies Covered | Ecolab Inc. (Nalco Water), Veolia Water Technologies & Solutions, Kemira Oyj, Kurita Water Industries Ltd., Baker Hughes Company, Buckman Laboratories International, Inc., Solenis International LLC, SNF Group, ChemTreat, Inc. (Veralto Corporation), Nouryon Chemicals Holding B.V. |
| Forecast Period | 2026 to 2036 |
| Approach | Primary and secondary research with top-down and bottom-up market triangulation. |
Industrial Wastewater Treatment Chemical Market - Research Methodology
Table 10: Research Methodology for the Industrial Wastewater Treatment Chemical Market (research methods and approach), 2026 edition
| Method | Approach |
|---|---|
| Primary Research | Structured interviews with petroleum refinery environmental superintendents, power-plant cooling and FGD water chemists, semiconductor fab ultrapure reclamation managers, and chemical service directors to validate ppm dosing and cost per cubic meter. |
| Secondary Research | Analysis of Statistics Canada industrial capital and environmental expenditure surveys, CONAGUA NOM-001 compliance bulletins, UK Ofwat PR24 trade-effluent determinations, corporate sustainability reports, and peer-reviewed heavy-metal removal studies. |
| Market Sizing and Forecasting | Top-down global industrial water treatment baselines reconciled against bottom-up treated industrial effluent volumes (195B to 216B cubic meters in 2026) and multi-stage chemical spend per thousand cubic meters from 2026 to 2036. |
| Country Forecasting Model | Econometric country projections weight oil-and-gas and mining capital expenditure, nearshored manufacturing park buildouts, industrial freshwater tariffs, and zero-liquid-discharge permits across eight national markets. |
| Operational Benchmark Traceability | Industrial effluent volumes and chemical dosage indicators in Tables 2, 3, and 4 trace to Statistics Canada sector capex filings, BASF corporate water balance disclosures, and Nouryon and Baker Hughes technical bulletins. |
| Data Triangulation and Validation | Revenue estimates isolate chemical consumables and bundled chemical-service contracts across primary, secondary, and tertiary industrial wastewater trains while excluding municipal sewage works and mechanical hardware. |
Industrial Wastewater Treatment Chemical Market by Segments
Industrial Wastewater Treatment Chemical Market segmented by Chemical Function:
- Coagulants and Flocculants
- Scale and Corrosion Inhibitors
- Biocides and Disinfectants
- Antifoams and Defoaming Agents
Industrial Wastewater Treatment Chemical Market segmented by End-Use Industry:
- Oil and Gas Refining and Petrochemicals
- Power Generation Thermal and Nuclear Cooling Water
- Chemical and Fertilizer Manufacturing
- Pulp and Paper Mills
Industrial Wastewater Treatment Chemical Market segmented by Treatment Stage:
- Primary Mechanical Separation and Clarification
- Secondary Biological Sludge Dewatering
- Tertiary Polishing Reverse Osmosis Membrane Protection
- Zero Liquid Discharge Brine Conditioning
- Heavy Metal and Toxic Ion Precipitation
Industrial Wastewater Treatment Chemical Market segmented by Delivery Format:
- Bulk Liquid Concentrates and Emulsions
- Dry Powders and Granules
- Solid Dissolving Cartridges and Blocks
- Pre-Blended Drum Formulations
Industrial Wastewater Treatment Chemical Market segmented by Service Mode:
- Integrated Chemical and Digital Dosing Contracts
- Merchant Bulk Chemical Supply
- Specialty Water Treatment Distributors
- Equipment-Bundled Chemical Agreements
Industrial Wastewater Treatment Chemical Market by Region
- North America
- United States
- Canada
- Latin America
- Brazil
- Mexico
- Argentina
- Chile
- Western Europe
- Germany
- France
- United Kingdom
- Italy
- Spain
- Benelux
- Nordics
- Eastern Europe
- Poland
- Czech Republic
- Romania
- Hungary
- East Asia
- China
- Japan
- South Korea
- South Asia and Pacific
- India
- ASEAN
- Australia and New Zealand
- Middle East and Africa
- GCC Countries
- South Africa
- Türkiye
- Israel
Research Sources and Bibliography
- [1] Statistics Canada. (2026, February 25). Non-residential capital and repair expenditures, 2024 (revised), 2025 (preliminary) and 2026 (intentions). Government of Canada Statistics Canada.
- [2] Veolia Environnement S.A. (2025, September 15). Saudi Arabia: Veolia to supply best-in-class innovative technologies for the largest complex industrial water project in the Middle East for SATORP. Veolia Corporate Press Releases.
- [3] Water Services Regulation Authority (Ofwat). (2025, October 25). Water company performance report 2024-25. United Kingdom Government Ofwat.
- [4] Nouryon Chemicals Holding B.V. (2026, October 21). Product Data Sheet: Versa-TL 4 Sulfonated styrene maleic acid copolymer. Nouryon Technical Resource Library.
- [5] BASF SE. (2026, February 27). E3 Water: BASF Report 2025. BASF SE Corporate Reporting.
- [6] Qiao, X., Wang, K., Wang, J., He, J., & Bai, R. (2025, December 29). Study on Flocculant Selection for Fine Iron Tailing Slurry Based on Multi-Process Data Monitoring. MDPI Minerals, 16(1), 37.
- [7] Baker Hughes Company. (2026, April 28). Report: Baker Hughes Achieves 36.9% Absolute Reduction in Operational Greenhouse Gas Emissions. Baker Hughes Company Newsroom.
- [8] Nemeș, N. S., Negrea, A., Ciopec, M., Negrea, P., Duţeanu, N., & Duda-Seiman, D. M. (2026, February 11). Heavy Metal Ion Removal: A Global Review of Wastewater Treatment Technologies. International Journal of Molecular Sciences, 27(4), 1741 (PubMed Central PMC12940842).
- [9] Buckman Laboratories International, Inc. (2025, August 12). Buckman and Atul Announce Joint Venture to Provide Advanced Water Treatment Solutions in India and Sri Lanka. Buckman Corporate Newsroom.
- [10] Ecolab Inc. (2025, December 16). Ecolab Closes Acquisition of Ovivo's Electronics Ultrapure Water Business. Ecolab Corporate Newsroom.
- [11] Veolia Environnement S.A. (2026, June 5). Veolia's Stakeholders Assembly calls for accelerated uptake of water reuse to strengthen water security. Veolia Corporate Media Releases.
- [12] Solenis International LLC. (2025, November 3). Solenis Completes Acquisition of NCH Corporation. Solenis Corporate Newsroom.
- [13] Kurita Water Industries Ltd. (2026, May 26). Kurita Selected Distinction Award of Water Technology Company of the Year in Global Water Awards 2026. Kurita Water Industries Corporate Newsroom.
- [14] Statistics Canada. (2025, August 12). 2025 Annual Environmental Protection Expenditures Survey. Government of Canada Statistics Canada.
- [15] Comisión Nacional del Agua (CONAGUA). (2026, June 3). El Gobierno de México impulsa el saneamiento de aguas residuales en Yucatán, para mejorar condiciones hídricas y ambientales. Gobierno de México CONAGUA Prensa Comunicado No. 087-26.
- [16] Australian Bureau of Statistics. (2026, February 26). Spotlight: Data Centres in Economic Statistics. Commonwealth of Australia ABS.
- [17] Department for Environment, Food and Rural Affairs (DEFRA). (2026, February 19). A new vision for water. GOV.UK Official Publications.
- [18] Ecolab Inc. (2026, May 12). Ecolab Delivers Strong Performance and Impact. Ecolab Corporate News Releases.
- [19] Kemira Oyj. (2026, October 1). Kemira has completed the acquisition of SIDRA Wasserchemie. Kemira Oyj Corporate Releases.
- [20] Italian National Institute of Statistics (Istat). (2026, March 20). Water statistics: Years 2023-2025. Istat World Water Day 2026 Statistical Focus.
- [21] Ministry of Economy, Trade and Industry (METI) Kansai Bureau. (2026, April 2). Hydrogen Utilization Promotion Project Expanding from Kansai. Carbon Neutrality Promotion Office, Kansai Bureau of Economy, Trade and Industry.
- [22] Kurita Water Industries Ltd. (2026, July 31). Message from the President: Through Kurita Water Intelligence, we unlock the full potential of industry and deliver new and greater value to society. Kurita Water Industries Investor Relations.
- [23] Veralto Corporation. (2026, August 19). Veralto Signs Agreement to Acquire Cleanwater1. Veralto Investor Newsroom.
- [24] Veolia Environnement S.A. (2026, February 26). Veolia Strengthens Its Presence in India with two Unprecedent Mumbai Water Projects. Veolia Corporate Press Releases.
This bibliography is provided for reader reference and is not exhaustive. The full report contains the complete reference list and detailed citations.
This Report Answers
- How large is the industrial wastewater treatment chemical market in 2026 and what is forecast for 2036?
- Which zero-liquid-discharge mandates and refinery water-reuse pressures support demand for industrial treatment chemicals?
- Why do Coagulants and Flocculants lead the chemical function category?
- Why does Oil and Gas Refining and Petrochemicals lead the end-use industry category globally?
- How do growth rates differ across Canada and Mexico compared with Australia, the UK, and the USA?
- Which leading companies supply digital chemical-service programs versus merchant polymer and dispersant raw materials?
- What phosphonate, amine, and energy cost pressures restrain margins in the industrial wastewater treatment chemical market?
- What should industrial plant engineers evaluate before converting effluent trains to closed-loop reverse osmosis reuse?
Table of Content
Table of Content
- Key Takeaways
- Market Size and CAGR
- Top Growth Driver
- Fastest Growing Segment
- Leading Region
- Key Companies
- Emerging Opportunities
- Executive Summary
- Global Market Outlook
- Demand-side Trends
- Supply-side Trends
- Technology Roadmap Analysis
- Analysis and Recommendations
- Analyst Perspective (What is happening? Why now? What should investors know?)
- Key Questions Answered
- How large is the market?
- What is the CAGR?
- What are key trends?
- Which region dominates?
- Who are the leaders?
Read More...
- Market Overview
- Market Coverage / Taxonomy
- Market Definition / Scope / Limitations
- Research Methodology
- Chapter Orientation
- Analytical Lens and Working Hypotheses
- Market Structure, Signals, and Trend Drivers
- Benchmarking and Cross-market Comparability
- Market Sizing, Forecasting, and Opportunity Mapping
- Research Design and Evidence Framework
- Desk Research Programme (Secondary Evidence)
- Expert Input and Fieldwork (Primary Evidence)
- Tooling, Models, and Reference Databases
- Data Engineering and Model Build
- Quality Assurance and Audit Trail
- Market Background
- Market Dynamics (Drivers, Restraints, Opportunity, Trends)
- Scenario Forecast (Optimistic, Likely, Conservative)
- Impact Analysis
- AI Impact
- Sustainability Impact
- Regulatory Impact
- Technology Impact
- Consumer / Buyer Analysis
- Purchase Drivers
- Adoption Barriers
- Buyer Journey
- Opportunity Map Analysis
- Product Life Cycle Analysis
- Supply Chain Analysis
- Investment Feasibility Matrix
- Value Chain Analysis
- PESTLE and Porter's Analysis
- Regulatory Landscape
- Regional Parent Market Outlook
- Production and Consumption Statistics
- Import and Export Statistics
- Global Market Analysis and Forecast, 2021 to 2036
- Historical Market Size Value (USD Billion) Analysis, 2021 to 2025
- Current and Future Market Size Value (USD Billion) Projections, 2026 to 2036
- Y-o-Y Growth Trend Analysis
- Absolute $ Opportunity Analysis
- Global Market Pricing Analysis, 2021 to 2036
- Global Market Analysis and Forecast, By Chemical Function, 2021 to 2036
- Introduction / Key Findings
- Historical Market Size Value (USD Billion) Analysis By Chemical Function, 2021 to 2025
- Current and Future Market Size Value (USD Billion) Analysis and Forecast By Chemical Function, 2026 to 2036
- Coagulants and Flocculants
- Scale and Corrosion Inhibitors
- Biocides and Disinfectants
- Antifoams and Defoaming Agents
- Y-o-Y Growth Trend Analysis By Chemical Function, 2021 to 2025
- Absolute $ Opportunity Analysis By Chemical Function, 2026 to 2036
- Global Market Analysis and Forecast, By End-Use Industry, 2021 to 2036
- Introduction / Key Findings
- Historical Market Size Value (USD Billion) Analysis By End-Use Industry, 2021 to 2025
- Current and Future Market Size Value (USD Billion) Analysis and Forecast By End-Use Industry, 2026 to 2036
- Oil and Gas Refining and Petrochemicals
- Power Generation Thermal and Nuclear Cooling Water
- Chemical and Fertilizer Manufacturing
- Pulp and Paper Mills
- Y-o-Y Growth Trend Analysis By End-Use Industry, 2021 to 2025
- Absolute $ Opportunity Analysis By End-Use Industry, 2026 to 2036
- Global Market Analysis and Forecast, By Treatment Stage, 2021 to 2036
- Introduction / Key Findings
- Historical Market Size Value (USD Billion) Analysis By Treatment Stage, 2021 to 2025
- Current and Future Market Size Value (USD Billion) Analysis and Forecast By Treatment Stage, 2026 to 2036
- Primary Mechanical Separation and Clarification
- Secondary Biological Sludge Dewatering
- Tertiary Polishing Reverse Osmosis Membrane Protection
- Zero Liquid Discharge Brine Conditioning
- Heavy Metal and Toxic Ion Precipitation
- Y-o-Y Growth Trend Analysis By Treatment Stage, 2021 to 2025
- Absolute $ Opportunity Analysis By Treatment Stage, 2026 to 2036
- Global Market Analysis and Forecast, By Delivery Format, 2021 to 2036
- Introduction / Key Findings
- Historical Market Size Value (USD Billion) Analysis By Delivery Format, 2021 to 2025
- Current and Future Market Size Value (USD Billion) Analysis and Forecast By Delivery Format, 2026 to 2036
- Bulk Liquid Concentrates and Emulsions
- Dry Powders and Granules
- Solid Dissolving Cartridges and Blocks
- Pre-Blended Drum Formulations
- Y-o-Y Growth Trend Analysis By Delivery Format, 2021 to 2025
- Absolute $ Opportunity Analysis By Delivery Format, 2026 to 2036
- Global Market Analysis and Forecast, By Service Mode, 2021 to 2036
- Introduction / Key Findings
- Historical Market Size Value (USD Billion) Analysis By Service Mode, 2021 to 2025
- Current and Future Market Size Value (USD Billion) Analysis and Forecast By Service Mode, 2026 to 2036
- Integrated Chemical and Digital Dosing Contracts
- Merchant Bulk Chemical Supply
- Specialty Water Treatment Distributors
- Equipment-Bundled Chemical Agreements
- Y-o-Y Growth Trend Analysis By Service Mode, 2021 to 2025
- Absolute $ Opportunity Analysis By Service Mode, 2026 to 2036
- Global Market Analysis and Forecast, By Region, 2021 to 2036
- Introduction
- Historical Market Size Value (USD Billion) Analysis By Region, 2021 to 2025
- Current Market Size Value (USD Billion) Analysis and Forecast By Region, 2026 to 2036
- North America
- Latin America
- Western Europe
- Eastern Europe
- East Asia
- South Asia and Pacific
- Middle East and Africa
- Market Attractiveness Analysis By Region
- North America Market Analysis and Forecast, By Country, 2021 to 2036
- Historical Market Size Value (USD Billion) Trend Analysis By Market Taxonomy, 2021 to 2025
- Market Size Value (USD Billion) Forecast By Market Taxonomy, 2026 to 2036
- By Country
- United States
- Canada
- By Chemical Function
- By End-Use Industry
- By Treatment Stage
- By Delivery Format
- By Service Mode
- By Country
- Market Attractiveness Analysis
- By Country
- By Chemical Function
- By End-Use Industry
- By Treatment Stage
- By Delivery Format
- By Service Mode
- Key Takeaways
- Latin America Market Analysis and Forecast, By Country
- Historical Market Size Value (USD Billion) Trend Analysis By Market Taxonomy, 2021 to 2025
- Market Size Value (USD Billion) Forecast By Market Taxonomy, 2026 to 2036
- By Country
- Brazil
- Mexico
- Argentina
- Chile
- By Chemical Function
- By End-Use Industry
- By Treatment Stage
- By Delivery Format
- By Service Mode
- By Country
- Market Attractiveness Analysis
- By Country
- By Chemical Function
- By End-Use Industry
- By Treatment Stage
- By Delivery Format
- By Service Mode
- Key Takeaways
- Western Europe Market Analysis and Forecast, By Country
- Historical Market Size Value (USD Billion) Trend Analysis By Market Taxonomy, 2021 to 2025
- Market Size Value (USD Billion) Forecast By Market Taxonomy, 2026 to 2036
- By Country
- Germany
- France
- United Kingdom
- Italy
- Spain
- Benelux
- Nordics
- By Chemical Function
- By End-Use Industry
- By Treatment Stage
- By Delivery Format
- By Service Mode
- By Country
- Market Attractiveness Analysis
- By Country
- By Chemical Function
- By End-Use Industry
- By Treatment Stage
- By Delivery Format
- By Service Mode
- Key Takeaways
- Eastern Europe Market Analysis and Forecast, By Country
- Historical Market Size Value (USD Billion) Trend Analysis By Market Taxonomy, 2021 to 2025
- Market Size Value (USD Billion) Forecast By Market Taxonomy, 2026 to 2036
- By Country
- Poland
- Czech Republic
- Romania
- Hungary
- By Chemical Function
- By End-Use Industry
- By Treatment Stage
- By Delivery Format
- By Service Mode
- By Country
- Market Attractiveness Analysis
- By Country
- By Chemical Function
- By End-Use Industry
- By Treatment Stage
- By Delivery Format
- By Service Mode
- Key Takeaways
- East Asia Market Analysis and Forecast, By Country
- Historical Market Size Value (USD Billion) Trend Analysis By Market Taxonomy, 2021 to 2025
- Market Size Value (USD Billion) Forecast By Market Taxonomy, 2026 to 2036
- By Country
- China
- Japan
- South Korea
- By Chemical Function
- By End-Use Industry
- By Treatment Stage
- By Delivery Format
- By Service Mode
- By Country
- Market Attractiveness Analysis
- By Country
- By Chemical Function
- By End-Use Industry
- By Treatment Stage
- By Delivery Format
- By Service Mode
- Key Takeaways
- South Asia and Pacific Market Analysis and Forecast, By Country
- Historical Market Size Value (USD Billion) Trend Analysis By Market Taxonomy, 2021 to 2025
- Market Size Value (USD Billion) Forecast By Market Taxonomy, 2026 to 2036
- By Country
- India
- ASEAN
- Australia and New Zealand
- By Chemical Function
- By End-Use Industry
- By Treatment Stage
- By Delivery Format
- By Service Mode
- By Country
- Market Attractiveness Analysis
- By Country
- By Chemical Function
- By End-Use Industry
- By Treatment Stage
- By Delivery Format
- By Service Mode
- Key Takeaways
- Middle East and Africa Market Analysis and Forecast, By Country
- Historical Market Size Value (USD Billion) Trend Analysis By Market Taxonomy, 2021 to 2025
- Market Size Value (USD Billion) Forecast By Market Taxonomy, 2026 to 2036
- By Country
- GCC Countries
- South Africa
- Türkiye
- Israel
- By Chemical Function
- By End-Use Industry
- By Treatment Stage
- By Delivery Format
- By Service Mode
- By Country
- Market Attractiveness Analysis
- By Country
- By Chemical Function
- By End-Use Industry
- By Treatment Stage
- By Delivery Format
- By Service Mode
- Key Takeaways
- Key Countries Market Analysis
- United States
- Pricing Analysis
- Market Share Analysis, 2025
- By Chemical Function
- By End-Use Industry
- By Treatment Stage
- By Delivery Format
- By Service Mode
- Canada
- Pricing Analysis
- Market Share Analysis, 2025
- By Chemical Function
- By End-Use Industry
- By Treatment Stage
- By Delivery Format
- By Service Mode
- Mexico
- Pricing Analysis
- Market Share Analysis, 2025
- By Chemical Function
- By End-Use Industry
- By Treatment Stage
- By Delivery Format
- By Service Mode
- Brazil
- Pricing Analysis
- Market Share Analysis, 2025
- By Chemical Function
- By End-Use Industry
- By Treatment Stage
- By Delivery Format
- By Service Mode
- Chile
- Pricing Analysis
- Market Share Analysis, 2025
- By Chemical Function
- By End-Use Industry
- By Treatment Stage
- By Delivery Format
- By Service Mode
- Germany
- Pricing Analysis
- Market Share Analysis, 2025
- By Chemical Function
- By End-Use Industry
- By Treatment Stage
- By Delivery Format
- By Service Mode
- United Kingdom
- Pricing Analysis
- Market Share Analysis, 2025
- By Chemical Function
- By End-Use Industry
- By Treatment Stage
- By Delivery Format
- By Service Mode
- Italy
- Pricing Analysis
- Market Share Analysis, 2025
- By Chemical Function
- By End-Use Industry
- By Treatment Stage
- By Delivery Format
- By Service Mode
- Spain
- Pricing Analysis
- Market Share Analysis, 2025
- By Chemical Function
- By End-Use Industry
- By Treatment Stage
- By Delivery Format
- By Service Mode
- France
- Pricing Analysis
- Market Share Analysis, 2025
- By Chemical Function
- By End-Use Industry
- By Treatment Stage
- By Delivery Format
- By Service Mode
- India
- Pricing Analysis
- Market Share Analysis, 2025
- By Chemical Function
- By End-Use Industry
- By Treatment Stage
- By Delivery Format
- By Service Mode
- ASEAN
- Pricing Analysis
- Market Share Analysis, 2025
- By Chemical Function
- By End-Use Industry
- By Treatment Stage
- By Delivery Format
- By Service Mode
- Australia and New Zealand
- Pricing Analysis
- Market Share Analysis, 2025
- By Chemical Function
- By End-Use Industry
- By Treatment Stage
- By Delivery Format
- By Service Mode
- China
- Pricing Analysis
- Market Share Analysis, 2025
- By Chemical Function
- By End-Use Industry
- By Treatment Stage
- By Delivery Format
- By Service Mode
- Japan
- Pricing Analysis
- Market Share Analysis, 2025
- By Chemical Function
- By End-Use Industry
- By Treatment Stage
- By Delivery Format
- By Service Mode
- South Korea
- Pricing Analysis
- Market Share Analysis, 2025
- By Chemical Function
- By End-Use Industry
- By Treatment Stage
- By Delivery Format
- By Service Mode
- Poland
- Pricing Analysis
- Market Share Analysis, 2025
- By Chemical Function
- By End-Use Industry
- By Treatment Stage
- By Delivery Format
- By Service Mode
- Hungary
- Pricing Analysis
- Market Share Analysis, 2025
- By Chemical Function
- By End-Use Industry
- By Treatment Stage
- By Delivery Format
- By Service Mode
- Türkiye
- Pricing Analysis
- Market Share Analysis, 2025
- By Chemical Function
- By End-Use Industry
- By Treatment Stage
- By Delivery Format
- By Service Mode
- South Africa
- Pricing Analysis
- Market Share Analysis, 2025
- By Chemical Function
- By End-Use Industry
- By Treatment Stage
- By Delivery Format
- By Service Mode
- Australia
- Pricing Analysis
- Market Share Analysis, 2025
- By Chemical Function
- By End-Use Industry
- By Treatment Stage
- By Delivery Format
- By Service Mode
- United States
- Market Structure Analysis
- Competition Dashboard
- Competition Benchmarking
- Market Share Analysis of Top Players
- By Regional
- By Chemical Function
- By End-Use Industry
- By Treatment Stage
- By Delivery Format
- By Service Mode
- Emerging Startups
- Innovation Benchmarking
- Competition Analysis
- Competition Deep Dive
- Ecolab Inc. (Nalco Water)
- Overview
- Product Portfolio
- Profitability by Market Segments
- Sales Footprint
- Strategy Overview
- Marketing Strategy
- Product Strategy
- Channel Strategy
- Veolia Water Technologies
- Kemira Oyj
- Kurita Water Industries Ltd.
- Baker Hughes Company
- Buckman Laboratories
- Solenis International LLC
- SNF Group
- ChemTreat, Inc. (Veralto)
- Nouryon Chemicals Holding
- Veolia Water Technologies & Solutions
- ChemTreat, Inc. (Veralto Corporation)
- Buckman Laboratories International, Inc.
- Nouryon Chemicals Holding B.V.
- Ecolab Inc. (Nalco Water)
- Case Studies
- Success Stories
- Recent Developments
- Competition Deep Dive
- Assumptions & Acronyms Used
List of Tables
- Table 1: Global Market Value (USD Billion) Forecast by Region, 2021 to 2036
- Table 2: Global Market Value (USD Billion) Forecast by Chemical Function, 2021 to 2036
- Table 3: Global Market Value (USD Billion) Forecast by End-Use Industry, 2021 to 2036
- Table 4: Global Market Value (USD Billion) Forecast by Treatment Stage, 2021 to 2036
- Table 5: Global Market Value (USD Billion) Forecast by Delivery Format, 2021 to 2036
- Table 6: Global Market Value (USD Billion) Forecast by Service Mode, 2021 to 2036
- Table 7: North America Market Value (USD Billion) Forecast by Country, 2021 to 2036
- Table 8: North America Market Value (USD Billion) Forecast by Chemical Function, 2021 to 2036
- Table 9: North America Market Value (USD Billion) Forecast by End-Use Industry, 2021 to 2036
- Table 10: North America Market Value (USD Billion) Forecast by Treatment Stage, 2021 to 2036
- Table 11: North America Market Value (USD Billion) Forecast by Delivery Format, 2021 to 2036
- Table 12: North America Market Value (USD Billion) Forecast by Service Mode, 2021 to 2036
- Table 13: Latin America Market Value (USD Billion) Forecast by Country, 2021 to 2036
- Table 14: Latin America Market Value (USD Billion) Forecast by Chemical Function, 2021 to 2036
- Table 15: Latin America Market Value (USD Billion) Forecast by End-Use Industry, 2021 to 2036
- Table 16: Latin America Market Value (USD Billion) Forecast by Treatment Stage, 2021 to 2036
- Table 17: Latin America Market Value (USD Billion) Forecast by Delivery Format, 2021 to 2036
- Table 18: Latin America Market Value (USD Billion) Forecast by Service Mode, 2021 to 2036
- Table 19: Western Europe Market Value (USD Billion) Forecast by Country, 2021 to 2036
- Table 20: Western Europe Market Value (USD Billion) Forecast by Chemical Function, 2021 to 2036
- Table 21: Western Europe Market Value (USD Billion) Forecast by End-Use Industry, 2021 to 2036
- Table 22: Western Europe Market Value (USD Billion) Forecast by Treatment Stage, 2021 to 2036
- Table 23: Western Europe Market Value (USD Billion) Forecast by Delivery Format, 2021 to 2036
- Table 24: Western Europe Market Value (USD Billion) Forecast by Service Mode, 2021 to 2036
- Table 25: Eastern Europe Market Value (USD Billion) Forecast by Country, 2021 to 2036
- Table 26: Eastern Europe Market Value (USD Billion) Forecast by Chemical Function, 2021 to 2036
- Table 27: Eastern Europe Market Value (USD Billion) Forecast by End-Use Industry, 2021 to 2036
- Table 28: Eastern Europe Market Value (USD Billion) Forecast by Treatment Stage, 2021 to 2036
- Table 29: Eastern Europe Market Value (USD Billion) Forecast by Delivery Format, 2021 to 2036
- Table 30: Eastern Europe Market Value (USD Billion) Forecast by Service Mode, 2021 to 2036
- Table 31: East Asia Market Value (USD Billion) Forecast by Country, 2021 to 2036
- Table 32: East Asia Market Value (USD Billion) Forecast by Chemical Function, 2021 to 2036
- Table 33: East Asia Market Value (USD Billion) Forecast by End-Use Industry, 2021 to 2036
- Table 34: East Asia Market Value (USD Billion) Forecast by Treatment Stage, 2021 to 2036
- Table 35: East Asia Market Value (USD Billion) Forecast by Delivery Format, 2021 to 2036
- Table 36: East Asia Market Value (USD Billion) Forecast by Service Mode, 2021 to 2036
- Table 37: South Asia and Pacific Market Value (USD Billion) Forecast by Country, 2021 to 2036
- Table 38: South Asia and Pacific Market Value (USD Billion) Forecast by Chemical Function, 2021 to 2036
- Table 39: South Asia and Pacific Market Value (USD Billion) Forecast by End-Use Industry, 2021 to 2036
- Table 40: South Asia and Pacific Market Value (USD Billion) Forecast by Treatment Stage, 2021 to 2036
- Table 41: South Asia and Pacific Market Value (USD Billion) Forecast by Delivery Format, 2021 to 2036
- Table 42: South Asia and Pacific Market Value (USD Billion) Forecast by Service Mode, 2021 to 2036
- Table 43: Middle East and Africa Market Value (USD Billion) Forecast by Country, 2021 to 2036
- Table 44: Middle East and Africa Market Value (USD Billion) Forecast by Chemical Function, 2021 to 2036
- Table 45: Middle East and Africa Market Value (USD Billion) Forecast by End-Use Industry, 2021 to 2036
- Table 46: Middle East and Africa Market Value (USD Billion) Forecast by Treatment Stage, 2021 to 2036
- Table 47: Middle East and Africa Market Value (USD Billion) Forecast by Delivery Format, 2021 to 2036
- Table 48: Middle East and Africa Market Value (USD Billion) Forecast by Service Mode, 2021 to 2036
List of Figures
- Figure 1: Global Market Pricing Analysis
- Figure 2: Global Market Value (USD Billion) Forecast 2021-2036
- Figure 3: Global Market Value Share and BPS Analysis by Chemical Function, 2026 and 2036
- Figure 4: Global Market Y-o-Y Growth Comparison by Chemical Function, 2026-2036
- Figure 5: Global Market Attractiveness Analysis by Chemical Function
- Figure 6: Global Market Value Share and BPS Analysis by End-Use Industry, 2026 and 2036
- Figure 7: Global Market Y-o-Y Growth Comparison by End-Use Industry, 2026-2036
- Figure 8: Global Market Attractiveness Analysis by End-Use Industry
- Figure 9: Global Market Value Share and BPS Analysis by Treatment Stage, 2026 and 2036
- Figure 10: Global Market Y-o-Y Growth Comparison by Treatment Stage, 2026-2036
- Figure 11: Global Market Attractiveness Analysis by Treatment Stage
- Figure 12: Global Market Value Share and BPS Analysis by Delivery Format, 2026 and 2036
- Figure 13: Global Market Y-o-Y Growth Comparison by Delivery Format, 2026-2036
- Figure 14: Global Market Attractiveness Analysis by Delivery Format
- Figure 15: Global Market Value Share and BPS Analysis by Service Mode, 2026 and 2036
- Figure 16: Global Market Y-o-Y Growth Comparison by Service Mode, 2026-2036
- Figure 17: Global Market Attractiveness Analysis by Service Mode
- Figure 18: Global Market Value (USD Billion) Share and BPS Analysis by Region, 2026 and 2036
- Figure 19: Global Market Y-o-Y Growth Comparison by Region, 2026-2036
- Figure 20: Global Market Attractiveness Analysis by Region
- Figure 21: North America Market Incremental Dollar Opportunity, 2026-2036
- Figure 22: Latin America Market Incremental Dollar Opportunity, 2026-2036
- Figure 23: Western Europe Market Incremental Dollar Opportunity, 2026-2036
- Figure 24: Eastern Europe Market Incremental Dollar Opportunity, 2026-2036
- Figure 25: East Asia Market Incremental Dollar Opportunity, 2026-2036
- Figure 26: South Asia and Pacific Market Incremental Dollar Opportunity, 2026-2036
- Figure 27: Middle East and Africa Market Incremental Dollar Opportunity, 2026-2036
- Figure 28: North America Market Value Share and BPS Analysis by Country, 2026 and 2036
- Figure 29: North America Market Value Share and BPS Analysis by Chemical Function, 2026 and 2036
- Figure 30: North America Market Y-o-Y Growth Comparison by Chemical Function, 2026-2036
- Figure 31: North America Market Attractiveness Analysis by Chemical Function
- Figure 32: North America Market Value Share and BPS Analysis by End-Use Industry, 2026 and 2036
- Figure 33: North America Market Y-o-Y Growth Comparison by End-Use Industry, 2026-2036
- Figure 34: North America Market Attractiveness Analysis by End-Use Industry
- Figure 35: North America Market Value Share and BPS Analysis by Treatment Stage, 2026 and 2036
- Figure 36: North America Market Y-o-Y Growth Comparison by Treatment Stage, 2026-2036
- Figure 37: North America Market Attractiveness Analysis by Treatment Stage
- Figure 38: North America Market Value Share and BPS Analysis by Delivery Format, 2026 and 2036
- Figure 39: North America Market Y-o-Y Growth Comparison by Delivery Format, 2026-2036
- Figure 40: North America Market Attractiveness Analysis by Delivery Format
- Figure 41: North America Market Value Share and BPS Analysis by Service Mode, 2026 and 2036
- Figure 42: North America Market Y-o-Y Growth Comparison by Service Mode, 2026-2036
- Figure 43: North America Market Attractiveness Analysis by Service Mode
- Figure 44: Latin America Market Value Share and BPS Analysis by Country, 2026 and 2036
- Figure 45: Latin America Market Value Share and BPS Analysis by Chemical Function, 2026 and 2036
- Figure 46: Latin America Market Y-o-Y Growth Comparison by Chemical Function, 2026-2036
- Figure 47: Latin America Market Attractiveness Analysis by Chemical Function
- Figure 48: Latin America Market Value Share and BPS Analysis by End-Use Industry, 2026 and 2036
- Figure 49: Latin America Market Y-o-Y Growth Comparison by End-Use Industry, 2026-2036
- Figure 50: Latin America Market Attractiveness Analysis by End-Use Industry
- Figure 51: Latin America Market Value Share and BPS Analysis by Treatment Stage, 2026 and 2036
- Figure 52: Latin America Market Y-o-Y Growth Comparison by Treatment Stage, 2026-2036
- Figure 53: Latin America Market Attractiveness Analysis by Treatment Stage
- Figure 54: Latin America Market Value Share and BPS Analysis by Delivery Format, 2026 and 2036
- Figure 55: Latin America Market Y-o-Y Growth Comparison by Delivery Format, 2026-2036
- Figure 56: Latin America Market Attractiveness Analysis by Delivery Format
- Figure 57: Latin America Market Value Share and BPS Analysis by Service Mode, 2026 and 2036
- Figure 58: Latin America Market Y-o-Y Growth Comparison by Service Mode, 2026-2036
- Figure 59: Latin America Market Attractiveness Analysis by Service Mode
- Figure 60: Western Europe Market Value Share and BPS Analysis by Country, 2026 and 2036
- Figure 61: Western Europe Market Value Share and BPS Analysis by Chemical Function, 2026 and 2036
- Figure 62: Western Europe Market Y-o-Y Growth Comparison by Chemical Function, 2026-2036
- Figure 63: Western Europe Market Attractiveness Analysis by Chemical Function
- Figure 64: Western Europe Market Value Share and BPS Analysis by End-Use Industry, 2026 and 2036
- Figure 65: Western Europe Market Y-o-Y Growth Comparison by End-Use Industry, 2026-2036
- Figure 66: Western Europe Market Attractiveness Analysis by End-Use Industry
- Figure 67: Western Europe Market Value Share and BPS Analysis by Treatment Stage, 2026 and 2036
- Figure 68: Western Europe Market Y-o-Y Growth Comparison by Treatment Stage, 2026-2036
- Figure 69: Western Europe Market Attractiveness Analysis by Treatment Stage
- Figure 70: Western Europe Market Value Share and BPS Analysis by Delivery Format, 2026 and 2036
- Figure 71: Western Europe Market Y-o-Y Growth Comparison by Delivery Format, 2026-2036
- Figure 72: Western Europe Market Attractiveness Analysis by Delivery Format
- Figure 73: Western Europe Market Value Share and BPS Analysis by Service Mode, 2026 and 2036
- Figure 74: Western Europe Market Y-o-Y Growth Comparison by Service Mode, 2026-2036
- Figure 75: Western Europe Market Attractiveness Analysis by Service Mode
- Figure 76: Eastern Europe Market Value Share and BPS Analysis by Country, 2026 and 2036
- Figure 77: Eastern Europe Market Value Share and BPS Analysis by Chemical Function, 2026 and 2036
- Figure 78: Eastern Europe Market Y-o-Y Growth Comparison by Chemical Function, 2026-2036
- Figure 79: Eastern Europe Market Attractiveness Analysis by Chemical Function
- Figure 80: Eastern Europe Market Value Share and BPS Analysis by End-Use Industry, 2026 and 2036
- Figure 81: Eastern Europe Market Y-o-Y Growth Comparison by End-Use Industry, 2026-2036
- Figure 82: Eastern Europe Market Attractiveness Analysis by End-Use Industry
- Figure 83: Eastern Europe Market Value Share and BPS Analysis by Treatment Stage, 2026 and 2036
- Figure 84: Eastern Europe Market Y-o-Y Growth Comparison by Treatment Stage, 2026-2036
- Figure 85: Eastern Europe Market Attractiveness Analysis by Treatment Stage
- Figure 86: Eastern Europe Market Value Share and BPS Analysis by Delivery Format, 2026 and 2036
- Figure 87: Eastern Europe Market Y-o-Y Growth Comparison by Delivery Format, 2026-2036
- Figure 88: Eastern Europe Market Attractiveness Analysis by Delivery Format
- Figure 89: Eastern Europe Market Value Share and BPS Analysis by Service Mode, 2026 and 2036
- Figure 90: Eastern Europe Market Y-o-Y Growth Comparison by Service Mode, 2026-2036
- Figure 91: Eastern Europe Market Attractiveness Analysis by Service Mode
- Figure 92: East Asia Market Value Share and BPS Analysis by Country, 2026 and 2036
- Figure 93: East Asia Market Value Share and BPS Analysis by Chemical Function, 2026 and 2036
- Figure 94: East Asia Market Y-o-Y Growth Comparison by Chemical Function, 2026-2036
- Figure 95: East Asia Market Attractiveness Analysis by Chemical Function
- Figure 96: East Asia Market Value Share and BPS Analysis by End-Use Industry, 2026 and 2036
- Figure 97: East Asia Market Y-o-Y Growth Comparison by End-Use Industry, 2026-2036
- Figure 98: East Asia Market Attractiveness Analysis by End-Use Industry
- Figure 99: East Asia Market Value Share and BPS Analysis by Treatment Stage, 2026 and 2036
- Figure 100: East Asia Market Y-o-Y Growth Comparison by Treatment Stage, 2026-2036
- Figure 101: East Asia Market Attractiveness Analysis by Treatment Stage
- Figure 102: East Asia Market Value Share and BPS Analysis by Delivery Format, 2026 and 2036
- Figure 103: East Asia Market Y-o-Y Growth Comparison by Delivery Format, 2026-2036
- Figure 104: East Asia Market Attractiveness Analysis by Delivery Format
- Figure 105: East Asia Market Value Share and BPS Analysis by Service Mode, 2026 and 2036
- Figure 106: East Asia Market Y-o-Y Growth Comparison by Service Mode, 2026-2036
- Figure 107: East Asia Market Attractiveness Analysis by Service Mode
- Figure 108: South Asia and Pacific Market Value Share and BPS Analysis by Country, 2026 and 2036
- Figure 109: South Asia and Pacific Market Value Share and BPS Analysis by Chemical Function, 2026 and 2036
- Figure 110: South Asia and Pacific Market Y-o-Y Growth Comparison by Chemical Function, 2026-2036
- Figure 111: South Asia and Pacific Market Attractiveness Analysis by Chemical Function
- Figure 112: South Asia and Pacific Market Value Share and BPS Analysis by End-Use Industry, 2026 and 2036
- Figure 113: South Asia and Pacific Market Y-o-Y Growth Comparison by End-Use Industry, 2026-2036
- Figure 114: South Asia and Pacific Market Attractiveness Analysis by End-Use Industry
- Figure 115: South Asia and Pacific Market Value Share and BPS Analysis by Treatment Stage, 2026 and 2036
- Figure 116: South Asia and Pacific Market Y-o-Y Growth Comparison by Treatment Stage, 2026-2036
- Figure 117: South Asia and Pacific Market Attractiveness Analysis by Treatment Stage
- Figure 118: South Asia and Pacific Market Value Share and BPS Analysis by Delivery Format, 2026 and 2036
- Figure 119: South Asia and Pacific Market Y-o-Y Growth Comparison by Delivery Format, 2026-2036
- Figure 120: South Asia and Pacific Market Attractiveness Analysis by Delivery Format
- Figure 121: South Asia and Pacific Market Value Share and BPS Analysis by Service Mode, 2026 and 2036
- Figure 122: South Asia and Pacific Market Y-o-Y Growth Comparison by Service Mode, 2026-2036
- Figure 123: South Asia and Pacific Market Attractiveness Analysis by Service Mode
- Figure 124: Middle East and Africa Market Value Share and BPS Analysis by Country, 2026 and 2036
- Figure 125: Middle East and Africa Market Value Share and BPS Analysis by Chemical Function, 2026 and 2036
- Figure 126: Middle East and Africa Market Y-o-Y Growth Comparison by Chemical Function, 2026-2036
- Figure 127: Middle East and Africa Market Attractiveness Analysis by Chemical Function
- Figure 128: Middle East and Africa Market Value Share and BPS Analysis by End-Use Industry, 2026 and 2036
- Figure 129: Middle East and Africa Market Y-o-Y Growth Comparison by End-Use Industry, 2026-2036
- Figure 130: Middle East and Africa Market Attractiveness Analysis by End-Use Industry
- Figure 131: Middle East and Africa Market Value Share and BPS Analysis by Treatment Stage, 2026 and 2036
- Figure 132: Middle East and Africa Market Y-o-Y Growth Comparison by Treatment Stage, 2026-2036
- Figure 133: Middle East and Africa Market Attractiveness Analysis by Treatment Stage
- Figure 134: Middle East and Africa Market Value Share and BPS Analysis by Delivery Format, 2026 and 2036
- Figure 135: Middle East and Africa Market Y-o-Y Growth Comparison by Delivery Format, 2026-2036
- Figure 136: Middle East and Africa Market Attractiveness Analysis by Delivery Format
- Figure 137: Middle East and Africa Market Value Share and BPS Analysis by Service Mode, 2026 and 2036
- Figure 138: Middle East and Africa Market Y-o-Y Growth Comparison by Service Mode, 2026-2036
- Figure 139: Middle East and Africa Market Attractiveness Analysis by Service Mode
- Figure 140: Global Market - Tier Structure Analysis
- Figure 141: Global Market - Company Share Analysis
Frequently Asked Questions
How big is the industrial wastewater treatment chemical market in 2026, and what is forecast for 2036?
FMI estimates that global demand stood at USD 14.2 billion in 2025 and reached USD 15.0 billion in 2026. Overall valuation is on track to hit USD 25.9 billion by 2036.
What is the CAGR for the industrial wastewater treatment chemical market from 2026 to 2036?
The industrial wastewater treatment chemical sector is projected to expand at a 5.6% CAGR over the 2026 to 2036 window, adding USD 10.9 billion in incremental revenue across primary and tertiary treatment stages.
Which chemical function segment leads the industrial wastewater treatment chemical market?
Coagulants and Flocculants hold an estimated 36.0% of chemical function demand in 2026 since bulk inorganic salts and polyacrylamide polymers are dosed across every primary clarifier, DAF unit, and centrifuge.
Which end-use industry segment leads the industrial wastewater treatment chemical market?
Oil and Gas Refining and Petrochemicals represent 42.0% of the end-use industry category in 2026 due to continuous chemical treatment of desalter brine, sour water, and produced water.
Which country has a notable growth outlook during the assessment period?
Canada leads national expansion projections at a 6.2% CAGR through 2036, followed closely by Mexico at 6.1% and Australia at 6.0%.
Who are the key players in the market?
Ecolab Inc. and Veolia Water Technologies & Solutions lead global supply, while Kemira Oyj and Kurita Water Industries Ltd. as well as Baker Hughes Company also hold major shares. Buckman Laboratories and Solenis along with SNF Group, ChemTreat, and Nouryon complete the primary supplier roster.
Preview the report firsthand - request a free sample
Get SampleGet the brochure for pricing and purchase details.
Get PDF
