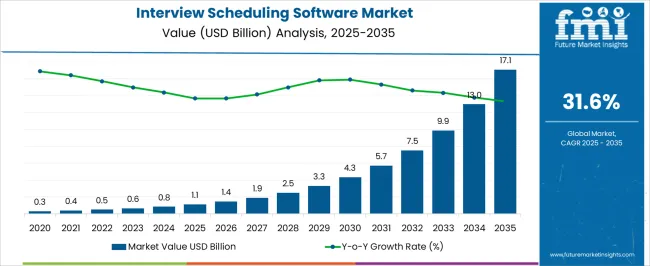
The Interview Scheduling Software Market is estimated to be valued at USD 1.1 billion in 2025 and is projected to reach USD 17.1 billion by 2035, registering a compound annual growth rate (CAGR) of 31.6% over the forecast period.
| Metric | Value |
|---|---|
| Interview Scheduling Software Market Estimated Value in (2025 E) | USD 1.1 billion |
| Interview Scheduling Software Market Forecast Value in (2035 F) | USD 17.1 billion |
| Forecast CAGR (2025 to 2035) | 31.6% |
The interview scheduling software market is advancing steadily, driven by the growing emphasis on digital recruitment solutions and streamlined human resource management. Industry announcements and company filings have highlighted an increased reliance on technology to automate scheduling tasks, reduce hiring delays, and enhance candidate experience.
Businesses are investing in platforms that integrate seamlessly with applicant tracking systems, video conferencing tools, and communication channels, enabling recruiters to manage high application volumes with efficiency. The market has further benefitted from rising adoption of hybrid and remote hiring practices, which require flexible and scalable scheduling solutions.
Press releases from HR technology providers have underscored the importance of advanced features such as AI-driven scheduling, time-zone management, and automated reminders in reducing administrative workload. Looking ahead, growth prospects are expected to be shaped by the adoption of analytics-driven recruitment platforms, increasing focus on reducing hiring costs, and expanding usage of interview scheduling software across both enterprises and small businesses.
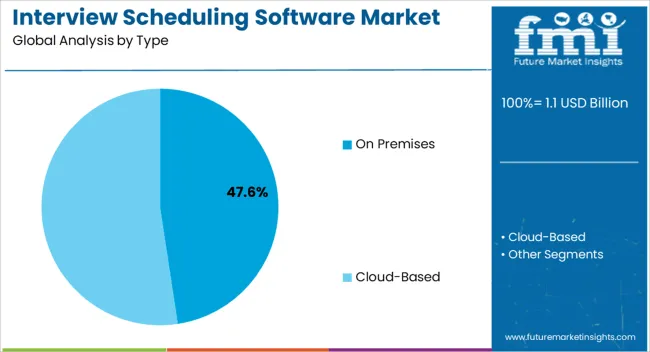
The On Premises segment is projected to hold 47.6% of the interview scheduling software market revenue in 2025, maintaining a strong position due to demand from organizations prioritizing data security and customized deployment. Enterprises operating in regulated industries such as finance, healthcare, and government have preferred on-premises solutions for their control over sensitive recruitment data and compliance with stringent IT policies.
This deployment model has also been favored by companies requiring integration with legacy HR management systems. IT departments have valued the ability to tailor configurations, ensuring seamless alignment with internal processes.
Although cloud-based solutions are gaining ground, on-premises platforms continue to be adopted where infrastructure stability, proprietary data protection, and governance requirements take precedence. As large organizations with significant IT resources maintain their preference for high-control deployment, the On Premises segment is expected to sustain its relevance within the overall market.
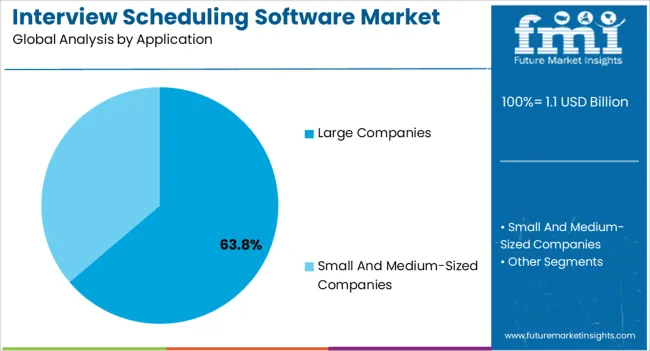
The Large Companies segment is projected to account for 63.8% of the interview scheduling software market revenue in 2025, reinforcing its status as the leading application category. Growth of this segment has been attributed to the high hiring volumes and complex organizational structures typical of large enterprises, necessitating advanced scheduling tools.
HR leaders have adopted interview scheduling software to streamline multi-round recruitment processes, coordinate across departments, and improve candidate engagement. Investor updates from HR technology firms have indicated strong enterprise-level demand for scheduling solutions capable of integrating analytics, communication automation, and compliance tracking.
Large organizations have also prioritized reducing recruitment cycle times to secure top talent in competitive labor markets, further strengthening demand. Additionally, investments in talent acquisition technology by multinational corporations have expanded the global footprint of enterprise-grade solutions. As large companies continue to scale hiring operations and pursue digital HR transformation, this segment is expected to remain the dominant user base for interview scheduling software.
As per the interview scheduling software market research by Future Market Insights, historically, from 2020 to 2025, the market value increased by around 38% CAGR. With an absolute dollar opportunity of USD 17.1 billion, the market is projected to reach a valuation of USD 8 billion by 2035.
The interview scheduling software market is growing due to the increased financial resources of organizations, an increase in meeting management requirements, and greater use by small and medium-sized enterprises. The prevalence of interview scheduling software is increasing with the onset of the pandemic.
The growing need for effectiveness in the recruitment and selection process is one of the primary factors driving the market's growth. By streamlining their recruitment process, businesses can save time and money. Also, it aids in the reduction of human errors and the improvement of hiring reliability.
The increased popularity of cloud-based solutions is yet another key factor driving future growth. Cloud-based solutions have the advantages of adaptability, scalability, and cost-effectiveness. They also give improved security because the data is kept on distant servers. The increasing usage of artificial intelligence (AI) for interview scheduling software is another propelling factor driving the market's growth. AI-based solutions can help businesses automate repetitive tasks like interviewing, candidate screening, and selection.
Increased internet and penetration of smartphones, the need to improve corporate performance by saving time, and the growing need to eliminate no-shows and reduce administration expenses are some of the key factors driving the global interview scheduling software market forward. Furthermore, the integration of artificial intelligence and natural speech processing in interview scheduling software is expected to open up significant business prospects.
Although remote working has raised the demand for interview software platforms and lowered overall costs, there are issues with information and telecommunication services in Asia Pacific and South American countries.
The availability of networking infrastructure and telecommunication services in rural and semi-urban locations in these regions lies below the global average, limiting the market for interview scheduling software.
North America is expected to account for a leading share of the interview scheduling software market. The growth of the market for effective workforce management services, as well as the increasing acceptance of cloud-based technology across numerous industries in the region, could be attributed to the growth of the interview scheduling software market.
Due to the increasing demand for cloud-based technologies amongst small and medium businesses in the region, the market In Asia Pacific is predicted to develop at the highest pace over the projection period. The increase in entrepreneurs and increased usage of modern technologies in the region are also propelling market expansion.
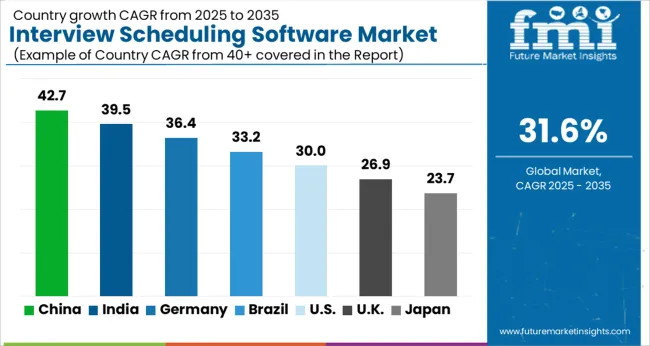
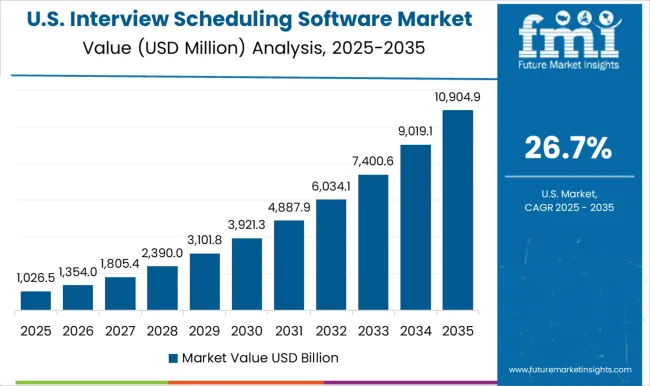
The United States is expected to account for a huge market of USD 17.1 billion by the end of 2035. Approximately 60% of job recruiters in the United States utilize video technology to conduct remote interviews. According to 81% of recruiters, virtual recruiting may continue long after the COVID-19 epidemic. In addition, nearly 74% of recruiters feel video interviews have simplified their jobs.
During a job interview, 75% of older Americans said they were discriminated against due to age. Interviews last about 40 minutes on average, but they can go anywhere from 30 to 90 minutes. In most cases, job searchers receive a response from the employer between 24 hours to two weeks. Phone interviews are frequently used as a screening technique before a more formal and organized job interview. The United States shifted their work to the online mode, which led to the swift adoption of Interview Scheduling Software.
The On-premises deployment of interview scheduling software is expected to account for the highest CAGR of 30.8% during 2025 to 2035. Customers' local servers are used to install On-premise solutions. The software and infrastructure must be managed and maintained by the customer. In comparison to cloud-based solutions, on-premise solutions give customers more control of the data. These are also more flexible and may be tailored to the customer's demands.
Cloud-based deployment of interview scheduling software is rapidly growing and may generate the highest revenue in the forthcoming years. It is a type of Software as a Service (SaaS) that allows users to access data or programs stored on remote servers using a web-based interface. Although the data or program can be used locally, it must be accessible through the internet. It is also known as on-demand technology, cloud-based software, or web-based software.
In 2024, large companies held a leading market share. Market through them is expected to account for 19% CAGR for the forecasted period in the global market. Large businesses employ interview scheduling software to manage their personnel successfully. It allows them to schedule interviews more swiftly and efficiently across various time zones, resulting in increased productivity. Due to the rising need for flexible schedules among working professionals, particularly in emerging nations like India and China, small and mid-sized firms are projected to grow faster throughout the forecast period. Over the projection period, the increased desire for online recruitment solutions is expected to help segment growth.
Small and medium-sized businesses require a shift in employee working hours because they have a limited amount of money for training employees or scheduling current ones due to other commitments such as family or personal issues. Interview scheduling software market can keep track of prospective candidates, engage in interviews, and keep track of the results of those interviews. Interview scheduling software is very useful in large organizations with many interviews going on simultaneously. It is also appropriate for smaller businesses that just conduct a few interviews every month.
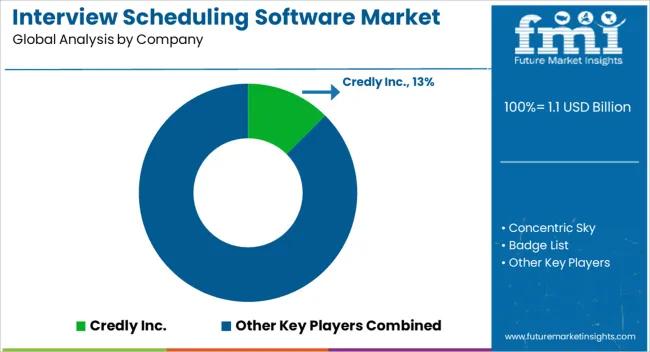
The market for interview scheduling software market needs to be more cohesive. To ensure long-term viability in the market, leading vendors use tactics such as joint ventures, collaboration agreements, innovative products, research and development, and mergers and acquisitions. The key players in the global market include Calendly, Paycor, and Yello.co, Astarel, HigherMe, ZenHR, Monjin, Rakuna, and TimeTap.
Some recent developments in the Market are:
Similarly, more recent developments related to companies in the interview scheduling software market have been tracked by the team at Future Market Insights, which are available in the full report.
The global interview scheduling software market is estimated to be valued at USD 1.1 billion in 2025.
The market size for the interview scheduling software market is projected to reach USD 17.1 billion by 2035.
The interview scheduling software market is expected to grow at a 31.6% CAGR between 2025 and 2035.
The key product types in interview scheduling software market are on premises and cloud-based.
In terms of application, large companies segment to command 63.8% share in the interview scheduling software market in 2025.


Our Research Products

The "Full Research Suite" delivers actionable market intel, deep dives on markets or technologies, so clients act faster, cut risk, and unlock growth.

The Leaderboard benchmarks and ranks top vendors, classifying them as Established Leaders, Leading Challengers, or Disruptors & Challengers.

Locates where complements amplify value and substitutes erode it, forecasting net impact by horizon

We deliver granular, decision-grade intel: market sizing, 5-year forecasts, pricing, adoption, usage, revenue, and operational KPIs—plus competitor tracking, regulation, and value chains—across 60 countries broadly.

Spot the shifts before they hit your P&L. We track inflection points, adoption curves, pricing moves, and ecosystem plays to show where demand is heading, why it is changing, and what to do next across high-growth markets and disruptive tech

Real-time reads of user behavior. We track shifting priorities, perceptions of today’s and next-gen services, and provider experience, then pace how fast tech moves from trial to adoption, blending buyer, consumer, and channel inputs with social signals (#WhySwitch, #UX).

Partner with our analyst team to build a custom report designed around your business priorities. From analysing market trends to assessing competitors or crafting bespoke datasets, we tailor insights to your needs.
Supplier Intelligence
Discovery & Profiling
Capacity & Footprint
Performance & Risk
Compliance & Governance
Commercial Readiness
Who Supplies Whom
Scorecards & Shortlists
Playbooks & Docs
Category Intelligence
Definition & Scope
Demand & Use Cases
Cost Drivers
Market Structure
Supply Chain Map
Trade & Policy
Operating Norms
Deliverables
Buyer Intelligence
Account Basics
Spend & Scope
Procurement Model
Vendor Requirements
Terms & Policies
Entry Strategy
Pain Points & Triggers
Outputs
Pricing Analysis
Benchmarks
Trends
Should-Cost
Indexation
Landed Cost
Commercial Terms
Deliverables
Brand Analysis
Positioning & Value Prop
Share & Presence
Customer Evidence
Go-to-Market
Digital & Reputation
Compliance & Trust
KPIs & Gaps
Outputs
Full Research Suite comprises of:
Market outlook & trends analysis
Interviews & case studies
Strategic recommendations
Vendor profiles & capabilities analysis
5-year forecasts
8 regions and 60+ country-level data splits
Market segment data splits
12 months of continuous data updates
DELIVERED AS:
PDF EXCEL ONLINE
Academic Scheduling Software Market Size and Share Forecast Outlook 2025 to 2035
Software-Defined Wide Area Network Market Size and Share Forecast Outlook 2025 to 2035
Software Defined Vehicle Market Size and Share Forecast Outlook 2025 to 2035
Software Defined Networking (SDN) And Network Function Virtualization (NFV) Market Size and Share Forecast Outlook 2025 to 2035
Software Defined Perimeter (SDP) Market Size and Share Forecast Outlook 2025 to 2035
Software-Defined Wide Area Network SD-WAN Market Size and Share Forecast Outlook 2025 to 2035
Software Defined Radio (SDR) Market Size and Share Forecast Outlook 2025 to 2035
Software License Management (SLM) Market Size and Share Forecast Outlook 2025 to 2035
Software-Defined Networking SDN Market Size and Share Forecast Outlook 2025 to 2035
Software-Defined Anything (SDx) Market Size and Share Forecast Outlook 2025 to 2035
Software-Defined Data Center Market Size and Share Forecast Outlook 2025 to 2035
Software Containers Market Size and Share Forecast Outlook 2025 to 2035
Software Defined Application And Infrastructure Market Size and Share Forecast Outlook 2025 to 2035
Software Defined Networking Market Size and Share Forecast Outlook 2025 to 2035
Software-Defined Camera (SDC) Market Size and Share Forecast Outlook 2025 to 2035
Examining Market Share Trends in the Software Distribution Industry
Software Distribution Market Analysis by Deployment Type, by Organization Size and by Industry Vertical Through 2035
Software Defined Video Networking Market
UK Software Distribution Market Analysis – Size & Industry Trends 2025-2035
MES Software For Discrete Manufacturing Market Size and Share Forecast Outlook 2025 to 2035

Thank you!
You will receive an email from our Business Development Manager. Please be sure to check your SPAM/JUNK folder too.
Chat With
MaRIA