The global inverter duty motor market is valued at USD 5.3 billion in 2025. It is slated to reach USD 16.6 billion by 2035, recording an absolute increase of USD 11.3 billion over the forecast period. This translates into a total growth of 213.2%, with the market forecast to expand at a compound annual growth rate (CAGR) of 12.1% between 2025 and 2035. The overall market size is expected to grow by nearly 3.1X during the same period, supported by increasing demand for energy-efficient motor solutions in industrial automation and process control applications, growing adoption of variable frequency drive systems for precision motor control and energy optimization, expanding electric vehicle manufacturing requiring VFD-integrated motor platforms, and rising emphasis on high-efficiency IE4 and IE5 motor classes complying with stringent energy regulations across pump operations, fan systems, conveyor applications, and industrial process equipment.
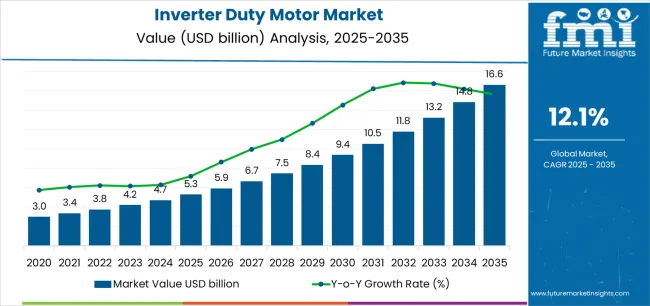
Between 2025 and 2030, the inverter duty motor market is projected to expand from USD 5.3 billion to USD 9.3 billion, resulting in a value increase of USD 4.0 billion, which represents 35.4% of the total forecast growth for the decade. This phase of development will be shaped by increasing industrial automation upgrades and smart factory implementations, rising adoption of energy efficiency regulations requiring IE4-IE5 motor classes, and growing demand for VFD-ready motor platforms in electric vehicle battery production and precision manufacturing facilities. Industrial equipment manufacturers and process plant operators are expanding their inverter duty motor deployments to address the growing demand for precise speed control and energy-efficient motor solutions that ensure operational excellence and regulatory compliance.
| Metric | Value |
|---|---|
| Estimated Value in (2025E) | USD 5.3 billion |
| Forecast Value in (2035F) | USD 16.6 billion |
| Forecast CAGR (2025 to 2035) | 12.1% |
From 2030 to 2035, the market is forecast to grow from USD 9.3 billion to USD 16.6 billion, adding another USD 7.3 billion, which constitutes 64.6% of the overall ten-year expansion. This period is expected to be characterized by the expansion of Industry 4.0 digital manufacturing ecosystems integrating predictive maintenance capabilities, the development of ultra-high-efficiency motor designs incorporating advanced magnetic materials and optimized winding configurations, and the growth of specialized inverter duty motors for electric vehicle powertrain electrification and renewable energy applications. The growing adoption of cloud-native industrial automation platforms and condition-based maintenance strategies will drive demand for inverter duty motors with enhanced thermal management and advanced insulation systems designed for demanding VFD operation profiles.
Between 2020 and 2025, the inverter duty motor market experienced strong growth, driven by accelerating industrial automation investments and growing recognition of inverter duty motors as essential components for achieving energy efficiency and precise process control in diverse pump systems, fan applications, material handling equipment, and industrial process machinery. The market developed as industrial engineers and plant managers recognized the potential for VFD-paired motor technology to reduce energy consumption, enable variable speed operation, and support operational flexibility while meeting increasingly stringent efficiency standards. Technological advancement in motor insulation systems and bearing designs began emphasizing the critical importance of withstanding high-frequency voltage stress and shaft current effects characteristic of inverter-fed operation.
Market expansion is being supported by the increasing global demand for energy-efficient industrial motor solutions driven by rising electricity costs and stringent energy regulations, alongside the corresponding need for variable speed drive-compatible motors that can enhance process control precision, enable significant energy savings, and maintain reliable operation across pump systems, fan applications, conveyor operations, and industrial processing equipment. Modern industrial facilities and manufacturing plants are increasingly focused on implementing inverter duty motor solutions that can deliver precise speed control, reduce energy consumption by 30-50% compared to fixed-speed operation, and provide consistent performance under demanding variable frequency drive operating conditions.
The growing emphasis on industrial decarbonization and operational efficiency is driving demand for premium efficiency motors that can support VFD integration, enable optimized process control, and ensure comprehensive energy management through intelligent motor-drive systems. Industrial manufacturers' preference for motor solutions that combine superior efficiency ratings with VFD-resilient construction and predictive maintenance capabilities is creating opportunities for innovative IE4 and IE5 efficiency class motor implementations. The rising influence of Industry 4.0 digital transformation and electric vehicle manufacturing expansion is also contributing to increased adoption of inverter duty motors that can provide superior performance characteristics without compromising reliability or operational flexibility in smart factory environments.
The market is segmented by construction material, application, end-user industry, and region. By construction material, the market is divided into laminated steel including M19-M23 electrical steel, M27-M36 grades, high-silicon low-loss grades, and amorphous-nanocrystalline blends, as well as cast iron and aluminum constructions. Based on application, the market is categorized into pumps covering clean water and HVAC circulation, wastewater and desalination, process chemicals and refining, and oil and gas lifting and transfer applications, as well as fans, conveyors, extruders, and other industrial applications. By end-user, the market is segmented into oil and gas including upstream exploration and production, midstream, and downstream operations, as well as chemicals, metal and mining, food and beverage, paper and pulp, and other industrial sectors. Regionally, the market is divided into Asia Pacific, Europe, North America, Latin America, and Middle East & Africa.
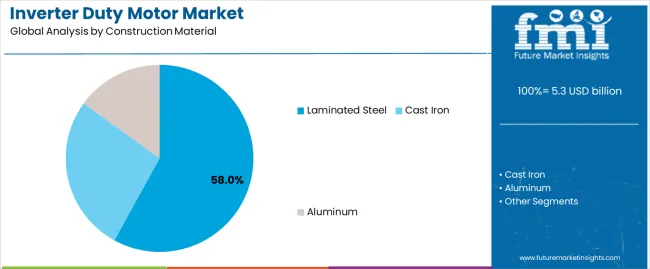
The laminated steel construction material segment is projected to maintain its leading position in the inverter duty motor market in 2025 with a 58.0% market share, reaffirming its role as the preferred material configuration for high-efficiency motor core construction and electromagnetic performance optimization. Industrial motor manufacturers increasingly utilize laminated electrical steel for its superior magnetic properties, excellent core loss characteristics, and proven effectiveness in delivering high torque density while minimizing energy losses in VFD operation. Within the laminated steel segment, M19-M23 electrical steel grades command 24.0% share offering optimal balance of performance and cost, M27-M36 grades represent 19.0% providing economical solutions for standard applications, high-silicon low-loss grades account for 11.0% serving premium efficiency requirements, and amorphous-nanocrystalline blends constitute 4.0% addressing ultra-high-efficiency applications. Laminated steel technology's proven effectiveness and electromagnetic versatility directly address the industry requirements for energy-efficient motor construction and high-frequency operation capability across diverse industrial motor applications and power ratings.
This construction material segment forms the foundation of modern high-efficiency motor design, as it represents the core material with the greatest contribution to electromagnetic efficiency and established performance record across multiple industrial applications and VFD operating scenarios. Industrial equipment investments in energy efficiency continue to strengthen adoption among motor manufacturers and end-users. With energy regulations emphasizing minimum efficiency standards and operational economics favoring reduced losses, laminated steel motor cores align with both performance objectives and sustainability requirements, making them the central component of comprehensive energy efficiency strategies.
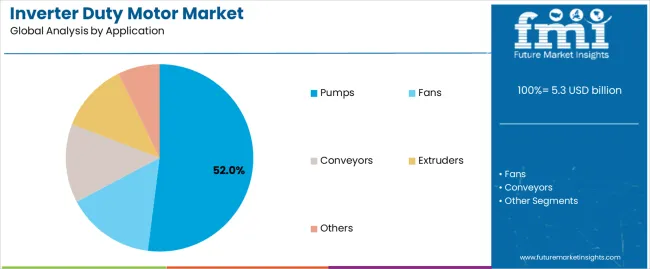
The pump application segment is projected to represent the largest share of inverter duty motor demand in 2025 with a 52.0% market share, underscoring its critical role as the primary driver for VFD-motor adoption across water circulation, wastewater treatment, chemical processing, and hydrocarbon transfer applications. Industrial facilities and utility operators prefer inverter duty motors for pump applications due to their exceptional energy efficiency benefits through variable flow control, precise pressure management capabilities, and ability to eliminate throttling losses while supporting operational flexibility and equipment protection through soft starting and controlled acceleration. Within the pump segment, clean water and HVAC circulation applications command 16.0% share, wastewater and desalination represent 14.0%, process chemicals and refining account for 12.0%, and oil and gas lifting and transfer constitute 10.0%. Positioned as essential motor solutions for modern pumping systems, inverter duty motors offer both energy savings advantages and operational control benefits.
The segment is supported by continuous innovation in pump system optimization and the growing availability of integrated motor-drive packages that enable superior energy efficiency with simplified installation and commissioning procedures. Additionally, industrial facilities are investing in comprehensive VFD retrofit programs to support increasingly stringent energy efficiency mandates and operational cost reduction objectives. As industrial water consumption regulations tighten and energy costs increase, the pump application will continue to dominate the market while supporting advanced variable speed control and predictive maintenance optimization strategies.
The inverter duty motor market is advancing rapidly due to increasing demand for energy-efficient industrial motor solutions driven by rising electricity costs and stringent efficiency regulations, and growing adoption of variable frequency drive systems enabling precise process control and substantial energy savings providing enhanced operational flexibility and cost reduction across pump operations, fan systems, material handling, and industrial processing applications. However, the market faces challenges, including higher initial costs compared to standard motor offerings, technical complexity requiring specialized engineering and installation expertise, and concerns regarding bearing currents and insulation stress under VFD operation requiring enhanced motor construction. Innovation in advanced insulation systems and predictive maintenance integration continues to influence product development and market expansion patterns.
The growing deployment of Industry 4.0 digital manufacturing systems and smart factory automation is driving demand for inverter duty motor solutions that address intelligent manufacturing requirements including integrated sensor systems for condition monitoring, digital connectivity for predictive maintenance analytics, and precise speed control for synchronized production processes. Advanced manufacturing facilities require VFD-ready motor platforms that deliver seamless integration with industrial automation controllers while providing real-time operational data for optimization algorithms and maintenance scheduling. Industrial manufacturers are increasingly recognizing the competitive advantages of digitally integrated motor-drive systems for production efficiency optimization and unplanned downtime elimination, creating opportunities for innovative inverter duty motor designs incorporating embedded sensors and industrial IoT connectivity specifically optimized for smart manufacturing environments.
Modern motor manufacturers are incorporating IE4 Super Premium and IE5 Ultra Premium efficiency class designs to enhance energy performance, reduce operational costs, and support comprehensive sustainability objectives through optimized electromagnetic designs and advanced material selection. Leading manufacturers are developing motors utilizing high-silicon electrical steels, implementing optimized rotor designs for reduced losses, and advancing winding configurations that maximize efficiency while maintaining VFD compatibility. These technologies improve operational economics while enabling regulatory compliance opportunities, including qualification for energy efficiency incentive programs, compliance with minimum energy performance standards, and achievement of corporate carbon reduction commitments. Advanced efficiency integration also allows industrial facilities to support comprehensive energy management objectives and operational cost reduction beyond traditional motor replacement strategies.
The rapid expansion of electric vehicle assembly facilities and battery production plants is driving demand for precision inverter duty motors with sophisticated VFD integration serving automated material handling, fluid dispensing systems, and environmental control applications. EV manufacturing requires specialized motor solutions with exceptional speed control precision, minimal torque ripple for sensitive production processes, and high reliability for continuous automated operations that exceed traditional industrial motor specifications, creating premium application segments with differentiated performance value propositions. Manufacturers are investing in specialized motor designs and application engineering capabilities to serve emerging electric mobility manufacturing sectors while supporting innovation in automated assembly, battery cell production, and electric powertrain manufacturing industries.
| Country | CAGR (2025-2035) |
|---|---|
| South Korea | 14.4% |
| Japan | 13.8% |
| United Kingdom | 13.5% |
| United States | 12.5% |
| China | 11.4% |
| India | 11.2% |
| Germany | 10.6% |
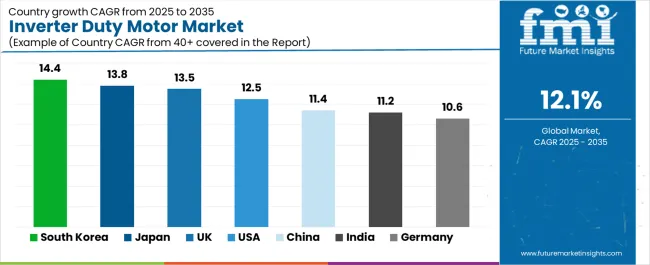
The inverter duty motor market is experiencing robust growth globally, with South Korea leading at a 14.4% CAGR through 2035, driven by massive scale in electric vehicle and battery manufacturing plants utilizing VFD-integrated motor systems and government incentive programs supporting high-efficiency motor adoption in smart factory initiatives. Japan follows at 13.8%, supported by precision manufacturing excellence and electric vehicle powertrain electrification alongside early adoption of IE5 efficiency class VFD-ready motor platforms. The United Kingdom shows growth at 13.5%, emphasizing strict energy efficiency compliance requirements in industrial sectors and comprehensive retrofit programs in water utilities and process plant facilities. The United States demonstrates 12.5% growth, supported by automation upgrade programs across discrete and process manufacturing industries and strong motor replacement cycles favoring VFD-paired premium efficiency motors. China records 11.4%, focusing on substantial chemicals and metals industry expansion and wastewater infrastructure buildout alongside policy initiatives targeting industrial energy intensity reduction. India exhibits 11.2% growth, emphasizing rapid expansion in pump and HVAC applications for infrastructure development and local manufacturing under Production Linked Incentive schemes with smart factory adoption. Germany shows 10.6% growth, supported by process industry decarbonization initiatives and Industrie 4.0 implementation with high penetration of VFD retrofit programs in brownfield industrial sites.
The report covers an in-depth analysis of 40+ countries; seven top-performing countries are highlighted below.
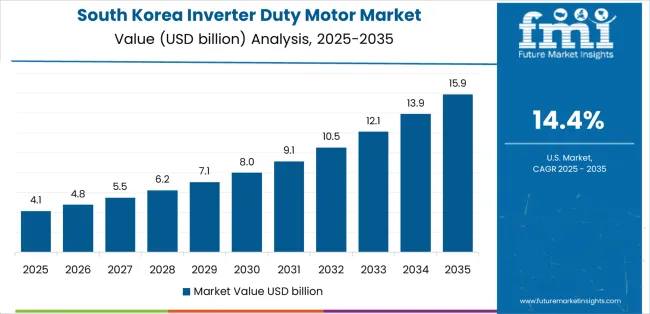
Revenue from inverter duty motors in South Korea is projected to exhibit exceptional growth with a CAGR of 14.4% through 2035, driven by massive-scale electric vehicle and battery manufacturing facility construction utilizing sophisticated VFD-integrated motor systems and government incentive programs supporting high-efficiency motor adoption in smart factory modernization initiatives. The country's leadership in electronics manufacturing and automotive electrification is creating substantial demand for precision inverter duty motor solutions. Major industrial equipment manufacturers and motor suppliers are establishing comprehensive production and engineering capabilities to serve both domestic advanced manufacturing requirements and regional export markets.
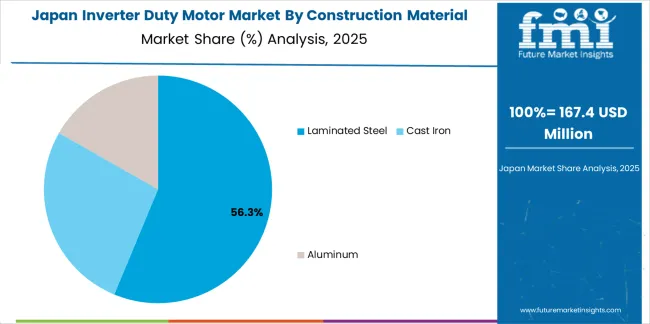
Revenue from inverter duty motors in Japan is expanding at a CAGR of 13.8%, supported by the country's excellence in precision manufacturing operations and automotive industry electrification transformation alongside pioneering adoption of IE5 Ultra Premium efficiency class motors with advanced VFD compatibility features. The nation's technological sophistication and quality standards are driving demand for premium inverter duty motor solutions throughout advanced manufacturing sectors. Leading motor manufacturers and industrial automation companies are investing extensively in next-generation motor technologies and application engineering capabilities.
Revenue from inverter duty motors in the United Kingdom is expanding at a CAGR of 13.5%, driven by stringent energy efficiency compliance requirements in industrial sectors mandating premium efficiency motor adoption and comprehensive retrofit programs in water utilities and chemical process plants upgrading to VFD-controlled systems. The nation's regulatory environment and infrastructure modernization focus are driving demand for energy-efficient motor solutions. Water utilities and process industry operators are investing in systematic motor-drive upgrade programs to achieve energy targets and operational cost reduction.
Revenue from inverter duty motors in the United States is expanding at a CAGR of 12.5%, supported by comprehensive automation upgrade programs across discrete manufacturing and continuous process industries and strong motor replacement cycles favoring transition to VFD-paired premium efficiency motors from aging fixed-speed installations. The nation's mature industrial base and automation technology adoption are driving demand for advanced inverter duty motor solutions. Industrial equipment manufacturers and automation system integrators are investing in comprehensive motor-drive system capabilities to serve modernization requirements.
Revenue from inverter duty motors in China is expanding at a CAGR of 11.4%, supported by substantial scale in chemicals and metals processing industries alongside massive wastewater treatment infrastructure construction programs and government policy initiatives targeting industrial energy intensity reduction through equipment efficiency improvements. The nation's industrial production scale and environmental policy evolution are driving demand for energy-efficient motor technologies. State-owned enterprises and private industrial operators are investing in motor upgrade programs supporting energy conservation mandates.
Revenue from inverter duty motors in India is expanding at a CAGR of 11.2%, supported by rapid expansion in pump and HVAC applications serving infrastructure development projects and local motor manufacturing growth under Production Linked Incentive schemes alongside smart factory adoption in automotive and industrial sectors. The nation's infrastructure investment momentum and manufacturing policy support are driving demand for inverter duty motor solutions. Domestic motor manufacturers and international companies are establishing production capabilities to serve growing market requirements.
Revenue from inverter duty motors in Germany is expanding at a CAGR of 10.6%, driven by process industry decarbonization initiatives requiring energy-efficient motor technologies and comprehensive Industrie 4.0 digital manufacturing implementation programs alongside high penetration of VFD retrofit projects in existing brownfield industrial facilities upgrading aging motor-pump systems. Germany's engineering excellence and sustainability commitment are driving sophisticated motor-drive system adoption throughout industrial sectors. Chemical manufacturers and automotive suppliers are establishing comprehensive energy efficiency programs incorporating advanced motor technologies.
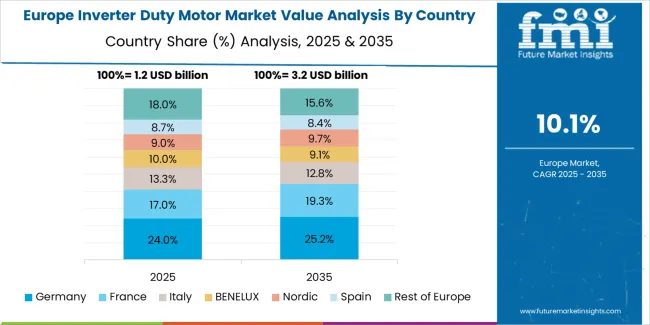
The inverter duty motor market in Europe is projected to grow from USD 1.5 billion in 2025 to USD 4.6 billion by 2035, registering a CAGR of approximately 12.0% over the forecast period. Germany is expected to maintain leadership with approximately 24.0% market share in 2025, supported by process industry decarbonization programs, Industrie 4.0 digital manufacturing adoption, and comprehensive VFD retrofit initiatives in brownfield industrial sites.
The United Kingdom follows with approximately 17.0% market share in 2025, driven by stringent energy efficiency compliance requirements and systematic water utility and process plant retrofit programs. France holds approximately 13.0% market share in 2025, supported by industrial automation investments and process industry modernization. Italy commands approximately 11.0% in 2025, driven by manufacturing sector upgrades and pump system efficiency programs. The Nordic region maintains approximately 9.0% in 2025, reflecting premium efficiency motor preferences and advanced automation adoption. Spain accounts for approximately 9.0% in 2025, supported by industrial facility modernization and water infrastructure investments. The Benelux region holds approximately 8.0% in 2025, driven by port infrastructure and logistics automation. The Rest of Europe region represents approximately 9.0% in 2025, reflecting emerging adoption in Central and Eastern European manufacturing sectors. European industry mix is led by chemicals at 24.0%, oil and gas at 21.0%, water and wastewater at 18.0%, food and beverage at 15.0%, metals and mining at 12.0%, and paper and pulp at 10.0%, with growth concentrated in pump-driven VFD retrofits to IE4-IE5 motor platforms and brownfield Industrie 4.0 digital upgrade programs.
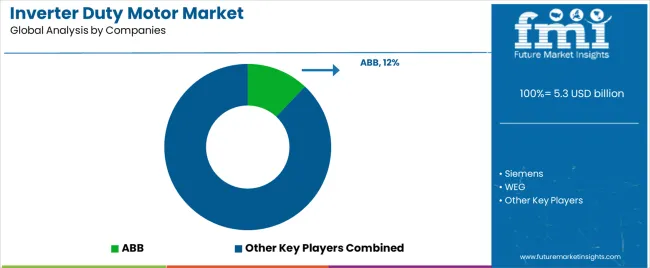
The inverter duty motor market is characterized by competition among global industrial motor manufacturers, specialized VFD-motor system suppliers, and regional electrical equipment producers. Companies are investing in advanced insulation system development, premium efficiency motor design, digital connectivity integration, and application engineering support to deliver reliable, energy-efficient, and digitally integrated inverter duty motor solutions. Innovation in bearing current mitigation technologies, thermal management systems, and predictive maintenance sensor integration is central to strengthening market position and competitive advantage.
ABB leads the market with a 12.0% share, offering comprehensive inverter duty motor solutions with a focus on premium efficiency platforms, extensive power rating coverage, and integrated digital connectivity capabilities across diverse industrial and process applications. The company provides industry-leading motor-drive packages with optimized system performance and comprehensive automation integration supporting energy efficiency and operational reliability objectives. Siemens provides innovative motor solutions with emphasis on Industrie 4.0 integration and digital twin capabilities for predictive maintenance applications.
WEG delivers comprehensive motor portfolios with focus on energy efficiency and application versatility serving global industrial markets. Nidec offers advanced motor technologies with emphasis on precision control and compact designs, having opened a new manufacturing facility in Karnataka in 2025 focused on clean-energy and mobility components including inverter-ready motor platforms supporting localized supply for Asian markets. Regal Rexnord provides integrated motor-drive solutions with comprehensive industrial application coverage. TECO-Westinghouse specializes in heavy industrial motor applications with robust VFD-compatible designs. Toshiba emphasizes precision motor technologies for industrial automation applications. Leroy-Somer, part of Nidec, offers European market motor solutions with premium efficiency capabilities. Havells India focuses on Indian market industrial motor requirements with growing inverter duty offerings.
Inverter duty motors represent a critical energy efficiency technology segment within industrial automation and process control applications, projected to grow from USD 5.3 billion in 2025 to USD 16.6 billion by 2035 at a 12.1% CAGR. These specialized motor products-primarily laminated steel construction with enhanced insulation systems designed for VFD operation-serve as essential components in pump systems, fan applications, material handling equipment, and industrial process machinery where variable speed control, energy efficiency, and operational reliability under inverter-fed conditions are essential. Market expansion is driven by increasing energy efficiency regulations, growing industrial automation adoption, expanding VFD retrofit programs, and rising demand for digitally connected motor-drive systems across oil and gas, chemicals, manufacturing, water utilities, and food processing sectors.
How Industrial Energy Regulators and Standards Organizations Could Strengthen Efficiency Requirements and Market Development?
How Industry Associations and Engineering Organizations Could Advance Technology Standards and Application Best Practices?
How Inverter Duty Motor Manufacturers Could Drive Innovation and Market Leadership?
How Industrial End-Users and Plant Operators Could Optimize Motor System Performance and Energy Efficiency?
How System Integrators and Automation Specialists Could Enable Market Expansion?
How Research Institutions Could Enable Technology Advancement?
How Investors and Financial Enablers Could Support Market Growth and Innovation?
| Items | Values |
|---|---|
| Quantitative Units (2025) | USD 5.3 billion |
| Construction Material | Laminated Steel, Cast Iron, Aluminum |
| Application | Pumps, Fans, Conveyors, Extruders, Others |
| End User | Oil & Gas, Chemicals, Metal & Mining, Food & Beverage, Paper & Pulp, Others |
| Regions Covered | Asia Pacific, Europe, North America, Latin America, Middle East & Africa |
| Countries Covered | South Korea, Japan, United States, China, India, Germany, United Kingdom, and 40+ countries |
| Key Companies Profiled | ABB, Siemens, WEG, Nidec, Regal Rexnord, TECO-Westinghouse |
| Additional Attributes | Dollar sales by construction material, application, and end-user categories, regional demand trends, competitive landscape, technological advancements in insulation systems, premium efficiency development, digital connectivity integration, and energy optimization strategies |
The global inverter duty motor market is estimated to be valued at USD 5.3 billion in 2025.
The market size for the inverter duty motor market is projected to reach USD 16.6 billion by 2035.
The inverter duty motor market is expected to grow at a 12.1% CAGR between 2025 and 2035.
The key product types in inverter duty motor market are laminated steel, cast iron and aluminum.
In terms of application, pumps segment to command 52.0% share in the inverter duty motor market in 2025.


Full Research Suite comprises of:
Market outlook & trends analysis
Interviews & case studies
Strategic recommendations
Vendor profiles & capabilities analysis
5-year forecasts
8 regions and 60+ country-level data splits
Market segment data splits
12 months of continuous data updates
DELIVERED AS:
PDF EXCEL ONLINE
PV Inverter Market Analysis by Product, Phase, Connectivity, Nominal Power Output, Nominal Output Voltage, Application, and Region through 2035
Power Inverter Market Size and Share Forecast Outlook 2025 to 2035
Micro Inverter Market Size and Share Forecast Outlook 2025 to 2035
Solar Inverter Market Growth - Trends & Forecast 2025 to 2035
String Inverter Market Size and Share Forecast Outlook 2025 to 2035
Digital Inverter Market Report – Growth & Forecast 2017-2027
PV Micro Inverters Market Trends & Forecast 2025 to 2035
Portable Inverter Generators Market Analysis by Power Rating, Power Source, Application, and Region through 2035
Traction Inverter Market
String PV Inverter Market Size and Share Forecast Outlook 2025 to 2035
On Grid PV Inverter Market Size and Share Forecast Outlook 2025 to 2035
Solar Microinverter Market Analysis - Size, Share, and Forecast Outlook 2025 to 2035
Automotive Inverters Market
Three Phase Inverter Market Size and Share Forecast Outlook 2025 to 2035
EV Traction Inverter Market Size and Share Forecast Outlook 2025 to 2035
Standalone PV Inverter Market Size and Share Forecast Outlook 2025 to 2035
Decentralized Inverter Market by Product, Phase, Application, Nominal Output, Connection, Region through 2035
Single Phase PV Inverter Market Size and Share Forecast Outlook 2025 to 2035
Ambulance Power Inverter Market Growth - Trends & Forecast 2024 to 2034
Utility Scale PV Inverter Market Size and Share Forecast Outlook 2025 to 2035

Thank you!
You will receive an email from our Business Development Manager. Please be sure to check your SPAM/JUNK folder too.
Chat With
MaRIA