Job Description Management Software Market Size and Share Forecast Outlook (2023 to 2033)

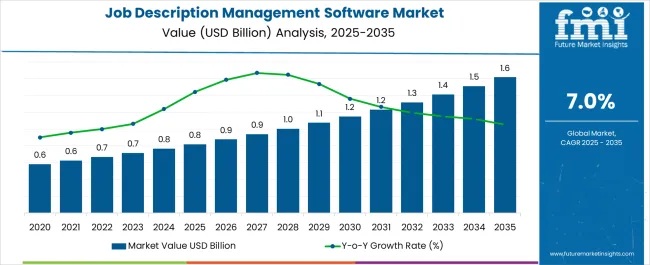
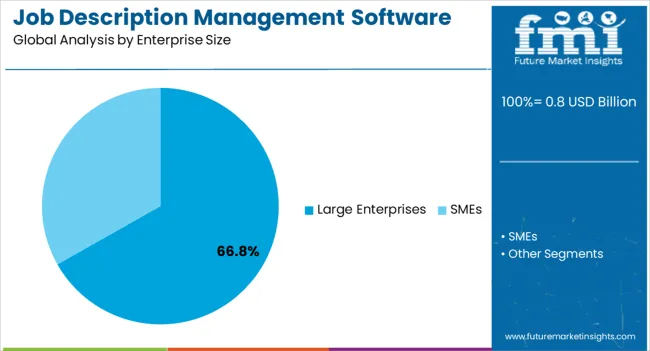
According to an analysis report by Future Market Insights, global sales of job description management software in 2023 were held at USD 709.9 million. With 7.4% projected growth from 2023 to 2033, the market is expected to reach a valuation of USD 1454.1 million by 2033. Large Enterprises are expected to be the highest revenue-generating segment in enterprise size, expected to account for a CAGR of 7.4% from 2023 to 2033.

The rise of the IT and telecommunications industries has prompted organizations to adopt cloud computing, resulting in the use of cloud-based job description software platforms. The International Trade Administration claims that 50% of enterprises with more than 1,000 users use Cloud Access Security Broker (CASB) products to monitor and manage their use of software as a service and other forms of public cloud.

Cloud computing has grown in popularity globally in recent years, owing to its increased flexibility and scalability, which has provided businesses with a well-organized CMS platform. With access control and notable security features, the software allows for better tracking of employees' progress and skills throughout their time in the company.

Some of the features of the job description management software platform chosen as a better way of convenience by organizations for their growth and development include improved plans, better employee details, and user-friendliness.

Artificial intelligence (AI) integration into job description management software is growing in popularity among businesses and recruitment agencies. Organizations can use AI-enabled job description management solutions to automate the recruitment process, increase the rate of quality hiring, and reduce the time spent on repetitive tasks.

AI technologies are responsible for reducing the overall cost of recruitment. As a result, rising AI adoption is expected to drive the job description management software market.

American Bar Association President Charlotte Burrows expressed hope that advances in technology may help reduce the social exclusion of individuals with disabilities at an American Bar Association event. Burrows pointed out that the disability scale used by some employers is virtually calculated to discriminate concerning access to jobs and education.

Attributes Details
Job Description Management Software Market Size (2023) USD 709.9 million
Global Job Description Management Software Market Size (2033) USD 1454.1 million
Global Job Description Management Software Market CAGR (2023 to 2033) 7.4%

Comparison of Revenue from 2018 to 2022 vs Forecast to 2033

As per the job description management software market research by Future Market Insights, from 2018 to 2022, the market value of the job description management software market increased by around 7.8 % CAGR. With an absolute dollar opportunity of USD 234 million, the market is projected to reach a valuation of USD 1.3 billion expanding at a CAGR of 7.2% from 2023 to 2033.

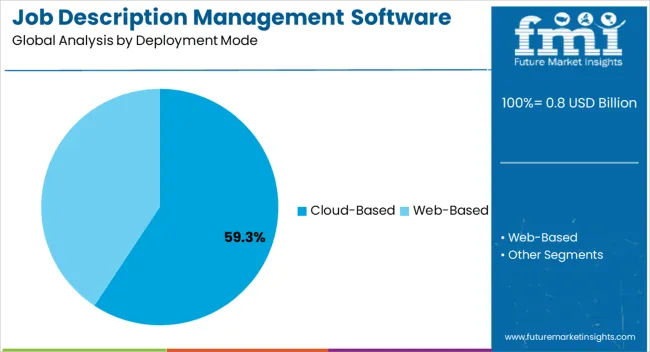
Businesses are increasingly adopting cloud-based deployment solutions due to technological advancements. As a result, vendors are developing job description management software that can be deployed via cloud platforms.

The demand for job description management software solutions and services has increased among small and medium-sized businesses due to the benefits such as flexibility, cost-effectiveness, and mobility.

North America’s Dominance in the Job Description Software Market

North America’s job description management software market is anticipated to experience significant growth during forecast periods. This market is typically explaining candidate and client activity with a web-based recruitment system, making it a handy choice for significantly and efficiently recruiting top-caliber talents.

As a result of introducing the software, job description management has been integrated with recruitment management, core HR, and talent management. On top of that, the software is used to manage personnel management, HRIS management, budgeting planning, labor tracking, and other tasks.
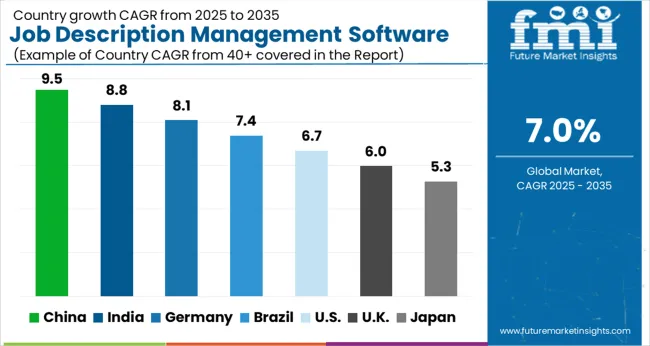
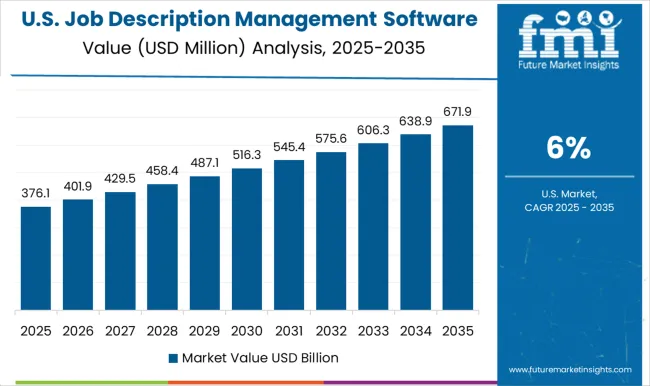
Analysis of Top Countries Using Job Description Management Platforms

The United States Lies at the Center Stage for Job Description Management Software Market Revenue

The United States dominated the job description management software Market in 2021, with a market size of USD 234 million. During the forecasted period, the job description management software industry's market in the country is expected to thrive at a 7% CAGR.

According to the United Nations Industrial Development Organization, new industrial economies grew by 3% in 2019 compared to 2018. As a result, job description management software applications are becoming popular in the growing end-user industries.

After China, the United States witnessed a 16.6% increase in global manufacturing output in 2018, according to the World Economic Forum. As the manufacturing sector expands, there is a demand for a CMS platform to manage and track the records of workers in these industries. This software application is in high demand in the Human Resource Department of a company to ensure an unaltered recruitment process.

Job description software ensures employee tracking related to their work and performance, which is why end users in the United States are adopting this software tool. These factors have fueled the CMS market's expansion in the country.

Category-wise Insights in the Job Description Management Software Market

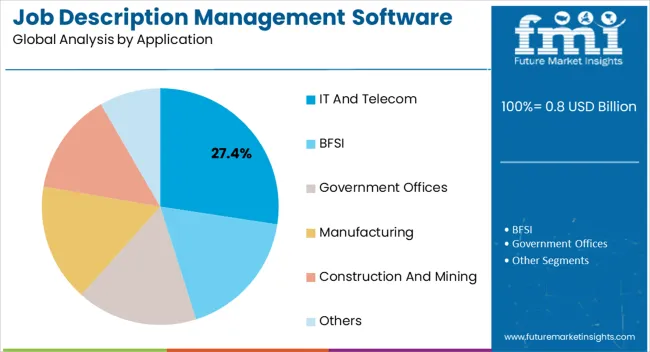
The job description management software market revenue through IT & Telecom Vertical is expected to increase significantly.

The IT & Telecom segment is likely to account for a significant share of the market during the forecast period due to the increased deployment of job description management software to enable enhanced client experience and benefits such as secure transactions and constant access to client databases. Further, because of the increasing importance of re-evaluating strategies and deploying advanced technologies in management processes, revenue through segment is expected to grow during the forecast period.

The Cloud-based Deployment for Job Description Management Software is Expected to Offer Significant Opportunities in the Market.

Based on deployment mode, in 2021, the Cloud-based deployment held the highest revenue share. Cloud based computing has become an important tool for businesses of all sizes in recent years. The cloud-based job description management software platform enables businesses to manage and track their recruitment, development, and retention processes.

Cloud-based job description software is widely used because of the increased demand for jobs around the world. This application allows HR personnel to track all resumes and candidates.
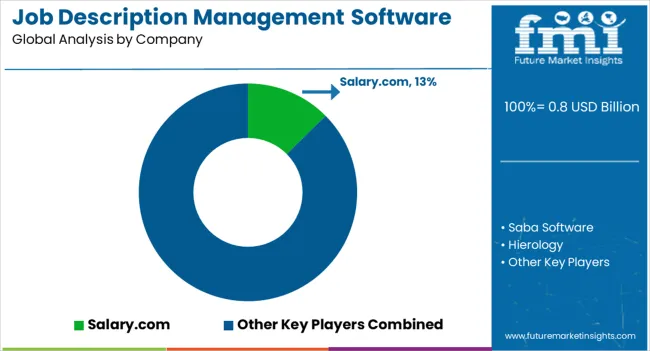
Competitive Landscape of the Job Description Software Market

Salary.com, Saba Software, Hierology, Insperity, Textio Hire, Human Resource Systems Group, JDXpert, and Hrizons LLC are among the leading providers of job description management software.

Recent Developments of Key Job Description Management Software Providers

  • In March 2022, Hireology and JM&A Group partnered to assist dealers in recruiting and retaining top talent. Together, the two organizations will assist dealers in hiring qualified talent more quickly, maintaining appropriate job descriptions, and ensuring that their growth and development continue throughout their employment.
  • Workfront, a provider of talent management software, announced a strategic agreement with Microsoft in June 2023, integrating their solution with Microsoft Teams and other Microsoft 365 applications.
  • CIPHR, a UK-based provider of people management software, purchased Eukleia, a digital learning and compliance software firm, in May 2023, expanding its offering in the learning and development market.
  • Eightfold AI raised USD 220 million in a Series E fundraising round headed by General Catalyst and SoftBank Vision Fund 2 in March 2023, valuing the company at USD 4 billion.
  • SAP completed its acquisition of Qualtrics, a leader in experience management software, in February 2023, merging experience data with personnel management capabilities.

Similarly, recent developments related to companies offering Job Description Management Software have been tracked by the team at Future Market Insights, which are available in the full report.

Top Segments Studied in the Job Description Management Software Market

By Deployment Mode:

  • Cloud-based
  • Web-based

By Enterprise Size:

  • Large Enterprises
  • SMEs

By Application:

  • IT and Telecom
  • BFSI
  • Government Offices
  • Manufacturing
  • Construction and Mining
  • Others

By Region:

  • North America
  • Latin America
  • Europe
  • APAC
  • The Middle East and Africa

Table of Content

  • 1. Executive Summary
  • 2. Market Overview
  • 3. Market Background
  • 4. Global Market Analysis 2018 to 2022 and Forecast 2023 to 2033
  • 5. Global Market Analysis 2018 to 2022 and Forecast 2023 to 2033, By Deployment Mode
    • 5.1. Cloud-based
    • 5.2. Web-based
  • 6. Global Market Analysis 2018 to 2022 and Forecast 2023 to 2033, By Enterprise Sizes
    • 6.1. Large Enterprises
    • 6.2. SMEs
  • 7. Global Market Analysis 2018 to 2022 and Forecast 2023 to 2033, By Application
    • 7.1. IT and Telecom
    • 7.2. BFSI
    • 7.3. Government Offices
    • 7.4. Manufacturing
    • 7.5. Construction and Mining
    • 7.6. Others
  • 8. Global Market Analysis 2018 to 2022 and Forecast 2023 to 2033, By Region
    • 8.1. North America
    • 8.2. Latin America
    • 8.3. Western Europe
    • 8.4. Eastern Europe
    • 8.5. South Asia and Pacific
    • 8.6. East Asia
    • 8.7. Middle East and Africa
  • 9. North America Market Analysis 2018 to 2022 and Forecast 2023 to 2033, By Country
  • 10. Latin America Market Analysis 2018 to 2022 and Forecast 2023 to 2033, By Country
  • 11. Western Europe Market Analysis 2018 to 2022 and Forecast 2023 to 2033, By Country
  • 12. Eastern Europe Market Analysis 2018 to 2022 and Forecast 2023 to 2033, By Country
  • 13. South Asia and Pacific Market Analysis 2018 to 2022 and Forecast 2023 to 2033, By Country
  • 14. East Asia Market Analysis 2018 to 2022 and Forecast 2023 to 2033, By Country
  • 15. Middle East and Africa Market Analysis 2018 to 2022 and Forecast 2023 to 2033, By Country
  • 16. Key Countries Market Analysis
  • 17. Market Structure Analysis
  • 18. Competition Analysis
    • 18.1. Salary.com
    • 18.2. Saba Software
    • 18.3. Hierology
    • 18.4. Insperity
    • 18.5. Hrizons LLC
    • 18.6. Textio Hire
    • 18.7. Human Resource Systems Group
    • 18.8. JDXpert
    • 18.9. Ongig
    • 18.10. TalVista
  • 19. Assumptions & Acronyms Used
  • 20. Research Methodology

List of Tables

Table 1: Global Market Value (US$ Million) Forecast by Region, 2018 to 2033

Table 2: Global Market Value (US$ Million) Forecast by Deployment Mode, 2018 to 2033

Table 3: Global Market Value (US$ Million) Forecast by Enterprise Sizes, 2018 to 2033

Table 4: Global Market Value (US$ Million) Forecast by Application, 2018 to 2033

Table 5: North America Market Value (US$ Million) Forecast by Country, 2018 to 2033

Table 6: North America Market Value (US$ Million) Forecast by Deployment Mode, 2018 to 2033

Table 7: North America Market Value (US$ Million) Forecast by Enterprise Sizes, 2018 to 2033

Table 8: North America Market Value (US$ Million) Forecast by Application, 2018 to 2033

Table 9: Latin America Market Value (US$ Million) Forecast by Country, 2018 to 2033

Table 10: Latin America Market Value (US$ Million) Forecast by Deployment Mode, 2018 to 2033

Table 11: Latin America Market Value (US$ Million) Forecast by Enterprise Sizes, 2018 to 2033

Table 12: Latin America Market Value (US$ Million) Forecast by Application, 2018 to 2033

Table 13: Western Europe Market Value (US$ Million) Forecast by Country, 2018 to 2033

Table 14: Western Europe Market Value (US$ Million) Forecast by Deployment Mode, 2018 to 2033

Table 15: Western Europe Market Value (US$ Million) Forecast by Enterprise Sizes, 2018 to 2033

Table 16: Western Europe Market Value (US$ Million) Forecast by Application, 2018 to 2033

Table 17: Eastern Europe Market Value (US$ Million) Forecast by Country, 2018 to 2033

Table 18: Eastern Europe Market Value (US$ Million) Forecast by Deployment Mode, 2018 to 2033

Table 19: Eastern Europe Market Value (US$ Million) Forecast by Enterprise Sizes, 2018 to 2033

Table 20: Eastern Europe Market Value (US$ Million) Forecast by Application, 2018 to 2033

Table 21: South Asia and Pacific Market Value (US$ Million) Forecast by Country, 2018 to 2033

Table 22: South Asia and Pacific Market Value (US$ Million) Forecast by Deployment Mode, 2018 to 2033

Table 23: South Asia and Pacific Market Value (US$ Million) Forecast by Enterprise Sizes, 2018 to 2033

Table 24: South Asia and Pacific Market Value (US$ Million) Forecast by Application, 2018 to 2033

Table 25: East Asia Market Value (US$ Million) Forecast by Country, 2018 to 2033

Table 26: East Asia Market Value (US$ Million) Forecast by Deployment Mode, 2018 to 2033

Table 27: East Asia Market Value (US$ Million) Forecast by Enterprise Sizes, 2018 to 2033

Table 28: East Asia Market Value (US$ Million) Forecast by Application, 2018 to 2033

Table 29: Middle East and Africa Market Value (US$ Million) Forecast by Country, 2018 to 2033

Table 30: Middle East and Africa Market Value (US$ Million) Forecast by Deployment Mode, 2018 to 2033

Table 31: Middle East and Africa Market Value (US$ Million) Forecast by Enterprise Sizes, 2018 to 2033

Table 32: Middle East and Africa Market Value (US$ Million) Forecast by Application, 2018 to 2033

List of Figures

Figure 1: Global Market Value (US$ Million) by Deployment Mode, 2023 to 2033

Figure 2: Global Market Value (US$ Million) by Enterprise Sizes, 2023 to 2033

Figure 3: Global Market Value (US$ Million) by Application, 2023 to 2033

Figure 4: Global Market Value (US$ Million) by Region, 2023 to 2033

Figure 5: Global Market Value (US$ Million) Analysis by Region, 2018 to 2033

Figure 6: Global Market Value Share (%) and BPS Analysis by Region, 2023 to 2033

Figure 7: Global Market Y-o-Y Growth (%) Projections by Region, 2023 to 2033

Figure 8: Global Market Value (US$ Million) Analysis by Deployment Mode, 2018 to 2033

Figure 9: Global Market Value Share (%) and BPS Analysis by Deployment Mode, 2023 to 2033

Figure 10: Global Market Y-o-Y Growth (%) Projections by Deployment Mode, 2023 to 2033

Figure 11: Global Market Value (US$ Million) Analysis by Enterprise Sizes, 2018 to 2033

Figure 12: Global Market Value Share (%) and BPS Analysis by Enterprise Sizes, 2023 to 2033

Figure 13: Global Market Y-o-Y Growth (%) Projections by Enterprise Sizes, 2023 to 2033

Figure 14: Global Market Value (US$ Million) Analysis by Application, 2018 to 2033

Figure 15: Global Market Value Share (%) and BPS Analysis by Application, 2023 to 2033

Figure 16: Global Market Y-o-Y Growth (%) Projections by Application, 2023 to 2033

Figure 17: Global Market Attractiveness by Deployment Mode, 2023 to 2033

Figure 18: Global Market Attractiveness by Enterprise Sizes, 2023 to 2033

Figure 19: Global Market Attractiveness by Application, 2023 to 2033

Figure 20: Global Market Attractiveness by Region, 2023 to 2033

Figure 21: North America Market Value (US$ Million) by Deployment Mode, 2023 to 2033

Figure 22: North America Market Value (US$ Million) by Enterprise Sizes, 2023 to 2033

Figure 23: North America Market Value (US$ Million) by Application, 2023 to 2033

Figure 24: North America Market Value (US$ Million) by Country, 2023 to 2033

Figure 25: North America Market Value (US$ Million) Analysis by Country, 2018 to 2033

Figure 26: North America Market Value Share (%) and BPS Analysis by Country, 2023 to 2033

Figure 27: North America Market Y-o-Y Growth (%) Projections by Country, 2023 to 2033

Figure 28: North America Market Value (US$ Million) Analysis by Deployment Mode, 2018 to 2033

Figure 29: North America Market Value Share (%) and BPS Analysis by Deployment Mode, 2023 to 2033

Figure 30: North America Market Y-o-Y Growth (%) Projections by Deployment Mode, 2023 to 2033

Figure 31: North America Market Value (US$ Million) Analysis by Enterprise Sizes, 2018 to 2033

Figure 32: North America Market Value Share (%) and BPS Analysis by Enterprise Sizes, 2023 to 2033

Figure 33: North America Market Y-o-Y Growth (%) Projections by Enterprise Sizes, 2023 to 2033

Figure 34: North America Market Value (US$ Million) Analysis by Application, 2018 to 2033

Figure 35: North America Market Value Share (%) and BPS Analysis by Application, 2023 to 2033

Figure 36: North America Market Y-o-Y Growth (%) Projections by Application, 2023 to 2033

Figure 37: North America Market Attractiveness by Deployment Mode, 2023 to 2033

Figure 38: North America Market Attractiveness by Enterprise Sizes, 2023 to 2033

Figure 39: North America Market Attractiveness by Application, 2023 to 2033

Figure 40: North America Market Attractiveness by Country, 2023 to 2033

Figure 41: Latin America Market Value (US$ Million) by Deployment Mode, 2023 to 2033

Figure 42: Latin America Market Value (US$ Million) by Enterprise Sizes, 2023 to 2033

Figure 43: Latin America Market Value (US$ Million) by Application, 2023 to 2033

Figure 44: Latin America Market Value (US$ Million) by Country, 2023 to 2033

Figure 45: Latin America Market Value (US$ Million) Analysis by Country, 2018 to 2033

Figure 46: Latin America Market Value Share (%) and BPS Analysis by Country, 2023 to 2033

Figure 47: Latin America Market Y-o-Y Growth (%) Projections by Country, 2023 to 2033

Figure 48: Latin America Market Value (US$ Million) Analysis by Deployment Mode, 2018 to 2033

Figure 49: Latin America Market Value Share (%) and BPS Analysis by Deployment Mode, 2023 to 2033

Figure 50: Latin America Market Y-o-Y Growth (%) Projections by Deployment Mode, 2023 to 2033

Figure 51: Latin America Market Value (US$ Million) Analysis by Enterprise Sizes, 2018 to 2033

Figure 52: Latin America Market Value Share (%) and BPS Analysis by Enterprise Sizes, 2023 to 2033

Figure 53: Latin America Market Y-o-Y Growth (%) Projections by Enterprise Sizes, 2023 to 2033

Figure 54: Latin America Market Value (US$ Million) Analysis by Application, 2018 to 2033

Figure 55: Latin America Market Value Share (%) and BPS Analysis by Application, 2023 to 2033

Figure 56: Latin America Market Y-o-Y Growth (%) Projections by Application, 2023 to 2033

Figure 57: Latin America Market Attractiveness by Deployment Mode, 2023 to 2033

Figure 58: Latin America Market Attractiveness by Enterprise Sizes, 2023 to 2033

Figure 59: Latin America Market Attractiveness by Application, 2023 to 2033

Figure 60: Latin America Market Attractiveness by Country, 2023 to 2033

Figure 61: Western Europe Market Value (US$ Million) by Deployment Mode, 2023 to 2033

Figure 62: Western Europe Market Value (US$ Million) by Enterprise Sizes, 2023 to 2033

Figure 63: Western Europe Market Value (US$ Million) by Application, 2023 to 2033

Figure 64: Western Europe Market Value (US$ Million) by Country, 2023 to 2033

Figure 65: Western Europe Market Value (US$ Million) Analysis by Country, 2018 to 2033

Figure 66: Western Europe Market Value Share (%) and BPS Analysis by Country, 2023 to 2033

Figure 67: Western Europe Market Y-o-Y Growth (%) Projections by Country, 2023 to 2033

Figure 68: Western Europe Market Value (US$ Million) Analysis by Deployment Mode, 2018 to 2033

Figure 69: Western Europe Market Value Share (%) and BPS Analysis by Deployment Mode, 2023 to 2033

Figure 70: Western Europe Market Y-o-Y Growth (%) Projections by Deployment Mode, 2023 to 2033

Figure 71: Western Europe Market Value (US$ Million) Analysis by Enterprise Sizes, 2018 to 2033

Figure 72: Western Europe Market Value Share (%) and BPS Analysis by Enterprise Sizes, 2023 to 2033

Figure 73: Western Europe Market Y-o-Y Growth (%) Projections by Enterprise Sizes, 2023 to 2033

Figure 74: Western Europe Market Value (US$ Million) Analysis by Application, 2018 to 2033

Figure 75: Western Europe Market Value Share (%) and BPS Analysis by Application, 2023 to 2033

Figure 76: Western Europe Market Y-o-Y Growth (%) Projections by Application, 2023 to 2033

Figure 77: Western Europe Market Attractiveness by Deployment Mode, 2023 to 2033

Figure 78: Western Europe Market Attractiveness by Enterprise Sizes, 2023 to 2033

Figure 79: Western Europe Market Attractiveness by Application, 2023 to 2033

Figure 80: Western Europe Market Attractiveness by Country, 2023 to 2033

Figure 81: Eastern Europe Market Value (US$ Million) by Deployment Mode, 2023 to 2033

Figure 82: Eastern Europe Market Value (US$ Million) by Enterprise Sizes, 2023 to 2033

Figure 83: Eastern Europe Market Value (US$ Million) by Application, 2023 to 2033

Figure 84: Eastern Europe Market Value (US$ Million) by Country, 2023 to 2033

Figure 85: Eastern Europe Market Value (US$ Million) Analysis by Country, 2018 to 2033

Figure 86: Eastern Europe Market Value Share (%) and BPS Analysis by Country, 2023 to 2033

Figure 87: Eastern Europe Market Y-o-Y Growth (%) Projections by Country, 2023 to 2033

Figure 88: Eastern Europe Market Value (US$ Million) Analysis by Deployment Mode, 2018 to 2033

Figure 89: Eastern Europe Market Value Share (%) and BPS Analysis by Deployment Mode, 2023 to 2033

Figure 90: Eastern Europe Market Y-o-Y Growth (%) Projections by Deployment Mode, 2023 to 2033

Figure 91: Eastern Europe Market Value (US$ Million) Analysis by Enterprise Sizes, 2018 to 2033

Figure 92: Eastern Europe Market Value Share (%) and BPS Analysis by Enterprise Sizes, 2023 to 2033

Figure 93: Eastern Europe Market Y-o-Y Growth (%) Projections by Enterprise Sizes, 2023 to 2033

Figure 94: Eastern Europe Market Value (US$ Million) Analysis by Application, 2018 to 2033

Figure 95: Eastern Europe Market Value Share (%) and BPS Analysis by Application, 2023 to 2033

Figure 96: Eastern Europe Market Y-o-Y Growth (%) Projections by Application, 2023 to 2033

Figure 97: Eastern Europe Market Attractiveness by Deployment Mode, 2023 to 2033

Figure 98: Eastern Europe Market Attractiveness by Enterprise Sizes, 2023 to 2033

Figure 99: Eastern Europe Market Attractiveness by Application, 2023 to 2033

Figure 100: Eastern Europe Market Attractiveness by Country, 2023 to 2033

Figure 101: South Asia and Pacific Market Value (US$ Million) by Deployment Mode, 2023 to 2033

Figure 102: South Asia and Pacific Market Value (US$ Million) by Enterprise Sizes, 2023 to 2033

Figure 103: South Asia and Pacific Market Value (US$ Million) by Application, 2023 to 2033

Figure 104: South Asia and Pacific Market Value (US$ Million) by Country, 2023 to 2033

Figure 105: South Asia and Pacific Market Value (US$ Million) Analysis by Country, 2018 to 2033

Figure 106: South Asia and Pacific Market Value Share (%) and BPS Analysis by Country, 2023 to 2033

Figure 107: South Asia and Pacific Market Y-o-Y Growth (%) Projections by Country, 2023 to 2033

Figure 108: South Asia and Pacific Market Value (US$ Million) Analysis by Deployment Mode, 2018 to 2033

Figure 109: South Asia and Pacific Market Value Share (%) and BPS Analysis by Deployment Mode, 2023 to 2033

Figure 110: South Asia and Pacific Market Y-o-Y Growth (%) Projections by Deployment Mode, 2023 to 2033

Figure 111: South Asia and Pacific Market Value (US$ Million) Analysis by Enterprise Sizes, 2018 to 2033

Figure 112: South Asia and Pacific Market Value Share (%) and BPS Analysis by Enterprise Sizes, 2023 to 2033

Figure 113: South Asia and Pacific Market Y-o-Y Growth (%) Projections by Enterprise Sizes, 2023 to 2033

Figure 114: South Asia and Pacific Market Value (US$ Million) Analysis by Application, 2018 to 2033

Figure 115: South Asia and Pacific Market Value Share (%) and BPS Analysis by Application, 2023 to 2033

Figure 116: South Asia and Pacific Market Y-o-Y Growth (%) Projections by Application, 2023 to 2033

Figure 117: South Asia and Pacific Market Attractiveness by Deployment Mode, 2023 to 2033

Figure 118: South Asia and Pacific Market Attractiveness by Enterprise Sizes, 2023 to 2033

Figure 119: South Asia and Pacific Market Attractiveness by Application, 2023 to 2033

Figure 120: South Asia and Pacific Market Attractiveness by Country, 2023 to 2033

Figure 121: East Asia Market Value (US$ Million) by Deployment Mode, 2023 to 2033

Figure 122: East Asia Market Value (US$ Million) by Enterprise Sizes, 2023 to 2033

Figure 123: East Asia Market Value (US$ Million) by Application, 2023 to 2033

Figure 124: East Asia Market Value (US$ Million) by Country, 2023 to 2033

Figure 125: East Asia Market Value (US$ Million) Analysis by Country, 2018 to 2033

Figure 126: East Asia Market Value Share (%) and BPS Analysis by Country, 2023 to 2033

Figure 127: East Asia Market Y-o-Y Growth (%) Projections by Country, 2023 to 2033

Figure 128: East Asia Market Value (US$ Million) Analysis by Deployment Mode, 2018 to 2033

Figure 129: East Asia Market Value Share (%) and BPS Analysis by Deployment Mode, 2023 to 2033

Figure 130: East Asia Market Y-o-Y Growth (%) Projections by Deployment Mode, 2023 to 2033

Figure 131: East Asia Market Value (US$ Million) Analysis by Enterprise Sizes, 2018 to 2033

Figure 132: East Asia Market Value Share (%) and BPS Analysis by Enterprise Sizes, 2023 to 2033

Figure 133: East Asia Market Y-o-Y Growth (%) Projections by Enterprise Sizes, 2023 to 2033

Figure 134: East Asia Market Value (US$ Million) Analysis by Application, 2018 to 2033

Figure 135: East Asia Market Value Share (%) and BPS Analysis by Application, 2023 to 2033

Figure 136: East Asia Market Y-o-Y Growth (%) Projections by Application, 2023 to 2033

Figure 137: East Asia Market Attractiveness by Deployment Mode, 2023 to 2033

Figure 138: East Asia Market Attractiveness by Enterprise Sizes, 2023 to 2033

Figure 139: East Asia Market Attractiveness by Application, 2023 to 2033

Figure 140: East Asia Market Attractiveness by Country, 2023 to 2033

Figure 141: Middle East and Africa Market Value (US$ Million) by Deployment Mode, 2023 to 2033

Figure 142: Middle East and Africa Market Value (US$ Million) by Enterprise Sizes, 2023 to 2033

Figure 143: Middle East and Africa Market Value (US$ Million) by Application, 2023 to 2033

Figure 144: Middle East and Africa Market Value (US$ Million) by Country, 2023 to 2033

Figure 145: Middle East and Africa Market Value (US$ Million) Analysis by Country, 2018 to 2033

Figure 146: Middle East and Africa Market Value Share (%) and BPS Analysis by Country, 2023 to 2033

Figure 147: Middle East and Africa Market Y-o-Y Growth (%) Projections by Country, 2023 to 2033

Figure 148: Middle East and Africa Market Value (US$ Million) Analysis by Deployment Mode, 2018 to 2033

Figure 149: Middle East and Africa Market Value Share (%) and BPS Analysis by Deployment Mode, 2023 to 2033

Figure 150: Middle East and Africa Market Y-o-Y Growth (%) Projections by Deployment Mode, 2023 to 2033

Figure 151: Middle East and Africa Market Value (US$ Million) Analysis by Enterprise Sizes, 2018 to 2033

Figure 152: Middle East and Africa Market Value Share (%) and BPS Analysis by Enterprise Sizes, 2023 to 2033

Figure 153: Middle East and Africa Market Y-o-Y Growth (%) Projections by Enterprise Sizes, 2023 to 2033

Figure 154: Middle East and Africa Market Value (US$ Million) Analysis by Application, 2018 to 2033

Figure 155: Middle East and Africa Market Value Share (%) and BPS Analysis by Application, 2023 to 2033

Figure 156: Middle East and Africa Market Y-o-Y Growth (%) Projections by Application, 2023 to 2033

Figure 157: Middle East and Africa Market Attractiveness by Deployment Mode, 2023 to 2033

Figure 158: Middle East and Africa Market Attractiveness by Enterprise Sizes, 2023 to 2033

Figure 159: Middle East and Africa Market Attractiveness by Application, 2023 to 2033

Figure 160: Middle East and Africa Market Attractiveness by Country, 2023 to 2033

Frequently Asked Questions

What is the Projected CAGR of the Job Description Management Software Market by 2033?

The projected CAGR of the Job Description Management Software Market by 2033 is 7.4%.

What is the Projected Job Description Management Software Market value by 2033?

The projected market value by 2033 is USD 1454.1 million.

What is the Current Job Description Management Software Market Valuation?

The market is estimated to secure a valuation of USD 709.9 million in 2023.

Which Industry is the Key Consumer of the Job Description Management Software Market?

The Human Resource(HR) industry is the key consumer of the Job Description Management Software Market.

What are the Opportunities in the Job Description Management Software Market?

The opportunities in the Job Description Management Software Market are increased Cloud-based, compliant, data-driven, AI- integrated solutions cater to gig economy.

Explore Similar Insights

Future Market Insights

Job Description Management Software Market