Jojoba Oil Market Size and Share Forecast Outlook From 2024 to 2034

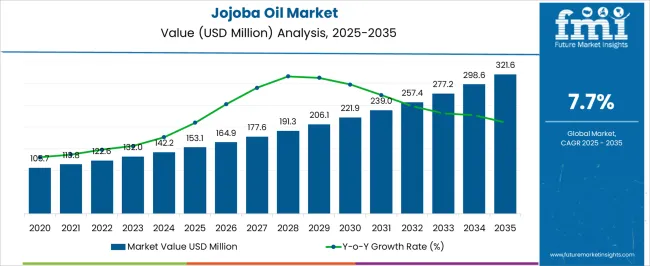
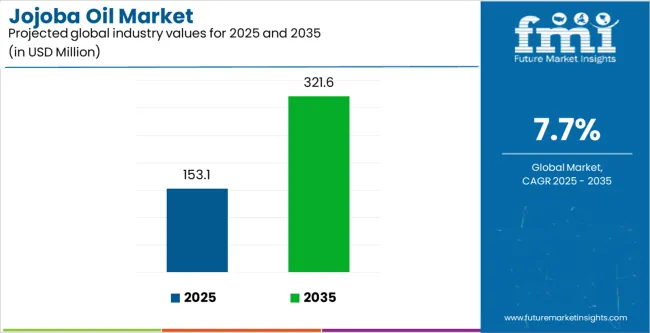
The jojoba oil market is projected to be worth USD 142.2 million in 2024. The market is anticipated to reach USD 298.0 million by 2034. The market is further expected to surge at a CAGR of 7.7% during the forecast period 2024 to 2034.

Key Market Trends and Highlights

There is an increasing demand for natural and organic products, including those containing jojoba oil, with the rise of specialty stores, online retailing, and health conscious consumers. The expansion of retail channels provides more opportunities for jojoba oil manufacturers and suppliers to reach consumers.

  • Innovations in extraction and processing technologies have improved the efficiency of jojoba oil production, making it more cost effective and accessible for manufacturers, which has contributed to the growth of the jojoba oil market by making it more competitive compared to other oils.
  • Jojoba oil is known for its benefits in hair care, including moisturizing the scalp, promoting hair growth, and reducing dandruff. The demand for jojoba oil in hair care formulations is expected to increase, as consumers seek natural alternatives to chemical laden hair products.
  • There is a growing emphasis on sustainable and ethical sourcing practices across industries. Suppliers of jojoba oil are increasingly expected to adhere to sustainable farming practices, fair trade principles, and environmentally friendly production methods. Brands that can demonstrate ethical sourcing of jojoba oil may gain a competitive edge in the market.
Attributes Key Insights
Jojoba Oil Market Estimated Size in 2024 USD 142.2 million
Projected Market Value in 2034 USD 298.0 million
Value-based CAGR from 2024 to 2034 7.7%

Sales Trend Analysis from 2019 to 2023 Compared to Market Outlook for 2024 to 2034

The scope for jojoba oil rose at a 9.2% CAGR between 2019 and 2023. The global market for jojoba oil is anticipated to grow at a moderate CAGR of 7.7% over the forecast period 2024 to 2034.

The market experienced steady growth during the historical period from 2019 to 2023, driven by increasing consumer awareness of natural and organic skincare products. Rising demand for jojoba oil in cosmetics, personal care products, and aromatherapy also contributed to market expansion during this period.

Growing interest in DIY beauty and wellness solutions fueled demand for jojoba oil as a versatile ingredient for homemade formulations. The clean beauty movement and preference for sustainable, ethically sourced ingredients further propelled the adoption of jojoba oil in skincare and haircare products.

Technological advancements in extraction and processing methods improved the efficiency and quality of jojoba oil production, making it more accessible to manufacturers and consumers.

Looking ahead to the forecast period from 2024 to 2034, the market is expected to witness significant growth. Continued growth of the jojoba oil market is anticipated as consumer demand for natural, plant based skincare ingredients persists. Expansion into emerging markets, particularly in Asia Pacific and Latin America, presents opportunities for market penetration and growth.

Innovation in product formulations, packaging, and distribution channels is anticipated to augment the market competitiveness and consumer engagement. Increasing adoption of jojoba oil in male grooming products and nutraceutical supplements diversifies market applications and revenue streams.

Collaboration and partnerships across industries enable market players to leverage synergies and explore new opportunities for product development and market expansion. Regulatory compliance and certification standards remain crucial for maintaining product quality, safety, and consumer trust in the jojoba oil market.

Key Growth Drivers for the Jojoba Oil Market

  • Consumers are becoming more conscious about the ingredients in their skincare and haircare products. Jojoba oil, being a natural and organic ingredient, has gained popularity as an alternative to synthetic oils.
  • Jojoba oil is known for its various skincare benefits, such as moisturizing properties, anti inflammatory effects, and its similarity to human sebum. The demand for jojoba oil in skincare products increases, as people become more aware of these benefits.
  • The cosmetics and personal care industry continues to expand globally, driven by factors like urbanization, increasing disposable income, and changing lifestyles. Jojoba oil finds extensive usage in cosmetics and personal care products, including moisturizers, lip balms, hair conditioners, and massage oils.
  • Jojoba oil is widely used in aromatherapy and spa treatments due to its therapeutic properties and its ability to blend well with essential oils. The increasing popularity of wellness practices has contributed to the growth of jojoba oil in this sector.

Factors Restraining the Demand for Jojoba Oil

Jojoba oil production is subject to various factors such as climate conditions, pests, and agricultural practices. Fluctuations in supply due to these factors can affect market stability and pricing, impacting both suppliers and manufacturers.

  • While jojoba oil offers unique properties and benefits, it faces competition from other natural oils such as argan oil, coconut oil, and almond oil. Manufacturers and consumers may opt for alternative oils based on factors like availability, price, and perceived efficacy, which can limit the growth of the jojoba oil market.
  • The price of jojoba oil is influenced by factors like production levels, global demand, and currency fluctuations. Price volatility can pose challenges for manufacturers in terms of production costs and pricing strategies, potentially impacting market growth and profitability.
  • Despite its benefits, jojoba oil may still be relatively unknown to some consumers, particularly in emerging markets. Limited awareness and education about the properties and uses of jojoba oil is expected to constrain market growth by limiting demand and market penetration.

Analysis of Top Countries Producing and Exporting Jojoba Oil

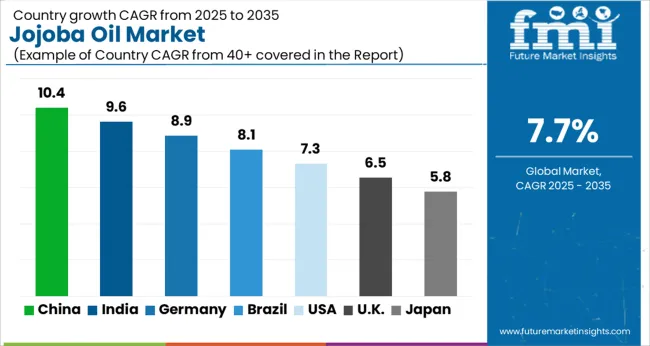
The below table showcases revenues in terms of the top 5 leading countries, spearheaded by China and the United Kingdom. The countries are expected to lead the market through 2034.

Countries Forecast CAGRs from 2024 to 2034
The United States 7.9%
China 13.4%
The United Kingdom 9.2%
Japan 8.4%
Korea 8.7%

Increasing Demand for Natural and Organic Products Driving the Market in the United States

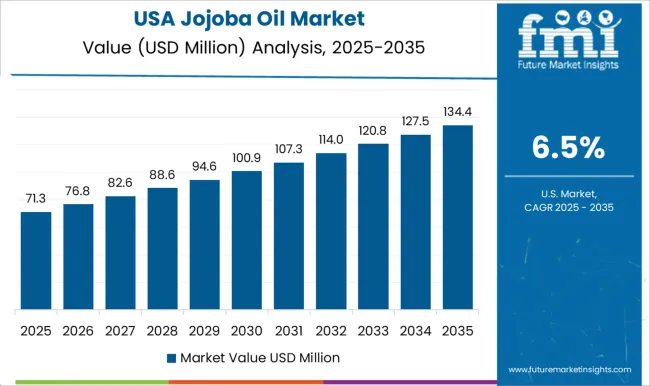
The jojoba oil market in the United States expected to expand at a CAGR of 7.9% through 2034. Consumers in the country are increasingly seeking natural and organic alternatives in their skincare, haircare, and personal care products. Jojoba oil, being a natural and plant based ingredient, aligns well with this trend. Its versatility and beneficial properties make it a popular choice for consumers looking for clean and sustainable beauty solutions.

Jojoba oil is known for its moisturizing, nourishing, and soothing properties, making it suitable for a variety of skincare applications. The demand for products containing jojoba oil is expected to grow, as consumers become more educated about skincare ingredients and their benefits.

The ability of Jojoba oil to mimic the natural oils of skin and its non comedogenic properties make it particularly attractive for individuals with sensitive or acne prone skin.

Expansion of Natural Beauty Industry to Accelerate Market Growth in the United Kingdom

The jojoba oil market in the United Kingdom is anticipated to expand at a CAGR of 9.2% through 2034.The natural beauty market in the United Kingdom is expanding rapidly, driven by increasing consumer awareness of ingredient safety, concerns about synthetic chemicals, and the desire for sustainable products.

Jojoba oil, with its natural origin and minimal processing, is well suited to capitalize on this trend. Manufacturers and retailers are introducing more products containing jojoba oil to meet the demand for natural and organic beauty solutions. Companies in the United Kingdom are innovating with new product formulations and incorporating jojoba oil into a wide range of skincare, haircare, and cosmetic products.

From cleansers and moisturizers to hair serums and beard oils, jojoba oil adds value as a versatile and effective ingredient. Its compatibility with other ingredients and its ability to enhance product performance drive its inclusion in various formulations, contributing to market growth.

Influence of Western Beauty Trends Spearhead the Market in China

Jojoba oil trends in China are taking a turn for the better. A 13.4% CAGR is forecast for the country from 2024 to 2034. The influence of Western beauty trends is shaping consumer preferences in China, with more consumers seeking products that align with global beauty standards.

Jojoba oil, which is widely recognized in Western markets for its skincare benefits, is gaining popularity among Chinese consumers looking for effective and innovative beauty ingredients.

The Chinese skincare market is witnessing significant growth, driven by increasing focus of consumers on skincare and anti-aging solutions. The moisturizing, nourishing, and anti-aging properties of Jojoba oil make it a desirable ingredient in skincare products targeting hydration, rejuvenation, and wrinkle reduction.
Social Media Fueling the Market in Japan

The jojoba oil market in Japan is poised to expand at a CAGR of 8.4% through 2034. Influencers, beauty bloggers, and social media platforms play a significant role in shaping consumer preferences and driving product trends in beauty market in Japan.

Jojoba oil has received positive attention from influencers and skincare experts for its nourishing and therapeutic properties. Endorsements and recommendations from influencers help raise awareness and generate interest in jojoba oil based products among Japanese consumers.

The availability of jojoba oil products through various distribution channels, including online retailers, specialty beauty stores, department stores, and drugstores, makes it accessible to consumers across Japan.

Manufacturers and retailers are expanding their distribution networks to reach new customers and capitalize on the growing demand for natural and premium beauty products, driving the growth of the jojoba oil market in Japan.
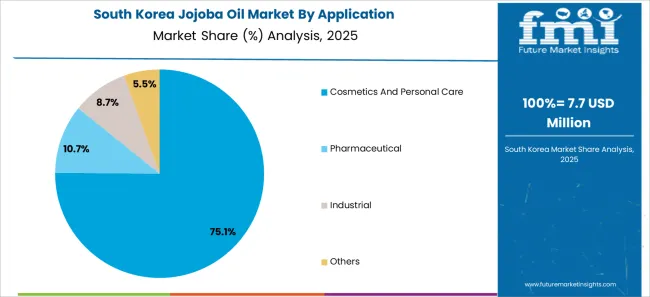
Preference for Lightweight and Non Greasy Formulations Driving the Demand in Korea

The jojoba oil market in Korea is anticipated to expand at a CAGR of 8.7% through 2034. Korean consumers favor lightweight and non greasy skincare formulations that absorb quickly into the skin without leaving a heavy or sticky residue.

The light texture and fast absorbing nature of Jojoba oil make it an ideal ingredient in moisturizers, serums, and essences designed for the Korean skincare routine. Its ability to provide intense hydration without feeling greasy appeals to consumers with oily or combination skin types.

Anti-pollution skincare has become a prominent trend in Korea, with growing concerns about environmental pollution and its impact on skin health. The protective properties of Jojoba oil help form a barrier on the surface of the skin, shielding it from environmental pollutants, free radicals, and UV radiation. Skincare products containing jojoba oil are marketed as effective solutions for combating pollution related skin damage and premature aging.

Jojoba Oil Industry Analysis by Top Investment Segments

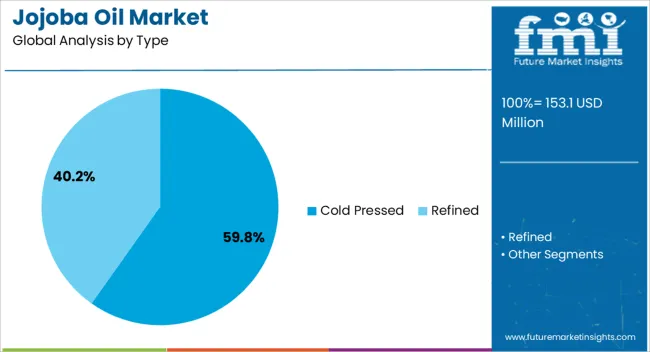
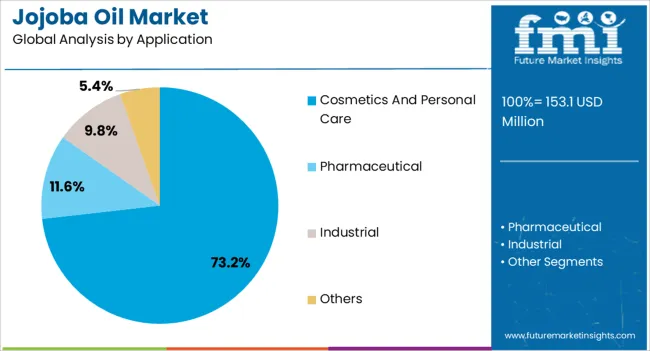
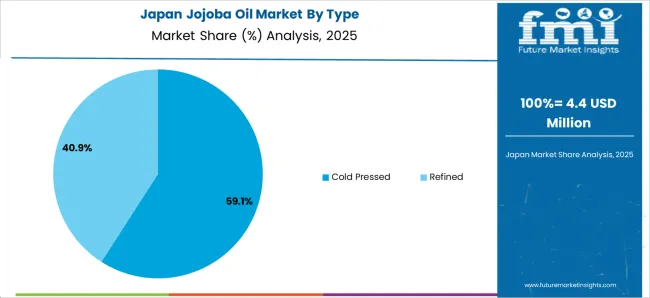
The below table highlights how cold pressed segment is projected to lead the market in terms of type, and is expected to account for a CAGR of 7.5% through 2034. Based on application, the cosmetics and personal care segment is expected to account for a CAGR of 7.4% through 2034.

Category CAGR through 2034
Cold Pressed 7.5%
Cosmetics and Personal Care 7.4%

Cold Pressed Claims High Demand for Jojoba Oil

Based on type, the cold pressed segment is expected to continue dominating the jojoba oil market. Cold pressed extraction involves pressing the jojoba seeds at low temperatures, typically below 120 degrees Fahrenheit, to extract the oil.

The gentle extraction process helps preserve the natural nutritional content of jojoba oil, including vitamins, minerals, and antioxidants. Consumers perceive cold pressed jojoba oil as a higher quality product with superior nutritional benefits, driving demand for this segment.

Cold pressed jojoba oil retains the natural aroma and flavor of the jojoba seeds, resulting in a more robust and authentic sensory experience compared to oils extracted using heat or chemicals. The distinct aroma and flavor profile of cold pressed jojoba oil appeal to consumers seeking premium and gourmet ingredients for culinary and cosmetic applications.

Cosmetics and Personal Care Segment to Hold High Demand for Jojoba Oil

In terms of application, the cosmetics and personal care segment is expected to continue dominating the jojoba oil market. Jojoba oil is known for its exceptional moisturizing properties and its ability to mimic the natural sebum of skin. It penetrates deeply into the skin without clogging pores, making it suitable for all skin types, including oily and acne prone skin. The demand for moisturizing skincare products containing jojoba oil is driven by consumers seeking hydration, nourishment, and protection for their skin.

Jojoba oil possesses anti-inflammatory properties that help soothe and calm irritated or sensitive skin. It is commonly used in skincare formulations designed to alleviate redness, inflammation, and irritation caused by environmental stressors, allergies, or skin conditions such as eczema and psoriasis. The anti-inflammatory properties of jojoba oil contribute to its popularity in cosmetics and personal care products targeting sensitive or reactive skin.
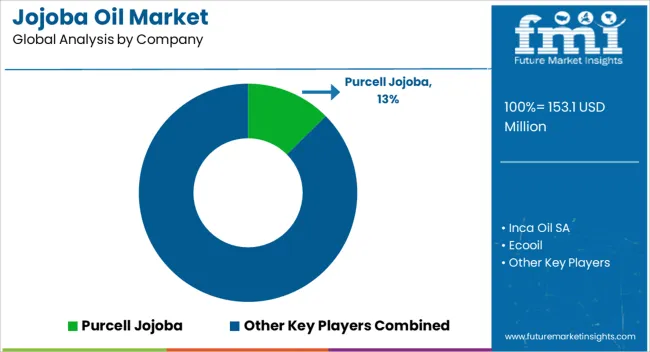
Leading Suppliers in the Jojoba Oil Sector

The competitive landscape of the jojoba oil market is characterized by several key players, ranging from large multinational corporations to small scale producers and distributors. The companies compete based on product quality, innovation, pricing, distribution networks, and marketing strategies.

Company Portfolio

  • Purcell Jojoba International is a major supplier of jojoba oil and jojoba based products to the cosmetics and personal care industry. The company focuses on product quality, purity, and customer satisfaction.
  • EcoOil is known for its commitment to sustainable and eco-friendly jojoba oil production. The company emphasizes ethical sourcing, environmental stewardship, and social responsibility in its operations.

Scope and Coverage of the Jojoba Oil Market Report

Attribute Details
Estimated Market Size in 2024 USD 142.2 million
Projected Market Valuation in 2034 USD 298.0 million
Value-based CAGR 2024 to 2034 7.7%
Forecast Period 2024 to 2034
Historical Data Available for 2019 to 2023
Market Analysis Value in USD million
Key Regions Covered North America; Latin America; Western Europe; Eastern Europe; South Asia and Pacific; East Asia; The Middle East & Africa
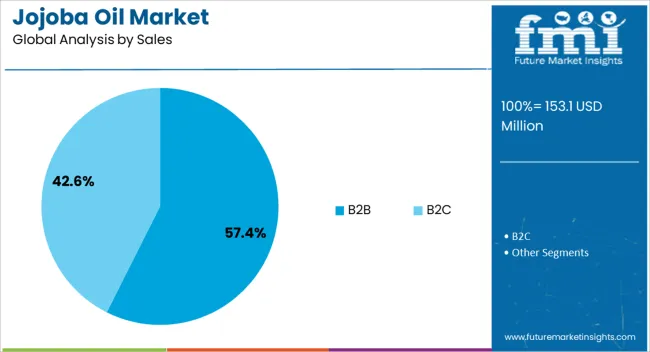
Key Market Segments Covered Type, Application, Sales, Region
Key Countries Profiled The United States, Canada, Brazil, Mexico, Germany, France, France, Spain, Italy, Russia, Poland, Czech Republic, Romania, India, Bangladesh, Australia, New Zealand, China, Japan, South Korea, GCC countries, South Africa, Israel
Key Companies Profiled Purcell Jojoba; Inca Oil SA; Ecooil;ConnOils LLC; Jojoba Naturals; JD Jojoba Desert; Hallstar; Nutrix International LLC; USA Organic Group Corp; OPW Ingredients GmbH

Top Segments Studied in the Jojoba Oil Market

By Type:

  • Cold Pressed
  • Refined

By Application:

  • Cosmetics and Personal Care
  • Pharmaceutical
  • Industrial
  • Others

By Sales:

  • B2B
  • B2C

By Region:

  • North America
  • Latin America
  • Western Europe
  • Eastern Europe
  • South Asia and Pacific
  • East Asia
  • The Middle East and Africa

Table of Content

  • 1. Executive Summary
  • 2. Market Overview
  • 3. Market Background
  • 4. Global Market Analysis 2019 to 2023 and Forecast, 2024 to 2034
  • 5. Global Market Analysis 2019 to 2023 and Forecast 2024 to 2034, By Type
    • 5.1. Cold-pressed
    • 5.2. Refined
  • 6. Global Market Analysis 2019 to 2023 and Forecast 2024 to 2034, By Application
    • 6.1. Cosmetics & Personal Care
    • 6.2. Pharmaceutical
    • 6.3. Industrial
    • 6.4. Others
  • 7. Global Market Analysis 2019 to 2023 and Forecast 2024 to 2034, By Sales
    • 7.1. B2B
    • 7.2. B2C
  • 8. Global Market Analysis 2019 to 2023 and Forecast 2024 to 2034, By Region
    • 8.1. North America
    • 8.2. Latin America
    • 8.3. Western Europe
    • 8.4. Eastern Europe
    • 8.5. South Asia and Pacific
    • 8.6. East Asia
    • 8.7. Middle East and Africa
  • 9. North America Market Analysis 2019 to 2023 and Forecast 2024 to 2034, By Country
  • 10. Latin America Market Analysis 2019 to 2023 and Forecast 2024 to 2034, By Country
  • 11. Western Europe Market Analysis 2019 to 2023 and Forecast 2024 to 2034, By Country
  • 12. Eastern Europe Market Analysis 2019 to 2023 and Forecast 2024 to 2034, By Country
  • 13. South Asia and Pacific Market Analysis 2019 to 2023 and Forecast 2024 to 2034, By Country
  • 14. East Asia Market Analysis 2019 to 2023 and Forecast 2024 to 2034, By Country
  • 15. Middle East and Africa Market Analysis 2019 to 2023 and Forecast 2024 to 2034, By Country
  • 16. Key Countries Market Analysis
  • 17. Market Structure Analysis
  • 18. Competition Analysis
    • 18.1. Purcell Jojoba
    • 18.2. Inca Oil SA
    • 18.3. Ecooil
    • 18.4. ConnOils LLC
    • 18.5. Jojoba Naturals
    • 18.6. JD Jojoba Desert
    • 18.7. Hallstar
    • 18.8. Nutrix International LLC
    • 18.9. US Organic Group Corp
    • 18.10. OPW Ingredients GmbH
  • 19. Assumptions & Acronyms Used
  • 20. Research Methodology

List of Tables

Table 1: Global Market Value (US$ Million) Forecast by Region, 2019 to 2034

Table 2: Global Market Volume (Tons) Forecast by Region, 2019 to 2034

Table 3: Global Market Value (US$ Million) Forecast by Type, 2019 to 2034

Table 4: Global Market Volume (Tons) Forecast by Type, 2019 to 2034

Table 5: Global Market Value (US$ Million) Forecast by Application, 2019 to 2034

Table 6: Global Market Volume (Tons) Forecast by Application, 2019 to 2034

Table 7: Global Market Value (US$ Million) Forecast by Sales, 2019 to 2034

Table 8: Global Market Volume (Tons) Forecast by Sales, 2019 to 2034

Table 9: North America Market Value (US$ Million) Forecast by Country, 2019 to 2034

Table 10: North America Market Volume (Tons) Forecast by Country, 2019 to 2034

Table 11: North America Market Value (US$ Million) Forecast by Type, 2019 to 2034

Table 12: North America Market Volume (Tons) Forecast by Type, 2019 to 2034

Table 13: North America Market Value (US$ Million) Forecast by Application, 2019 to 2034

Table 14: North America Market Volume (Tons) Forecast by Application, 2019 to 2034

Table 15: North America Market Value (US$ Million) Forecast by Sales, 2019 to 2034

Table 16: North America Market Volume (Tons) Forecast by Sales, 2019 to 2034

Table 17: Latin America Market Value (US$ Million) Forecast by Country, 2019 to 2034

Table 18: Latin America Market Volume (Tons) Forecast by Country, 2019 to 2034

Table 19: Latin America Market Value (US$ Million) Forecast by Type, 2019 to 2034

Table 20: Latin America Market Volume (Tons) Forecast by Type, 2019 to 2034

Table 21: Latin America Market Value (US$ Million) Forecast by Application, 2019 to 2034

Table 22: Latin America Market Volume (Tons) Forecast by Application, 2019 to 2034

Table 23: Latin America Market Value (US$ Million) Forecast by Sales, 2019 to 2034

Table 24: Latin America Market Volume (Tons) Forecast by Sales, 2019 to 2034

Table 25: Western Europe Market Value (US$ Million) Forecast by Country, 2019 to 2034

Table 26: Western Europe Market Volume (Tons) Forecast by Country, 2019 to 2034

Table 27: Western Europe Market Value (US$ Million) Forecast by Type, 2019 to 2034

Table 28: Western Europe Market Volume (Tons) Forecast by Type, 2019 to 2034

Table 29: Western Europe Market Value (US$ Million) Forecast by Application, 2019 to 2034

Table 30: Western Europe Market Volume (Tons) Forecast by Application, 2019 to 2034

Table 31: Western Europe Market Value (US$ Million) Forecast by Sales, 2019 to 2034

Table 32: Western Europe Market Volume (Tons) Forecast by Sales, 2019 to 2034

Table 33: Eastern Europe Market Value (US$ Million) Forecast by Country, 2019 to 2034

Table 34: Eastern Europe Market Volume (Tons) Forecast by Country, 2019 to 2034

Table 35: Eastern Europe Market Value (US$ Million) Forecast by Type, 2019 to 2034

Table 36: Eastern Europe Market Volume (Tons) Forecast by Type, 2019 to 2034

Table 37: Eastern Europe Market Value (US$ Million) Forecast by Application, 2019 to 2034

Table 38: Eastern Europe Market Volume (Tons) Forecast by Application, 2019 to 2034

Table 39: Eastern Europe Market Value (US$ Million) Forecast by Sales, 2019 to 2034

Table 40: Eastern Europe Market Volume (Tons) Forecast by Sales, 2019 to 2034

Table 41: South Asia and Pacific Market Value (US$ Million) Forecast by Country, 2019 to 2034

Table 42: South Asia and Pacific Market Volume (Tons) Forecast by Country, 2019 to 2034

Table 43: South Asia and Pacific Market Value (US$ Million) Forecast by Type, 2019 to 2034

Table 44: South Asia and Pacific Market Volume (Tons) Forecast by Type, 2019 to 2034

Table 45: South Asia and Pacific Market Value (US$ Million) Forecast by Application, 2019 to 2034

Table 46: South Asia and Pacific Market Volume (Tons) Forecast by Application, 2019 to 2034

Table 47: South Asia and Pacific Market Value (US$ Million) Forecast by Sales, 2019 to 2034

Table 48: South Asia and Pacific Market Volume (Tons) Forecast by Sales, 2019 to 2034

Table 49: East Asia Market Value (US$ Million) Forecast by Country, 2019 to 2034

Table 50: East Asia Market Volume (Tons) Forecast by Country, 2019 to 2034

Table 51: East Asia Market Value (US$ Million) Forecast by Type, 2019 to 2034

Table 52: East Asia Market Volume (Tons) Forecast by Type, 2019 to 2034

Table 53: East Asia Market Value (US$ Million) Forecast by Application, 2019 to 2034

Table 54: East Asia Market Volume (Tons) Forecast by Application, 2019 to 2034

Table 55: East Asia Market Value (US$ Million) Forecast by Sales, 2019 to 2034

Table 56: East Asia Market Volume (Tons) Forecast by Sales, 2019 to 2034

Table 57: Middle East and Africa Market Value (US$ Million) Forecast by Country, 2019 to 2034

Table 58: Middle East and Africa Market Volume (Tons) Forecast by Country, 2019 to 2034

Table 59: Middle East and Africa Market Value (US$ Million) Forecast by Type, 2019 to 2034

Table 60: Middle East and Africa Market Volume (Tons) Forecast by Type, 2019 to 2034

Table 61: Middle East and Africa Market Value (US$ Million) Forecast by Application, 2019 to 2034

Table 62: Middle East and Africa Market Volume (Tons) Forecast by Application, 2019 to 2034

Table 63: Middle East and Africa Market Value (US$ Million) Forecast by Sales, 2019 to 2034

Table 64: Middle East and Africa Market Volume (Tons) Forecast by Sales, 2019 to 2034

List of Figures

Figure 1: Global Market Value (US$ Million) by Type, 2024 to 2034

Figure 2: Global Market Value (US$ Million) by Application, 2024 to 2034

Figure 3: Global Market Value (US$ Million) by Sales, 2024 to 2034

Figure 4: Global Market Value (US$ Million) by Region, 2024 to 2034

Figure 5: Global Market Value (US$ Million) Analysis by Region, 2019 to 2034

Figure 6: Global Market Volume (Tons) Analysis by Region, 2019 to 2034

Figure 7: Global Market Value Share (%) and BPS Analysis by Region, 2024 to 2034

Figure 8: Global Market Y-o-Y Growth (%) Projections by Region, 2024 to 2034

Figure 9: Global Market Value (US$ Million) Analysis by Type, 2019 to 2034

Figure 10: Global Market Volume (Tons) Analysis by Type, 2019 to 2034

Figure 11: Global Market Value Share (%) and BPS Analysis by Type, 2024 to 2034

Figure 12: Global Market Y-o-Y Growth (%) Projections by Type, 2024 to 2034

Figure 13: Global Market Value (US$ Million) Analysis by Application, 2019 to 2034

Figure 14: Global Market Volume (Tons) Analysis by Application, 2019 to 2034

Figure 15: Global Market Value Share (%) and BPS Analysis by Application, 2024 to 2034

Figure 16: Global Market Y-o-Y Growth (%) Projections by Application, 2024 to 2034

Figure 17: Global Market Value (US$ Million) Analysis by Sales, 2019 to 2034

Figure 18: Global Market Volume (Tons) Analysis by Sales, 2019 to 2034

Figure 19: Global Market Value Share (%) and BPS Analysis by Sales, 2024 to 2034

Figure 20: Global Market Y-o-Y Growth (%) Projections by Sales, 2024 to 2034

Figure 21: Global Market Attractiveness by Type, 2024 to 2034

Figure 22: Global Market Attractiveness by Application, 2024 to 2034

Figure 23: Global Market Attractiveness by Sales, 2024 to 2034

Figure 24: Global Market Attractiveness by Region, 2024 to 2034

Figure 25: North America Market Value (US$ Million) by Type, 2024 to 2034

Figure 26: North America Market Value (US$ Million) by Application, 2024 to 2034

Figure 27: North America Market Value (US$ Million) by Sales, 2024 to 2034

Figure 28: North America Market Value (US$ Million) by Country, 2024 to 2034

Figure 29: North America Market Value (US$ Million) Analysis by Country, 2019 to 2034

Figure 30: North America Market Volume (Tons) Analysis by Country, 2019 to 2034

Figure 31: North America Market Value Share (%) and BPS Analysis by Country, 2024 to 2034

Figure 32: North America Market Y-o-Y Growth (%) Projections by Country, 2024 to 2034

Figure 33: North America Market Value (US$ Million) Analysis by Type, 2019 to 2034

Figure 34: North America Market Volume (Tons) Analysis by Type, 2019 to 2034

Figure 35: North America Market Value Share (%) and BPS Analysis by Type, 2024 to 2034

Figure 36: North America Market Y-o-Y Growth (%) Projections by Type, 2024 to 2034

Figure 37: North America Market Value (US$ Million) Analysis by Application, 2019 to 2034

Figure 38: North America Market Volume (Tons) Analysis by Application, 2019 to 2034

Figure 39: North America Market Value Share (%) and BPS Analysis by Application, 2024 to 2034

Figure 40: North America Market Y-o-Y Growth (%) Projections by Application, 2024 to 2034

Figure 41: North America Market Value (US$ Million) Analysis by Sales, 2019 to 2034

Figure 42: North America Market Volume (Tons) Analysis by Sales, 2019 to 2034

Figure 43: North America Market Value Share (%) and BPS Analysis by Sales, 2024 to 2034

Figure 44: North America Market Y-o-Y Growth (%) Projections by Sales, 2024 to 2034

Figure 45: North America Market Attractiveness by Type, 2024 to 2034

Figure 46: North America Market Attractiveness by Application, 2024 to 2034

Figure 47: North America Market Attractiveness by Sales, 2024 to 2034

Figure 48: North America Market Attractiveness by Country, 2024 to 2034

Figure 49: Latin America Market Value (US$ Million) by Type, 2024 to 2034

Figure 50: Latin America Market Value (US$ Million) by Application, 2024 to 2034

Figure 51: Latin America Market Value (US$ Million) by Sales, 2024 to 2034

Figure 52: Latin America Market Value (US$ Million) by Country, 2024 to 2034

Figure 53: Latin America Market Value (US$ Million) Analysis by Country, 2019 to 2034

Figure 54: Latin America Market Volume (Tons) Analysis by Country, 2019 to 2034

Figure 55: Latin America Market Value Share (%) and BPS Analysis by Country, 2024 to 2034

Figure 56: Latin America Market Y-o-Y Growth (%) Projections by Country, 2024 to 2034

Figure 57: Latin America Market Value (US$ Million) Analysis by Type, 2019 to 2034

Figure 58: Latin America Market Volume (Tons) Analysis by Type, 2019 to 2034

Figure 59: Latin America Market Value Share (%) and BPS Analysis by Type, 2024 to 2034

Figure 60: Latin America Market Y-o-Y Growth (%) Projections by Type, 2024 to 2034

Figure 61: Latin America Market Value (US$ Million) Analysis by Application, 2019 to 2034

Figure 62: Latin America Market Volume (Tons) Analysis by Application, 2019 to 2034

Figure 63: Latin America Market Value Share (%) and BPS Analysis by Application, 2024 to 2034

Figure 64: Latin America Market Y-o-Y Growth (%) Projections by Application, 2024 to 2034

Figure 65: Latin America Market Value (US$ Million) Analysis by Sales, 2019 to 2034

Figure 66: Latin America Market Volume (Tons) Analysis by Sales, 2019 to 2034

Figure 67: Latin America Market Value Share (%) and BPS Analysis by Sales, 2024 to 2034

Figure 68: Latin America Market Y-o-Y Growth (%) Projections by Sales, 2024 to 2034

Figure 69: Latin America Market Attractiveness by Type, 2024 to 2034

Figure 70: Latin America Market Attractiveness by Application, 2024 to 2034

Figure 71: Latin America Market Attractiveness by Sales, 2024 to 2034

Figure 72: Latin America Market Attractiveness by Country, 2024 to 2034

Figure 73: Western Europe Market Value (US$ Million) by Type, 2024 to 2034

Figure 74: Western Europe Market Value (US$ Million) by Application, 2024 to 2034

Figure 75: Western Europe Market Value (US$ Million) by Sales, 2024 to 2034

Figure 76: Western Europe Market Value (US$ Million) by Country, 2024 to 2034

Figure 77: Western Europe Market Value (US$ Million) Analysis by Country, 2019 to 2034

Figure 78: Western Europe Market Volume (Tons) Analysis by Country, 2019 to 2034

Figure 79: Western Europe Market Value Share (%) and BPS Analysis by Country, 2024 to 2034

Figure 80: Western Europe Market Y-o-Y Growth (%) Projections by Country, 2024 to 2034

Figure 81: Western Europe Market Value (US$ Million) Analysis by Type, 2019 to 2034

Figure 82: Western Europe Market Volume (Tons) Analysis by Type, 2019 to 2034

Figure 83: Western Europe Market Value Share (%) and BPS Analysis by Type, 2024 to 2034

Figure 84: Western Europe Market Y-o-Y Growth (%) Projections by Type, 2024 to 2034

Figure 85: Western Europe Market Value (US$ Million) Analysis by Application, 2019 to 2034

Figure 86: Western Europe Market Volume (Tons) Analysis by Application, 2019 to 2034

Figure 87: Western Europe Market Value Share (%) and BPS Analysis by Application, 2024 to 2034

Figure 88: Western Europe Market Y-o-Y Growth (%) Projections by Application, 2024 to 2034

Figure 89: Western Europe Market Value (US$ Million) Analysis by Sales, 2019 to 2034

Figure 90: Western Europe Market Volume (Tons) Analysis by Sales, 2019 to 2034

Figure 91: Western Europe Market Value Share (%) and BPS Analysis by Sales, 2024 to 2034

Figure 92: Western Europe Market Y-o-Y Growth (%) Projections by Sales, 2024 to 2034

Figure 93: Western Europe Market Attractiveness by Type, 2024 to 2034

Figure 94: Western Europe Market Attractiveness by Application, 2024 to 2034

Figure 95: Western Europe Market Attractiveness by Sales, 2024 to 2034

Figure 96: Western Europe Market Attractiveness by Country, 2024 to 2034

Figure 97: Eastern Europe Market Value (US$ Million) by Type, 2024 to 2034

Figure 98: Eastern Europe Market Value (US$ Million) by Application, 2024 to 2034

Figure 99: Eastern Europe Market Value (US$ Million) by Sales, 2024 to 2034

Figure 100: Eastern Europe Market Value (US$ Million) by Country, 2024 to 2034

Figure 101: Eastern Europe Market Value (US$ Million) Analysis by Country, 2019 to 2034

Figure 102: Eastern Europe Market Volume (Tons) Analysis by Country, 2019 to 2034

Figure 103: Eastern Europe Market Value Share (%) and BPS Analysis by Country, 2024 to 2034

Figure 104: Eastern Europe Market Y-o-Y Growth (%) Projections by Country, 2024 to 2034

Figure 105: Eastern Europe Market Value (US$ Million) Analysis by Type, 2019 to 2034

Figure 106: Eastern Europe Market Volume (Tons) Analysis by Type, 2019 to 2034

Figure 107: Eastern Europe Market Value Share (%) and BPS Analysis by Type, 2024 to 2034

Figure 108: Eastern Europe Market Y-o-Y Growth (%) Projections by Type, 2024 to 2034

Figure 109: Eastern Europe Market Value (US$ Million) Analysis by Application, 2019 to 2034

Figure 110: Eastern Europe Market Volume (Tons) Analysis by Application, 2019 to 2034

Figure 111: Eastern Europe Market Value Share (%) and BPS Analysis by Application, 2024 to 2034

Figure 112: Eastern Europe Market Y-o-Y Growth (%) Projections by Application, 2024 to 2034

Figure 113: Eastern Europe Market Value (US$ Million) Analysis by Sales, 2019 to 2034

Figure 114: Eastern Europe Market Volume (Tons) Analysis by Sales, 2019 to 2034

Figure 115: Eastern Europe Market Value Share (%) and BPS Analysis by Sales, 2024 to 2034

Figure 116: Eastern Europe Market Y-o-Y Growth (%) Projections by Sales, 2024 to 2034

Figure 117: Eastern Europe Market Attractiveness by Type, 2024 to 2034

Figure 118: Eastern Europe Market Attractiveness by Application, 2024 to 2034

Figure 119: Eastern Europe Market Attractiveness by Sales, 2024 to 2034

Figure 120: Eastern Europe Market Attractiveness by Country, 2024 to 2034

Figure 121: South Asia and Pacific Market Value (US$ Million) by Type, 2024 to 2034

Figure 122: South Asia and Pacific Market Value (US$ Million) by Application, 2024 to 2034

Figure 123: South Asia and Pacific Market Value (US$ Million) by Sales, 2024 to 2034

Figure 124: South Asia and Pacific Market Value (US$ Million) by Country, 2024 to 2034

Figure 125: South Asia and Pacific Market Value (US$ Million) Analysis by Country, 2019 to 2034

Figure 126: South Asia and Pacific Market Volume (Tons) Analysis by Country, 2019 to 2034

Figure 127: South Asia and Pacific Market Value Share (%) and BPS Analysis by Country, 2024 to 2034

Figure 128: South Asia and Pacific Market Y-o-Y Growth (%) Projections by Country, 2024 to 2034

Figure 129: South Asia and Pacific Market Value (US$ Million) Analysis by Type, 2019 to 2034

Figure 130: South Asia and Pacific Market Volume (Tons) Analysis by Type, 2019 to 2034

Figure 131: South Asia and Pacific Market Value Share (%) and BPS Analysis by Type, 2024 to 2034

Figure 132: South Asia and Pacific Market Y-o-Y Growth (%) Projections by Type, 2024 to 2034

Figure 133: South Asia and Pacific Market Value (US$ Million) Analysis by Application, 2019 to 2034

Figure 134: South Asia and Pacific Market Volume (Tons) Analysis by Application, 2019 to 2034

Figure 135: South Asia and Pacific Market Value Share (%) and BPS Analysis by Application, 2024 to 2034

Figure 136: South Asia and Pacific Market Y-o-Y Growth (%) Projections by Application, 2024 to 2034

Figure 137: South Asia and Pacific Market Value (US$ Million) Analysis by Sales, 2019 to 2034

Figure 138: South Asia and Pacific Market Volume (Tons) Analysis by Sales, 2019 to 2034

Figure 139: South Asia and Pacific Market Value Share (%) and BPS Analysis by Sales, 2024 to 2034

Figure 140: South Asia and Pacific Market Y-o-Y Growth (%) Projections by Sales, 2024 to 2034

Figure 141: South Asia and Pacific Market Attractiveness by Type, 2024 to 2034

Figure 142: South Asia and Pacific Market Attractiveness by Application, 2024 to 2034

Figure 143: South Asia and Pacific Market Attractiveness by Sales, 2024 to 2034

Figure 144: South Asia and Pacific Market Attractiveness by Country, 2024 to 2034

Figure 145: East Asia Market Value (US$ Million) by Type, 2024 to 2034

Figure 146: East Asia Market Value (US$ Million) by Application, 2024 to 2034

Figure 147: East Asia Market Value (US$ Million) by Sales, 2024 to 2034

Figure 148: East Asia Market Value (US$ Million) by Country, 2024 to 2034

Figure 149: East Asia Market Value (US$ Million) Analysis by Country, 2019 to 2034

Figure 150: East Asia Market Volume (Tons) Analysis by Country, 2019 to 2034

Figure 151: East Asia Market Value Share (%) and BPS Analysis by Country, 2024 to 2034

Figure 152: East Asia Market Y-o-Y Growth (%) Projections by Country, 2024 to 2034

Figure 153: East Asia Market Value (US$ Million) Analysis by Type, 2019 to 2034

Figure 154: East Asia Market Volume (Tons) Analysis by Type, 2019 to 2034

Figure 155: East Asia Market Value Share (%) and BPS Analysis by Type, 2024 to 2034

Figure 156: East Asia Market Y-o-Y Growth (%) Projections by Type, 2024 to 2034

Figure 157: East Asia Market Value (US$ Million) Analysis by Application, 2019 to 2034

Figure 158: East Asia Market Volume (Tons) Analysis by Application, 2019 to 2034

Figure 159: East Asia Market Value Share (%) and BPS Analysis by Application, 2024 to 2034

Figure 160: East Asia Market Y-o-Y Growth (%) Projections by Application, 2024 to 2034

Figure 161: East Asia Market Value (US$ Million) Analysis by Sales, 2019 to 2034

Figure 162: East Asia Market Volume (Tons) Analysis by Sales, 2019 to 2034

Figure 163: East Asia Market Value Share (%) and BPS Analysis by Sales, 2024 to 2034

Figure 164: East Asia Market Y-o-Y Growth (%) Projections by Sales, 2024 to 2034

Figure 165: East Asia Market Attractiveness by Type, 2024 to 2034

Figure 166: East Asia Market Attractiveness by Application, 2024 to 2034

Figure 167: East Asia Market Attractiveness by Sales, 2024 to 2034

Figure 168: East Asia Market Attractiveness by Country, 2024 to 2034

Figure 169: Middle East and Africa Market Value (US$ Million) by Type, 2024 to 2034

Figure 170: Middle East and Africa Market Value (US$ Million) by Application, 2024 to 2034

Figure 171: Middle East and Africa Market Value (US$ Million) by Sales, 2024 to 2034

Figure 172: Middle East and Africa Market Value (US$ Million) by Country, 2024 to 2034

Figure 173: Middle East and Africa Market Value (US$ Million) Analysis by Country, 2019 to 2034

Figure 174: Middle East and Africa Market Volume (Tons) Analysis by Country, 2019 to 2034

Figure 175: Middle East and Africa Market Value Share (%) and BPS Analysis by Country, 2024 to 2034

Figure 176: Middle East and Africa Market Y-o-Y Growth (%) Projections by Country, 2024 to 2034

Figure 177: Middle East and Africa Market Value (US$ Million) Analysis by Type, 2019 to 2034

Figure 178: Middle East and Africa Market Volume (Tons) Analysis by Type, 2019 to 2034

Figure 179: Middle East and Africa Market Value Share (%) and BPS Analysis by Type, 2024 to 2034

Figure 180: Middle East and Africa Market Y-o-Y Growth (%) Projections by Type, 2024 to 2034

Figure 181: Middle East and Africa Market Value (US$ Million) Analysis by Application, 2019 to 2034

Figure 182: Middle East and Africa Market Volume (Tons) Analysis by Application, 2019 to 2034

Figure 183: Middle East and Africa Market Value Share (%) and BPS Analysis by Application, 2024 to 2034

Figure 184: Middle East and Africa Market Y-o-Y Growth (%) Projections by Application, 2024 to 2034

Figure 185: Middle East and Africa Market Value (US$ Million) Analysis by Sales, 2019 to 2034

Figure 186: Middle East and Africa Market Volume (Tons) Analysis by Sales, 2019 to 2034

Figure 187: Middle East and Africa Market Value Share (%) and BPS Analysis by Sales, 2024 to 2034

Figure 188: Middle East and Africa Market Y-o-Y Growth (%) Projections by Sales, 2024 to 2034

Figure 189: Middle East and Africa Market Attractiveness by Type, 2024 to 2034

Figure 190: Middle East and Africa Market Attractiveness by Application, 2024 to 2034

Figure 191: Middle East and Africa Market Attractiveness by Sales, 2024 to 2034

Figure 192: Middle East and Africa Market Attractiveness by Country, 2024 to 2034

Frequently Asked Questions

What is the anticipated value of the Jojoba Oil market in 2024?

The jojoba oil market is projected to reach a valuation of USD 42.2 million in 2024.

What is the expected CAGR for the Jojoba Oil market until 2034?

The jojoba oil industry is set to expand by a CAGR of 7.7% through 2034.

How much valuation is projected for the Jojoba Oil market in 2034?

The jojoba oil market is forecast to reach USD 298.0 million by 2034.

Which country is projected to lead the Jojoba Oil market?

China is expected to be the top performing market, exhibiting a CAGR of 13.4% through 2034.

Which is the dominant type in the Jojoba Oil domain?

Cold pressed segment is preferred, and is expected to account for a CAGR of 7.5% through 2034.

Explore Similar Insights

Future Market Insights

Jojoba Oil Market