Lane Control Signals Market Forecast and Outlook (2025-2035)

The global lane control signals market is projected to grow from USD 859.2 million in 2025 to approximately USD 1,212 million by 2035, recording an absolute increase of USD 352.8 million over the forecast period. This translates into a total growth of 41.1%, with the market forecast to expand at a compound annual growth rate (CAGR) of 3.5% between 2025 and 2035. The overall market size is expected to grow by nearly 1.41X during the same period, supported by increasing investments in intelligent transportation infrastructure, growing emphasis on highway safety management, and rising adoption of advanced traffic control systems across global transportation development projects.
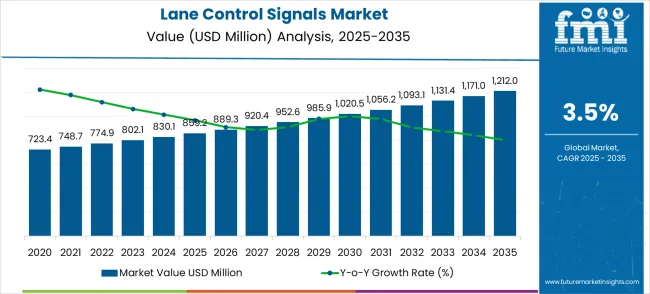
Quick Stats for Lane Control Signals Market

  • Lane Control Signals Market Value (2025): USD 859.2 million
  • Lane Control Signals Market Forecast Value (2035): USD 1,212.0 million
  • Lane Control Signals Market Forecast CAGR: 3.5%
  • Leading Signal Type in Lane Control Signals Market: LED Signs
  • Key Growth Regions in Lane Control Signals Market: Asia Pacific, North America, and Europe
  • Top Key Players in Lane Control Signals Market: Orange Traffic Inc., National Sign and Signal, Messagemaker Displays, Sunrise SESA Technologies, AD Engineering International, LaneLight, Versilis, Daktronics, SWARCO, Wanco

Lane Control Signals Market Market Value Analysis

Lane Control Signals Market Key Takeaways

Metric Value
Estimated Value in (2025E) USD 859.2 million
Forecast Value in (2035F) USD 1,212.0 million
Forecast CAGR (2025 to 2035) 3.5%

From 2030 to 2035, the market is forecast to grow from USD 1,009.3 million to USD 1,212.0 million, adding another USD 202.7 million, which constitutes 57.5% of the overall ten-year expansion. This period is expected to be characterized by the integration of connected vehicle communication systems, the development of automated traffic management platforms, and the advancement of energy-efficient LED technologies for enhanced visibility and reduced operational costs. The growing emphasis on sustainable transportation infrastructure and intelligent mobility solutions will drive demand for advanced lane control systems with integrated IoT capabilities and real-time traffic optimization features.

Between 2020 and 2024, the lane control signals market experienced steady growth, driven by increasing awareness of highway safety benefits and growing recognition of intelligent transportation systems' effectiveness in managing traffic flow and preventing accidents. The market developed as transportation authorities recognized the potential for lane control signals to enhance roadway safety while supporting dynamic traffic management requirements. Technological advancement in LED display technologies and wireless communication systems began emphasizing the critical importance of maintaining signal visibility performance while extending operational life and improving cost-effectiveness.

Why is the Lane Control Signals Market Growing?

Market expansion is being supported by the increasing global demand for intelligent highway infrastructure and the corresponding shift toward dynamic traffic management systems that can provide real-time lane control while meeting modern transportation requirements for efficient traffic flow optimization and safety enhancement. Modern transportation authorities are increasingly focused on incorporating lane control signals to enhance highway safety performance while satisfying regulatory demands for advanced traffic control systems and improved accident prevention capabilities. Lane control signals' proven ability to deliver superior visibility enhancement, operational reliability, and traffic flow optimization makes them essential components for modern highway infrastructure development and intelligent transportation system applications.

The growing emphasis on smart highway development and connected infrastructure is driving demand for high-performance lane control systems that can support integrated traffic management platforms and real-time communication with traffic control centers across highway, bridge, and tunnel applications. Transportation authority preference for technologies that combine operational excellence with energy efficiency credentials is creating opportunities for innovative lane control signal implementations in both traditional and emerging traffic management applications. The rising influence of autonomous vehicle integration and connected transportation system development is also contributing to increased adoption of advanced lane control products that can provide automated communication with vehicle systems and traffic management platforms.

Segmental Analysis

The market is segmented by signal type, application, and region. By signal type, the market is divided into reflective material signs and LED signs categories. Based on application, the market is categorized into urban roads, highways, bridges, and tunnels. Regionally, the market is divided into North America, Europe, East Asia, South Asia & Pacific, Latin America, and the Middle East & Africa.
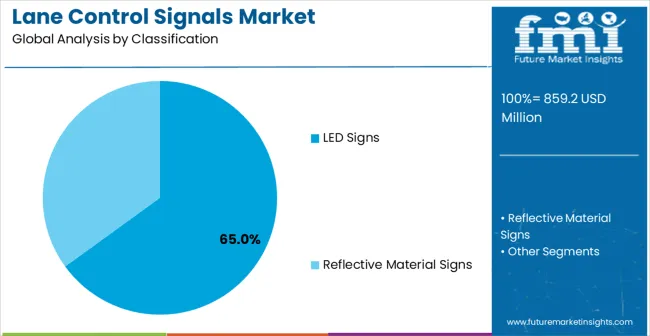
By Signal Type, LED Signs Segment Dominates with 65% Market Share

Lane Control Signals Market Analysis By Classification

The LED signs segment is projected to dominate with 65% market share in the lane control signals market in 2025, maintaining its position as the leading category of signal types. Transportation authorities and highway infrastructure developers increasingly utilize LED lane control signals for their superior visibility characteristics, energy efficiency performance, and advanced communication capabilities across diverse traffic management applications. LED technology's enhanced brightness performance and programmable display capabilities directly address the operational requirements for effective lane control communication and efficient traffic flow management in both daytime and nighttime conditions.

This signal type segment forms the foundation of modern lane control applications, as it represents the technology with the greatest versatility and established infrastructure compatibility across multiple traffic management systems. Transportation authority investments in LED technology solutions and visibility optimization continue to strengthen adoption among highway infrastructure developers. With traffic management organizations prioritizing operational effectiveness and consistent visibility performance, LED lane control signals align with both energy efficiency objectives and safety assurance requirements, making them the central component of comprehensive traffic control strategies.
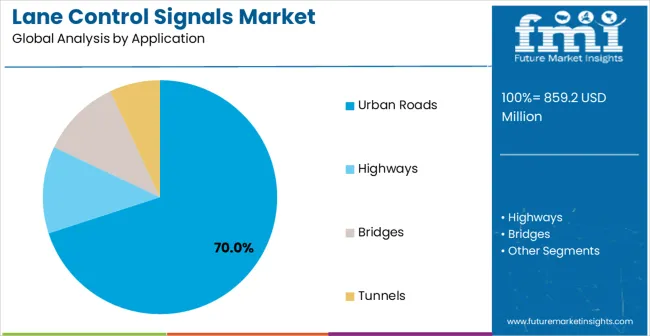
By Application, Urban Roads Segment Leads Market Demand with 70% market Share

Lane Control Signals Market Analysis By Application

Urban roads applications are projected to represent 70% market share of lane control signals demand in 2025, underscoring their critical role as the primary application environment for dynamic lane management systems. Urban transportation authorities prefer lane control signals for their ability to manage complex traffic patterns efficiently, support congestion reduction initiatives, and provide real-time lane status communication while offering enhanced safety benefits for high-density traffic environments. Positioned as essential infrastructure for modern urban mobility management, lane control signals offer both traffic optimization advantages and accident prevention benefits.

The segment is supported by continuous growth in urban development projects and the growing implementation of smart city initiatives that enable advanced traffic management and real-time communication at the urban infrastructure level. Additionally, urban transportation authorities are investing in intelligent transportation systems to support dynamic lane control positioning and traffic flow optimization. As urban populations continue to expand and cities seek efficient traffic management solutions, urban roads applications will continue to dominate the application landscape while supporting infrastructure modernization and traffic safety enhancement strategies.

What are the Drivers, Restraints, and Key Trends of the Lane Control Signals Market?

The lane control signals market is advancing steadily due to increasing government investments in intelligent transportation infrastructure and growing demand for dynamic traffic management systems that emphasize real-time lane control across highway and urban transportation applications. However, the market faces challenges, including high initial installation costs for comprehensive systems, technical complexity of integration with existing traffic management infrastructure, and maintenance requirements for outdoor display systems exposed to harsh weather conditions. Innovation in energy-efficient LED technologies and wireless communication integration continues to influence market development and expansion patterns.

Expansion of Smart Highway and Intelligent Transportation Systems

The growing adoption of lane control signals in smart highway development and intelligent transportation system projects is enabling transportation authorities to develop infrastructure that provides dynamic traffic management while supporting integrated communication with traffic control centers and enhanced safety performance. Smart transportation applications provide superior traffic flow optimization while allowing more sophisticated infrastructure development across various highway and urban categories. Transportation authorities are increasingly recognizing the operational advantages of intelligent lane control positioning for modern infrastructure development and traffic management system integration.

Integration of Connected Infrastructure and IoT Technologies

Modern lane control signal suppliers are incorporating wireless communication capabilities, IoT connectivity, and real-time data integration systems to enhance traffic management effectiveness, improve system reliability, and meet transportation authority demands for connected infrastructure solutions. These technologies enhance operational efficiency while enabling new applications, including connected vehicle communication and automated traffic management systems. Advanced connectivity integration also allows transportation authorities to support centralized traffic control positioning and real-time traffic optimization beyond traditional static lane control signage.
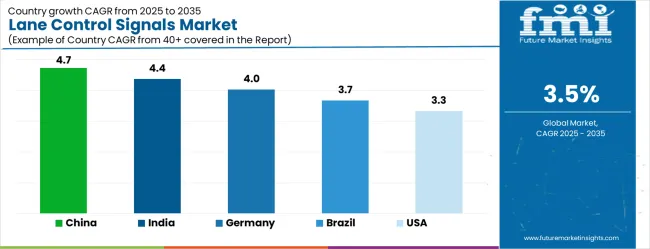
Analysis of the Lane Control Signals Market by Key Country

Lane Control Signals Market Cagr Analysis By Country

Country CAGR (2025-2035)
China 4.7%
India 4.4%
Germany 4.0%
Brazil 3.7%
USA 3.3%
UK 3.0%
Japan 2.6%

The lane control signals market is experiencing robust growth globally, with China leading at a 4.7% CAGR through 2035, driven by massive highway infrastructure development projects, expanding urban road networks, and government investments in intelligent transportation systems across major metropolitan areas. India follows at 4.4%, supported by rapid urbanization, growing traffic management challenges, and increasing adoption of smart city initiatives with advanced traffic control systems. Germany shows growth at 4.0%, emphasizing advanced traffic management technologies and highway infrastructure modernization programs. Brazil records 3.7%, focusing on urban mobility improvement and transportation infrastructure development across major cities. The USA demonstrates 3.3% growth, prioritizing highway safety enhancement and intelligent transportation system integration. The UK exhibits 3.0% growth, supported by traffic management modernization and infrastructure investment programs. Japan shows 2.6% growth, supported by advanced transportation technology adoption and highway infrastructure maintenance programs.

The report covers an in-depth analysis of 40+ countries top-performing countries are highlighted below.

Analysis of Lane Control Signals Market in China

Lane control signals market in China is projected to exhibit exceptional growth with a CAGR of 4.7% through 2035, driven by the country's massive infrastructure development programs and increasing investments in intelligent transportation systems across expanding highway networks and urban development projects. The country's growing focus on smart city development and traffic management optimization is creating substantial demand for advanced lane control technologies in both highway and urban transportation applications. Major transportation authorities and infrastructure developers are establishing comprehensive traffic management capabilities to serve both domestic infrastructure requirements and export market opportunities.

  • Rising infrastructure development programs and expanding highway networks are driving demand for lane control signals across transportation authorities, highway developers, and urban infrastructure projects throughout major Chinese metropolitan areas and intercity corridor developments.
  • Strong government support for intelligent transportation systems and smart city development is supporting the rapid adoption of lane control signal products among infrastructure developers seeking to meet evolving traffic management requirements and safety enhancement objectives.

Lane Control Signals Market expansion in India

Revenue from lane control signals in India is expanding at a CAGR of 4.4%, supported by rapid urbanization, increasing traffic management challenges, and growing government investments in smart city development and transportation infrastructure modernization programs. The country's developing highway infrastructure and expanding metropolitan areas are driving demand for advanced traffic control systems across both urban and intercity transportation applications. International traffic technology companies and domestic infrastructure developers are establishing comprehensive distribution and installation capabilities to address growing market demand for intelligent lane control systems.
  • Rising urbanization and expanding metropolitan infrastructure development are creating opportunities for lane control signal adoption across transportation authorities, highway developers, and urban infrastructure projects in major Indian cities and developing urban corridors.
  • Growing government focus on smart city initiatives and traffic safety improvement programs is driving adoption of advanced traffic management technologies among infrastructure developers seeking to meet regulatory requirements and traffic flow optimization objectives.

Demand forecast and sales forecast for Lane Control Signals Market in the US

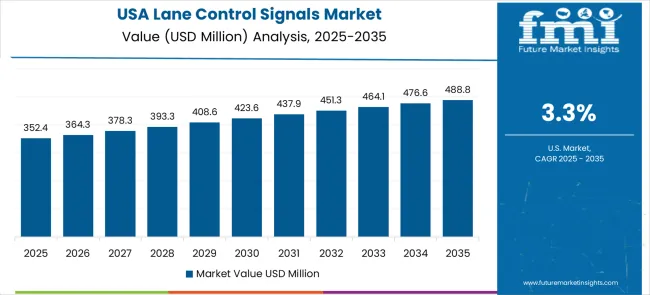
Lane Control Signals Market Country Value Analysis

Lane control signals market in the United States is projected to grow at a CAGR of 3.3% through 2035, driven by the country's comprehensive highway infrastructure maintenance programs, federal transportation safety initiatives, and increasing adoption of intelligent transportation systems across major interstate and urban highway networks. The USA's established traffic management infrastructure and significant investments in highway safety enhancement are creating substantial demand for advanced lane control signal technologies. Leading transportation authorities and infrastructure contractors are establishing comprehensive deployment strategies to serve both federal highway projects and state transportation system modernization requirements.

  • Rising federal transportation infrastructure investment and highway safety enhancement programs are driving demand for lane control signal systems across state transportation authorities, highway contractors, and traffic management organizations seeking advanced traffic control capabilities and safety improvement solutions.
  • Strong emphasis on intelligent transportation system development and traffic flow optimization is supporting the adoption of connected lane control signal technologies among transportation authorities and infrastructure developers, prioritizing system integration and operational effectiveness.

In depth analysis of Lane Control Signals Market in Germany

Lane control signals in Germany is projected to grow at a CAGR of 4.0% through 2035, supported by the country's advanced traffic management infrastructure, comprehensive highway system, and established tradition of transportation technology innovation requiring high-performance traffic control systems. German transportation authorities and infrastructure developers consistently demand superior lane control signal products that meet exacting technical standards for both domestic highway systems and export market applications. The country's position as a transportation technology leader continues to drive innovation in lane control signal applications and performance standards.

  • Advanced highway infrastructure and comprehensive traffic management systems are driving demand for high-performance lane control signals across transportation authorities, infrastructure contractors, and traffic technology companies seeking to maintain Germany's reputation for transportation system excellence.
  • Growing export of German transportation technology products and increasing emphasis on European highway system integration are supporting the adoption of standardized lane control signal solutions among manufacturers seeking to differentiate their products in international markets.

Expansion strategy for Lane Control Signals Market in Brazil

Demand for lane control signals in Brazil is projected to grow at a CAGR of 3.7% through 2035, supported by the country's expanding highway infrastructure, urban mobility improvement programs, and increasing investments in transportation system modernization across major metropolitan areas and intercity corridors. Brazilian transportation authorities prioritize cost-effective solutions, operational reliability, and safety enhancement, making lane control signals essential components for both urban traffic management and highway infrastructure development. The country's comprehensive infrastructure development programs and federal transportation initiatives support continued lane control signal market development.

  • Expanding highway infrastructure and urban mobility improvement programs are driving demand for lane control signal systems across federal transportation authorities, state highway departments, and metropolitan transportation organizations serving Brazilian cities and intercity transportation corridors.
  • Strong emphasis on traffic safety improvement and infrastructure modernization is encouraging transportation authorities to adopt advanced lane control signal technologies that support traffic flow optimization and meet Brazilian technical standards for transportation infrastructure development.

United Kingdom outlook for Lane Control Signals Market

Revenue from lane control signals in the United Kingdom is projected to grow at a CAGR of 3.0% through 2035, supported by the country's comprehensive highway infrastructure, established traffic management systems, and ongoing investments in transportation technology modernization requiring advanced traffic control capabilities. British transportation authorities' emphasis on operational effectiveness and safety enhancement creates steady demand for high-performance lane control signal systems across both motorway and urban road applications. The country's focus on traffic management optimization and infrastructure maintenance drives consistent lane control signal adoption across both traditional and intelligent transportation system applications.
  • Comprehensive highway infrastructure and established traffic management systems are driving steady demand for lane control signal products across transportation authorities, highway maintenance contractors, and traffic management organizations seeking reliable traffic control solutions and operational effectiveness.
  • Strong emphasis on traffic safety enhancement and infrastructure modernization programs is supporting the adoption of advanced lane control signal technologies among transportation authorities seeking to meet UK performance standards and traffic management optimization requirements.

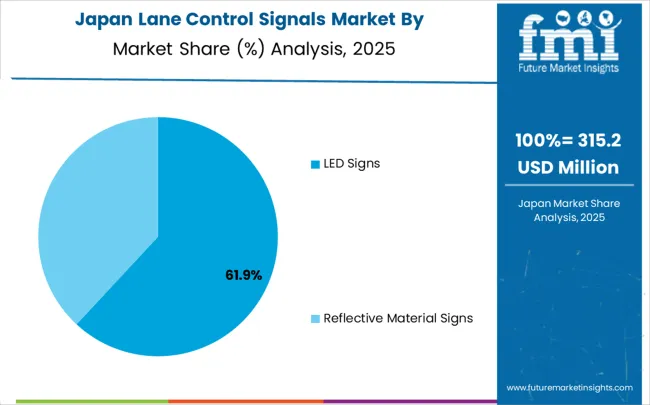
Outlook on Lane Control Signals Market in Japan

Lane Control Signals Market Japan Market Share Analysis By Classification

Lane control signals in Japan is projected to grow at a CAGR of 2.6% through 2035, supported by the country's advanced transportation infrastructure, sophisticated traffic management systems, and ongoing efforts to enhance highway safety standards through technology integration and intelligent transportation system development. Japan's transportation industry continues to benefit from its reputation for producing advanced traffic management technologies while working to address infrastructure maintenance challenges and improve operational efficiency through sustainable technology solutions.
  • Advanced transportation infrastructure and sophisticated traffic management systems are driving the development of high-performance lane control signal products that integrate with intelligent transportation systems while supporting traffic flow optimization and safety enhancement initiatives.
  • Growing focus on infrastructure maintenance programs and technology integration is supporting the adoption of energy-efficient lane control signal systems among transportation authorities seeking to ensure operational reliability and reduce long-term maintenance costs.

Europe Market Split by Country

Lane Control Signals Market Europe Country Market Share Analysis, 2025 & 2035

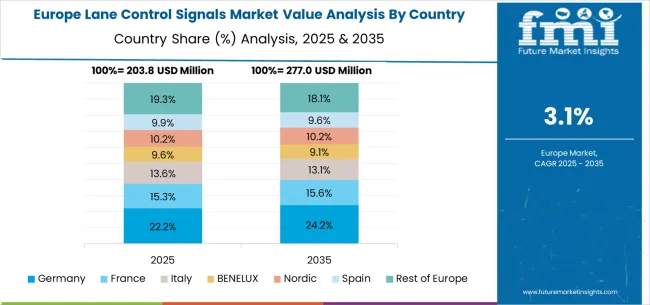
The lane control signals market in Europe is projected to grow from USD 211.8 million in 2025 to USD 298.4 million by 2035, registering a CAGR of 3.5% over the forecast period. Germany is expected to maintain its leadership position with a 28.2% market share in 2025, declining slightly to 27.8% by 2035, supported by its advanced highway infrastructure, comprehensive traffic management systems, and established transportation technology industry serving European and international markets.

France follows with a 19.5% share in 2025, projected to reach 19.8% by 2035, driven by extensive highway network modernization programs, urban traffic management initiatives, and growing investments in intelligent transportation system development across major metropolitan areas. The United Kingdom holds a 16.8% share in 2025, expected to decrease to 16.4% by 2035, supported by a comprehensive motorway infrastructure and traffic management system modernization, but facing challenges from infrastructure investment constraints and economic uncertainties. Italy commands a 13.2% share in 2025, projected to reach 13.5% by 2035, while Spain accounts for 10.8% in 2025, expected to reach 11.1% by 2035. The Netherlands maintains a 4.1% share in 2025, growing to 4.2% by 2035. The Rest of Europe region, including Nordic countries, Eastern Europe, Belgium, Switzerland, and Austria, is anticipated to hold 11.4% in 2025, declining to 11.2% by 2035, attributed to mixed growth patterns with faster expansion in some Eastern European markets implementing highway modernization programs, balanced by slower growth in smaller Western European countries developing intelligent transportation infrastructure projects.
Competitive Landscape of the Lane Control Signals Market

Lane Control Signals Market Analysis By Company

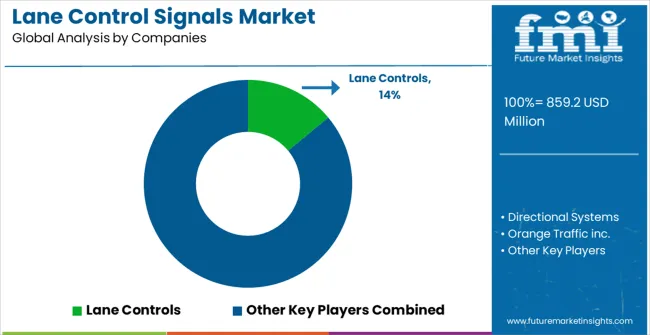
The lane control signals market is characterized by competition among established traffic management technology companies, specialized signal display manufacturers, and integrated transportation infrastructure suppliers. Companies are investing in energy-efficient LED technologies, wireless communication integration, weather-resistant display systems, and comprehensive traffic management software solutions to deliver reliable, high-performance, and connected lane control signal products. Innovation in display visibility optimization, IoT connectivity, and intelligent traffic management integration is central to strengthening market position and transportation authority satisfaction.

Orange Traffic Inc. leads the market with a strong focus on traffic management innovation and a comprehensive product portfolio, offering integrated lane control signal solutions that emphasize operational reliability and system integration capabilities. National Sign and Signal provides specialized traffic signage solutions with a focus on highway infrastructure applications and transportation authority requirements. Messagemaker Displays delivers advanced display technologies with a focus on visibility optimization and weather resistance performance. Sunrise SESA Technologies emphasizes intelligent transportation system integration with a focus on connected infrastructure solutions and traffic management platform compatibility. AD Engineering International focuses on traffic control technology development and comprehensive system integration capabilities.

Lane Control Signals Market - Stakeholder Contribution Framework

Lane control signals represent critical infrastructure for modern traffic management, with the global market projected to grow from USD 859.2 million in 2025 to USD 1,212.0 million by 2035 at a 3.5% CAGR. LED-based systems dominate due to superior visibility, energy efficiency, and programmable capabilities, while urban roads applications lead demand driven by smart city initiatives and traffic optimization needs. Scaling market adoption requires coordinated action across government agencies, industry standards bodies, technology manufacturers, infrastructure suppliers, and financial enablers to advance intelligent transportation systems.

How Governments Could Accelerate Infrastructure Modernization and Market Growth?

  • Transportation Infrastructure Investment: Include lane control signals in federal and state highway modernization budgets, with dedicated funding for intelligent transportation system upgrades that prioritize dynamic lane management capabilities and traffic flow optimization.
  • Smart City Integration Programs: Establish grant programs and tax incentives for municipalities implementing comprehensive traffic management systems, including lane control signals as core components of urban mobility infrastructure with measurable traffic flow and safety improvements.
  • Regulatory Standardization: Develop unified technical standards for lane control signal visibility, communication protocols, and weather resistance requirements that ensure interoperability across different manufacturers while reducing procurement complexity for transportation authorities.
  • Public-Private Partnership Facilitation: Create financing mechanisms that combine public infrastructure needs with private sector innovation, including performance-based contracts that tie lane control signal effectiveness to measurable traffic safety and flow optimization outcomes.
  • Research and Development Support: Fund university and industry research programs focused on advanced LED technologies, IoT integration, and connected vehicle communication systems that enhance lane control signal functionality and reduce long-term operational costs.

How Industry Bodies Could Strengthen Market Development and Standards?

  • Technical Performance Standards: Establish comprehensive testing protocols for LED display brightness, weather resistance, and communication reliability that enable transportation authorities to evaluate lane control signal systems objectively across different suppliers and technologies.
  • Professional Certification Programs: Develop training and certification standards for traffic management professionals, system installers, and maintenance technicians to ensure proper deployment and operation of lane control signal systems in diverse highway and urban environments.
  • Market Education and Best Practices: Lead industry conferences, case study development, and knowledge sharing initiatives that demonstrate proven lane control signal implementations, ROI calculations, and integration strategies for transportation authorities considering system upgrades.
  • Interoperability Guidelines: Create technical specifications that ensure lane control signals can communicate effectively with existing traffic management centers, connected vehicle systems, and future intelligent transportation infrastructure developments.

How Technology Manufacturers Could Drive Innovation and Market Expansion?

  • Modular System Architecture: Develop scalable lane control signal platforms that allow transportation authorities to start with basic LED displays and progressively add IoT connectivity, weather monitoring, and traffic management software integration as budgets and requirements evolve.
  • Energy Efficiency Innovation: Advance LED technology, solar power integration, and smart power management systems that reduce operational costs while maintaining superior visibility performance in all weather conditions and lighting environments.
  • Connected Infrastructure Solutions: Integrate wireless communication capabilities, cloud-based monitoring, and predictive maintenance systems that enable real-time traffic management center communication and reduce long-term maintenance costs for transportation authorities.
  • Turnkey Implementation Services: Provide comprehensive project management, installation, training, and ongoing support services that reduce deployment complexity for transportation authorities while ensuring optimal system performance and user adoption.

How Infrastructure Suppliers and Contractors Could Enhance Market Accessibility?

  • Regional Distribution Networks: Establish local supply chains and service capabilities that reduce project costs and response times for transportation authorities while providing ongoing maintenance and technical support for lane control signal systems.
  • Integrated Project Delivery: Combine lane control signals with complementary traffic management infrastructure, including variable message signs, traffic cameras, and communication networks, to provide comprehensive intelligent transportation solutions.
  • Performance Guarantees and Service Agreements: Offer multi-year maintenance contracts and performance warranties that assure transportation authorities of system reliability while providing predictable operational cost structures for budget planning.
  • Training and Knowledge Transfer: Provide technical training programs for transportation authority staff, ensuring proper system operation and basic maintenance capabilities while building long-term customer relationships and market confidence.

How Investors and Financial Enablers Could Unlock Market Potential?

  • Infrastructure Technology Venture Capital: Fund startups developing next-generation lane control technologies, including advanced LED systems, AI-powered traffic management integration, and innovative manufacturing processes that reduce system costs while improving performance.
  • Municipal Infrastructure Financing: Provide flexible financing options, including equipment leasing, performance-based contracts, and municipal bond programs that enable transportation authorities to upgrade traffic management systems without significant upfront capital requirements.
  • Public-Private Partnership Structuring: Develop financing models that combine private sector efficiency with public sector infrastructure needs, including revenue-sharing agreements based on measurable traffic flow improvements and safety enhancements.
  • Growth Capital for Market Leaders: Support established lane control signal manufacturers in expanding production capacity, developing new technologies, and entering emerging markets where intelligent transportation infrastructure investment is accelerating rapidly.

Key Players in the Lane Control Signals Market

  • Orange Traffic Inc.
  • National Sign and Signal
  • Messagemaker Displays
  • Sunrise SESA Technologies
  • AD Engineering International
  • LaneLight
  • Versilis
  • Daktronics
  • SWARCO
  • Wanco
  • Ledstar
  • Yaham
  • Hill & Smith
  • Sunrise SESA
  • Sernis
  • Sinowatcher Technology Co., Ltd
  • Yaham Optoelectronics Co., Ltd.
  • Henan Dingwei Intelligent Technology Co., Ltd.
  • SAISI
  • TI-TECH

Scope of the Report

Items Values
Quantitative Units (2025) USD 859.2 million
Signal Type Reflective Material Signs, LED Signs
Application Urban Roads, Highways, Bridges, Tunnels
Regions Covered North America, Europe, East Asia, South Asia & Pacific, Latin America, Middle East & Africa
Countries Covered United States, Canada, United Kingdom, Germany, France, China, Japan, South Korea, India, Brazil, Australia and 40+ countries
Key Companies Profiled Orange Traffic Inc., National Sign and Signal, Messagemaker Displays, Sunrise SESA Technologies, AD Engineering International, LaneLight, Versilis, Daktronics, SWARCO, and Wanco
Additional Attributes Dollar sales by signal type and application, regional demand trends, competitive landscape, technological advancements in LED display systems, intelligent transportation system integration, energy efficiency optimization programs, and traffic management software development strategies

Lane Control Signals Market by Segments

Signal Type:

  • Reflective Material Signs
  • LED Signs

Application:

  • Urban Roads
  • Highways
  • Bridges
  • Tunnels

Region:

  • North America
    • United States
    • Canada
    • Mexico
  • Europe
    • Germany
    • United Kingdom
    • France
    • Italy
    • Spain
    • Nordic
    • BENELUX
    • Rest of Europe
  • East Asia
    • China
    • Japan
    • South Korea
  • South Asia & Pacific
    • India
    • ASEAN
    • Australia & New Zealand
    • Rest of South Asia & Pacific
  • Latin America
    • Brazil
    • Chile
    • Rest of Latin America
  • Middle East & Africa
    • Kingdom of Saudi Arabia
    • Other GCC Countries
    • Turkiye
    • South Africa
    • Other African Union
    • Rest of Middle East & Africa

Table of Content

  1. Executive Summary
    • Global Market Outlook
    • Demand to side Trends
    • Supply to side Trends
    • Technology Roadmap Analysis
    • Analysis and Recommendations
  2. Market Overview
    • Market Coverage / Taxonomy
    • Market Definition / Scope / Limitations
  3. Market Background
    • Market Dynamics
      • Drivers
      • Restraints
      • Opportunity
      • Trends
    • Scenario Forecast
      • Demand in Optimistic Scenario
      • Demand in Likely Scenario
      • Demand in Conservative Scenario
    • Opportunity Map Analysis
    • Product Life Cycle Analysis
    • Supply Chain Analysis
    • Investment Feasibility Matrix
    • Value Chain Analysis
    • PESTLE and Porter’s Analysis
    • Regulatory Landscape
    • Regional Parent Market Outlook
    • Production and Consumption Statistics
    • Import and Export Statistics
  4. Global Market Analysis 2020 to 2024 and Forecast, 2025 to 2035
    • Historical Market Size Value (USD Million) Analysis, 2020 to 2024
    • Current and Future Market Size Value (USD Million) Projections, 2025 to 2035
      • Y to o to Y Growth Trend Analysis
      • Absolute $ Opportunity Analysis
  5. Global Market Pricing Analysis 2020 to 2024 and Forecast 2025 to 2035
  6. Global Market Analysis 2020 to 2024 and Forecast 2025 to 2035, By Classification
    • Introduction / Key Findings
    • Historical Market Size Value (USD Million) Analysis By Classification , 2020 to 2024
    • Current and Future Market Size Value (USD Million) Analysis and Forecast By Classification , 2025 to 2035
      • LED Signs
      • Reflective Material Signs
    • Y to o to Y Growth Trend Analysis By Classification , 2020 to 2024
    • Absolute $ Opportunity Analysis By Classification , 2025 to 2035
  7. Global Market Analysis 2020 to 2024 and Forecast 2025 to 2035, By Application
    • Introduction / Key Findings
    • Historical Market Size Value (USD Million) Analysis By Application, 2020 to 2024
    • Current and Future Market Size Value (USD Million) Analysis and Forecast By Application, 2025 to 2035
      • Urban Roads
      • Highways
      • Bridges
      • Tunnels
    • Y to o to Y Growth Trend Analysis By Application, 2020 to 2024
    • Absolute $ Opportunity Analysis By Application, 2025 to 2035
  8. Global Market Analysis 2020 to 2024 and Forecast 2025 to 2035, By Region
    • Introduction
    • Historical Market Size Value (USD Million) Analysis By Region, 2020 to 2024
    • Current Market Size Value (USD Million) Analysis and Forecast By Region, 2025 to 2035
      • North America
      • Latin America
      • Western Europe
      • Eastern Europe
      • East Asia
      • South Asia and Pacific
      • Middle East & Africa
    • Market Attractiveness Analysis By Region
  9. North America Market Analysis 2020 to 2024 and Forecast 2025 to 2035, By Country
    • Historical Market Size Value (USD Million) Trend Analysis By Market Taxonomy, 2020 to 2024
    • Market Size Value (USD Million) Forecast By Market Taxonomy, 2025 to 2035
      • By Country
        • USA
        • Canada
        • Mexico
      • By Classification
      • By Application
    • Market Attractiveness Analysis
      • By Country
      • By Classification
      • By Application
    • Key Takeaways
  10. Latin America Market Analysis 2020 to 2024 and Forecast 2025 to 2035, By Country
    • Historical Market Size Value (USD Million) Trend Analysis By Market Taxonomy, 2020 to 2024
    • Market Size Value (USD Million) Forecast By Market Taxonomy, 2025 to 2035
      • By Country
        • Brazil
        • Chile
        • Rest of Latin America
      • By Classification
      • By Application
    • Market Attractiveness Analysis
      • By Country
      • By Classification
      • By Application
    • Key Takeaways
  11. Western Europe Market Analysis 2020 to 2024 and Forecast 2025 to 2035, By Country
    • Historical Market Size Value (USD Million) Trend Analysis By Market Taxonomy, 2020 to 2024
    • Market Size Value (USD Million) Forecast By Market Taxonomy, 2025 to 2035
      • By Country
        • Germany
        • UK
        • Italy
        • Spain
        • France
        • Nordic
        • BENELUX
        • Rest of Western Europe
      • By Classification
      • By Application
    • Market Attractiveness Analysis
      • By Country
      • By Classification
      • By Application
    • Key Takeaways
  12. Eastern Europe Market Analysis 2020 to 2024 and Forecast 2025 to 2035, By Country
    • Historical Market Size Value (USD Million) Trend Analysis By Market Taxonomy, 2020 to 2024
    • Market Size Value (USD Million) Forecast By Market Taxonomy, 2025 to 2035
      • By Country
        • Russia
        • Poland
        • Hungary
        • Balkan & Baltic
        • Rest of Eastern Europe
      • By Classification
      • By Application
    • Market Attractiveness Analysis
      • By Country
      • By Classification
      • By Application
    • Key Takeaways
  13. East Asia Market Analysis 2020 to 2024 and Forecast 2025 to 2035, By Country
    • Historical Market Size Value (USD Million) Trend Analysis By Market Taxonomy, 2020 to 2024
    • Market Size Value (USD Million) Forecast By Market Taxonomy, 2025 to 2035
      • By Country
        • China
        • Japan
        • South Korea
      • By Classification
      • By Application
    • Market Attractiveness Analysis
      • By Country
      • By Classification
      • By Application
    • Key Takeaways
  14. South Asia and Pacific Market Analysis 2020 to 2024 and Forecast 2025 to 2035, By Country
    • Historical Market Size Value (USD Million) Trend Analysis By Market Taxonomy, 2020 to 2024
    • Market Size Value (USD Million) Forecast By Market Taxonomy, 2025 to 2035
      • By Country
        • India
        • ASEAN
        • Australia & New Zealand
        • Rest of South Asia and Pacific
      • By Classification
      • By Application
    • Market Attractiveness Analysis
      • By Country
      • By Classification
      • By Application
    • Key Takeaways
  15. Middle East & Africa Market Analysis 2020 to 2024 and Forecast 2025 to 2035, By Country
    • Historical Market Size Value (USD Million) Trend Analysis By Market Taxonomy, 2020 to 2024
    • Market Size Value (USD Million) Forecast By Market Taxonomy, 2025 to 2035
      • By Country
        • Kingdom of Saudi Arabia
        • Other GCC Countries
        • Turkiye
        • South Africa
        • Other African Union
        • Rest of Middle East & Africa
      • By Classification
      • By Application
    • Market Attractiveness Analysis
      • By Country
      • By Classification
      • By Application
    • Key Takeaways
  16. Key Countries Market Analysis
    • USA
      • Pricing Analysis
      • Market Share Analysis, 2024
        • By Classification
        • By Application
    • Canada
      • Pricing Analysis
      • Market Share Analysis, 2024
        • By Classification
        • By Application
    • Mexico
      • Pricing Analysis
      • Market Share Analysis, 2024
        • By Classification
        • By Application
    • Brazil
      • Pricing Analysis
      • Market Share Analysis, 2024
        • By Classification
        • By Application
    • Chile
      • Pricing Analysis
      • Market Share Analysis, 2024
        • By Classification
        • By Application
    • Germany
      • Pricing Analysis
      • Market Share Analysis, 2024
        • By Classification
        • By Application
    • UK
      • Pricing Analysis
      • Market Share Analysis, 2024
        • By Classification
        • By Application
    • Italy
      • Pricing Analysis
      • Market Share Analysis, 2024
        • By Classification
        • By Application
    • Spain
      • Pricing Analysis
      • Market Share Analysis, 2024
        • By Classification
        • By Application
    • France
      • Pricing Analysis
      • Market Share Analysis, 2024
        • By Classification
        • By Application
    • India
      • Pricing Analysis
      • Market Share Analysis, 2024
        • By Classification
        • By Application
    • ASEAN
      • Pricing Analysis
      • Market Share Analysis, 2024
        • By Classification
        • By Application
    • Australia & New Zealand
      • Pricing Analysis
      • Market Share Analysis, 2024
        • By Classification
        • By Application
    • China
      • Pricing Analysis
      • Market Share Analysis, 2024
        • By Classification
        • By Application
    • Japan
      • Pricing Analysis
      • Market Share Analysis, 2024
        • By Classification
        • By Application
    • South Korea
      • Pricing Analysis
      • Market Share Analysis, 2024
        • By Classification
        • By Application
    • Russia
      • Pricing Analysis
      • Market Share Analysis, 2024
        • By Classification
        • By Application
    • Poland
      • Pricing Analysis
      • Market Share Analysis, 2024
        • By Classification
        • By Application
    • Hungary
      • Pricing Analysis
      • Market Share Analysis, 2024
        • By Classification
        • By Application
    • Kingdom of Saudi Arabia
      • Pricing Analysis
      • Market Share Analysis, 2024
        • By Classification
        • By Application
    • Turkiye
      • Pricing Analysis
      • Market Share Analysis, 2024
        • By Classification
        • By Application
    • South Africa
      • Pricing Analysis
      • Market Share Analysis, 2024
        • By Classification
        • By Application
  17. Market Structure Analysis
    • Competition Dashboard
    • Competition Benchmarking
    • Market Share Analysis of Top Players
      • By Regional
      • By Classification
      • By Application
  18. Competition Analysis
    • Competition Deep Dive
      • Lane Controls
        • Overview
        • Product Portfolio
        • Profitability by Market Segments (Product/Age /Sales Channel/Region)
        • Sales Footprint
        • Strategy Overview
          • Marketing Strategy
          • Product Strategy
          • Channel Strategy
      • Directional Systems
      • Orange Traffic inc.
      • National Sign and Signal
      • Messagemaker Displays
      • Sunrise SESA Technologies
      • AD Engineering International
      • LaneLight
      • Versilis
      • Daktronics
      • SWARCO
      • Wanco
      • Ledstar
      • Yaham
      • Hill & Smith
      • Sunrise SESA
      • Sernis
      • Sinowatcher Technology Co.,Ltd
      • Yaham Optoelectronics Co.,Ltd.
      • Henan Dingwei Intelligent Technology Co., Ltd.
  19. Assumptions & Acronyms Used
  20. Research Methodology

List of Tables

  • Table 1: Global Market Value (USD Million) Forecast by Region, 2020 to 2035
  • Table 2: Global Market Value (USD Million) Forecast by Classification , 2020 to 2035
  • Table 3: Global Market Value (USD Million) Forecast by Application, 2020 to 2035
  • Table 4: North America Market Value (USD Million) Forecast by Country, 2020 to 2035
  • Table 5: North America Market Value (USD Million) Forecast by Classification , 2020 to 2035
  • Table 6: North America Market Value (USD Million) Forecast by Application, 2020 to 2035
  • Table 7: Latin America Market Value (USD Million) Forecast by Country, 2020 to 2035
  • Table 8: Latin America Market Value (USD Million) Forecast by Classification , 2020 to 2035
  • Table 9: Latin America Market Value (USD Million) Forecast by Application, 2020 to 2035
  • Table 10: Western Europe Market Value (USD Million) Forecast by Country, 2020 to 2035
  • Table 11: Western Europe Market Value (USD Million) Forecast by Classification , 2020 to 2035
  • Table 12: Western Europe Market Value (USD Million) Forecast by Application, 2020 to 2035
  • Table 13: Eastern Europe Market Value (USD Million) Forecast by Country, 2020 to 2035
  • Table 14: Eastern Europe Market Value (USD Million) Forecast by Classification , 2020 to 2035
  • Table 15: Eastern Europe Market Value (USD Million) Forecast by Application, 2020 to 2035
  • Table 16: East Asia Market Value (USD Million) Forecast by Country, 2020 to 2035
  • Table 17: East Asia Market Value (USD Million) Forecast by Classification , 2020 to 2035
  • Table 18: East Asia Market Value (USD Million) Forecast by Application, 2020 to 2035
  • Table 19: South Asia and Pacific Market Value (USD Million) Forecast by Country, 2020 to 2035
  • Table 20: South Asia and Pacific Market Value (USD Million) Forecast by Classification , 2020 to 2035
  • Table 21: South Asia and Pacific Market Value (USD Million) Forecast by Application, 2020 to 2035
  • Table 22: Middle East & Africa Market Value (USD Million) Forecast by Country, 2020 to 2035
  • Table 23: Middle East & Africa Market Value (USD Million) Forecast by Classification , 2020 to 2035
  • Table 24: Middle East & Africa Market Value (USD Million) Forecast by Application, 2020 to 2035

List of Figures

  • Figure 1: Global Market Pricing Analysis
  • Figure 2: Global Market Value (USD Million) Forecast 2020-2035
  • Figure 3: Global Market Value Share and BPS Analysis by Classification , 2025 and 2035
  • Figure 4: Global Market Y to o to Y Growth Comparison by Classification , 2025-2035
  • Figure 5: Global Market Attractiveness Analysis by Classification
  • Figure 6: Global Market Value Share and BPS Analysis by Application, 2025 and 2035
  • Figure 7: Global Market Y to o to Y Growth Comparison by Application, 2025-2035
  • Figure 8: Global Market Attractiveness Analysis by Application
  • Figure 9: Global Market Value (USD Million) Share and BPS Analysis by Region, 2025 and 2035
  • Figure 10: Global Market Y to o to Y Growth Comparison by Region, 2025-2035
  • Figure 11: Global Market Attractiveness Analysis by Region
  • Figure 12: North America Market Incremental Dollar Opportunity, 2025-2035
  • Figure 13: Latin America Market Incremental Dollar Opportunity, 2025-2035
  • Figure 14: Western Europe Market Incremental Dollar Opportunity, 2025-2035
  • Figure 15: Eastern Europe Market Incremental Dollar Opportunity, 2025-2035
  • Figure 16: East Asia Market Incremental Dollar Opportunity, 2025-2035
  • Figure 17: South Asia and Pacific Market Incremental Dollar Opportunity, 2025-2035
  • Figure 18: Middle East & Africa Market Incremental Dollar Opportunity, 2025-2035
  • Figure 19: North America Market Value Share and BPS Analysis by Country, 2025 and 2035
  • Figure 20: North America Market Value Share and BPS Analysis by Classification , 2025 and 2035
  • Figure 21: North America Market Y to o to Y Growth Comparison by Classification , 2025-2035
  • Figure 22: North America Market Attractiveness Analysis by Classification
  • Figure 23: North America Market Value Share and BPS Analysis by Application, 2025 and 2035
  • Figure 24: North America Market Y to o to Y Growth Comparison by Application, 2025-2035
  • Figure 25: North America Market Attractiveness Analysis by Application
  • Figure 26: Latin America Market Value Share and BPS Analysis by Country, 2025 and 2035
  • Figure 27: Latin America Market Value Share and BPS Analysis by Classification , 2025 and 2035
  • Figure 28: Latin America Market Y to o to Y Growth Comparison by Classification , 2025-2035
  • Figure 29: Latin America Market Attractiveness Analysis by Classification
  • Figure 30: Latin America Market Value Share and BPS Analysis by Application, 2025 and 2035
  • Figure 31: Latin America Market Y to o to Y Growth Comparison by Application, 2025-2035
  • Figure 32: Latin America Market Attractiveness Analysis by Application
  • Figure 33: Western Europe Market Value Share and BPS Analysis by Country, 2025 and 2035
  • Figure 34: Western Europe Market Value Share and BPS Analysis by Classification , 2025 and 2035
  • Figure 35: Western Europe Market Y to o to Y Growth Comparison by Classification , 2025-2035
  • Figure 36: Western Europe Market Attractiveness Analysis by Classification
  • Figure 37: Western Europe Market Value Share and BPS Analysis by Application, 2025 and 2035
  • Figure 38: Western Europe Market Y to o to Y Growth Comparison by Application, 2025-2035
  • Figure 39: Western Europe Market Attractiveness Analysis by Application
  • Figure 40: Eastern Europe Market Value Share and BPS Analysis by Country, 2025 and 2035
  • Figure 41: Eastern Europe Market Value Share and BPS Analysis by Classification , 2025 and 2035
  • Figure 42: Eastern Europe Market Y to o to Y Growth Comparison by Classification , 2025-2035
  • Figure 43: Eastern Europe Market Attractiveness Analysis by Classification
  • Figure 44: Eastern Europe Market Value Share and BPS Analysis by Application, 2025 and 2035
  • Figure 45: Eastern Europe Market Y to o to Y Growth Comparison by Application, 2025-2035
  • Figure 46: Eastern Europe Market Attractiveness Analysis by Application
  • Figure 47: East Asia Market Value Share and BPS Analysis by Country, 2025 and 2035
  • Figure 48: East Asia Market Value Share and BPS Analysis by Classification , 2025 and 2035
  • Figure 49: East Asia Market Y to o to Y Growth Comparison by Classification , 2025-2035
  • Figure 50: East Asia Market Attractiveness Analysis by Classification
  • Figure 51: East Asia Market Value Share and BPS Analysis by Application, 2025 and 2035
  • Figure 52: East Asia Market Y to o to Y Growth Comparison by Application, 2025-2035
  • Figure 53: East Asia Market Attractiveness Analysis by Application
  • Figure 54: South Asia and Pacific Market Value Share and BPS Analysis by Country, 2025 and 2035
  • Figure 55: South Asia and Pacific Market Value Share and BPS Analysis by Classification , 2025 and 2035
  • Figure 56: South Asia and Pacific Market Y to o to Y Growth Comparison by Classification , 2025-2035
  • Figure 57: South Asia and Pacific Market Attractiveness Analysis by Classification
  • Figure 58: South Asia and Pacific Market Value Share and BPS Analysis by Application, 2025 and 2035
  • Figure 59: South Asia and Pacific Market Y to o to Y Growth Comparison by Application, 2025-2035
  • Figure 60: South Asia and Pacific Market Attractiveness Analysis by Application
  • Figure 61: Middle East & Africa Market Value Share and BPS Analysis by Country, 2025 and 2035
  • Figure 62: Middle East & Africa Market Value Share and BPS Analysis by Classification , 2025 and 2035
  • Figure 63: Middle East & Africa Market Y to o to Y Growth Comparison by Classification , 2025-2035
  • Figure 64: Middle East & Africa Market Attractiveness Analysis by Classification
  • Figure 65: Middle East & Africa Market Value Share and BPS Analysis by Application, 2025 and 2035
  • Figure 66: Middle East & Africa Market Y to o to Y Growth Comparison by Application, 2025-2035
  • Figure 67: Middle East & Africa Market Attractiveness Analysis by Application
  • Figure 68: Global Market - Tier Structure Analysis
  • Figure 69: Global Market - Company Share Analysis

Frequently Asked Questions

How big is the lane control signals market in 2025?

The global lane control signals market is estimated to be valued at USD 859.2 million in 2025.

What will be the size of lane control signals market in 2035?

The market size for the lane control signals market is projected to reach USD 1,212.0 million by 2035.

How much will be the lane control signals market growth between 2025 and 2035?

The lane control signals market is expected to grow at a 3.5% CAGR between 2025 and 2035.

What are the key product types in the lane control signals market?

The key product types in lane control signals market are LED signs and reflective material signs.

Which application segment to contribute significant share in the lane control signals market in 2025?

In terms of application, urban roads segment to command 70.0% share in the lane control signals market in 2025.

Explore Similar Insights

Future Market Insights

Lane Control Signals Market

Chat With MaRIA

Chat With

MaRIA

Hi There, I am MaRIA, Your Market Research Intelligence Assistant. How may I help you?