

- Market Size (2026)
- USD 1300.0 Mn
- Forecast (2036)
- USD 3100.0 Mn
- CAGR (2026 to 2036)
- 9.1%
How big is Megawatt Charging Connector Systems Market in 2026?
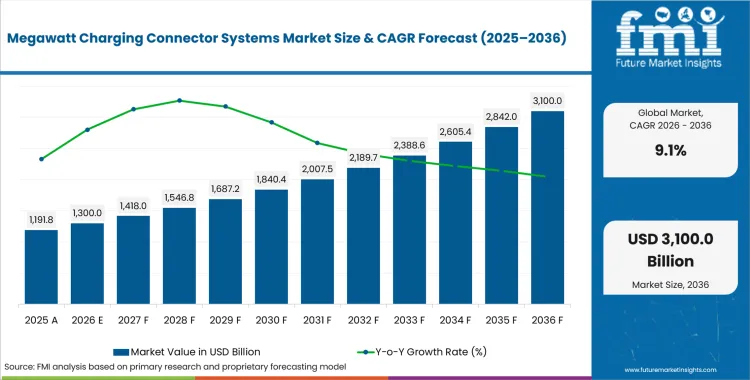
USD 1300.0 million in 2026 and USD 3100.0 million by 2036 at a 9.1% CAGR.
Sales of megawatt charging connector systems are projected to expand at 9.1% CAGR from 2026 to 2036, lifting valuation from USD 1300.0 million to USD 3100.0 million. The industry is expected to rise as series-production truck programs began ordering high-power charging hardware beyond pilot interfaces. In January 2026 the International Electrotechnical Commission published IEC TS 63379 for MCS couplers rated to 1500 volts and 3000 amperes. The specification gives connector manufacturers a shared design boundary for inlet geometry and current transfer across vehicle and charger programs. Commercial qualification now requires stable heat removal and communication throughout repeated high-current sessions under field operating conditions. Field service requirements must therefore be defined during product qualification instead of becoming a separate installation decision.
United States projects emphasize utility coordination and field validation across freight corridors with concentrated truck activity. German programs combine motorway sites with vehicle manufacturers; Chinese planning links high-power facilities with transport and distribution-grid plans. In January 2025 the National Renewable Energy Laboratory reported that multi-truck charging stations could require 20 megawatts or more. That load turns connector selection into a complete site program involving electrical infrastructure and operational controls. Site developers must align utility capacity with electric truck schedules during the earliest stages of facility design. Fleet management integration must coordinate charging windows with dispatch priorities across every scheduled operating period at each location. Modular architecture supports phased commissioning, although interconnection queues and local service capacity remain material constraints.
Key Takeaways of Megawatt Charging Connector Systems Market
- Electric truck programs support demand as higher charging power must fit regulated driver breaks without disrupting scheduled freight operations.
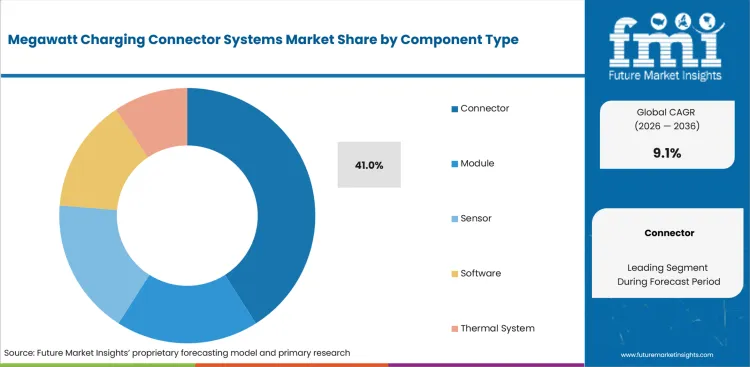
- Connector is expected to account for 41.0% in 2026 owing to direct thermal and mechanical exposure at the charging interface.
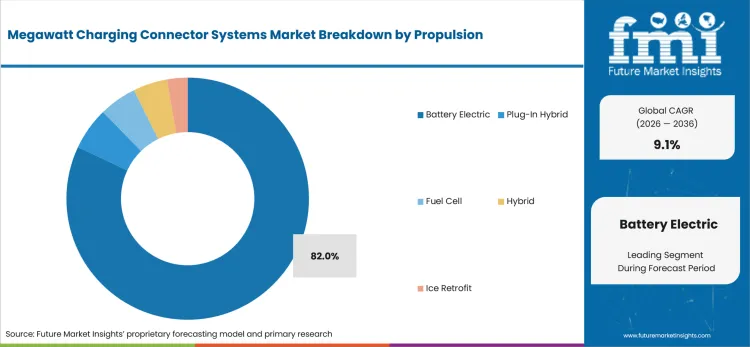
- Battery electric propulsion is projected to represent 82.0% of demand in 2026 owing to direct use across large commercial traction batteries.
- OEM sales channels are estimated to represent 24.0% share in 2026 attributable to platform qualification and coordinated inlet integration.
- Grid upgrades and thermal validation remain material barriers, and cross-brand communication tests can delay equipment commissioning across high-power freight sites.
- Competition combines integrated platforms from ABB E-mobility and Kempower with scalable Siemens architecture and Milence public deployment experience.
Analyst Perspective
“The decisive commercial test is whether an MCS connector delivers repeatable current without disrupting scheduled truck departures or field maintenance. Fleet economics weaken if heat control or charging communication fails during a planned driver break at a busy depot. Manufacturers that publish cross-brand test results and design replaceable interface components can progress more reliably from technical trials to corridor-scale orders.”
- Nikhil Kaitwade, Principal Analyst, Future Market Insights
How is the Megawatt Charging Connector Systems Market segmented?
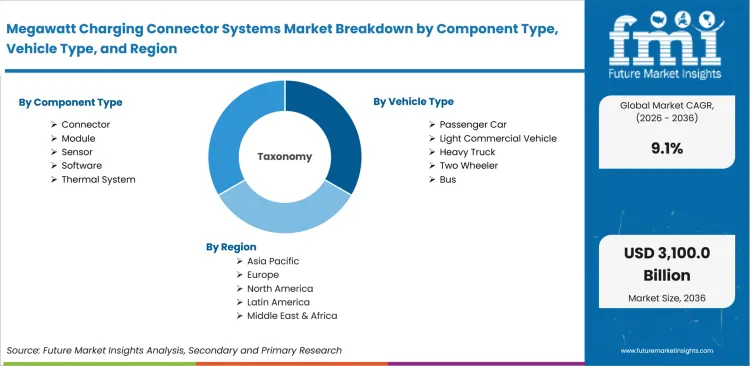
The megawatt charging connector systems industry is segmented by component type, vehicle type, propulsion, sales channel, and region.
The market is segmented by component type, vehicle type, propulsion, sales channel, and region. Component type includes sensor, module, connector, software, and thermal system. Vehicle type covers passenger car, light commercial vehicle, heavy truck, two wheeler, and bus. Propulsion includes battery electric, plug-in hybrid, fuel cell, hybrid, and ICE retrofit. Sales channel comprises OEM, aftermarket, fleet operators, distributors, and direct sales. Regional assessment covers North America, Latin America, Western Europe, Eastern Europe, East Asia, South Asia and Pacific, and the Middle East and Africa.
What supports demand for connector within the component type category?
Connector performance defines current transfer and cooling at the vehicle interface during repeated freight charging sessions. SAE International issued J3271 in March 2025 to organize MCS requirements across couplers and communication controls. The standard also addresses cable handling and interoperability test procedures for high-power commercial vehicle charging across several use cases. Engineering teams can therefore validate geometry and current behavior through one shared technical framework before series release.
- Connector is set to lead the component type category with 41.0% share in 2026 due to direct exposure to current transfer and repeated mechanical handling. Component spending covers automotive connector contacts and housings alongside latches and liquid-cooled cable assemblies exposed to repeated heat and handling. Replacement demand reinforces the position as interface damage can disable otherwise functional charging equipment during commercial service.
- Fleet maintenance teams prefer connector assemblies that technicians can inspect and replace without removing the complete power cabinet. Modular cable sets reduce downtime and let service intervals follow measured wear at high-use freight locations. Documented durability testing gives operators a clearer basis for setting inspection intervals across sealing points and current-carrying contacts.
Why does passenger car retain a role within the vehicle type category?
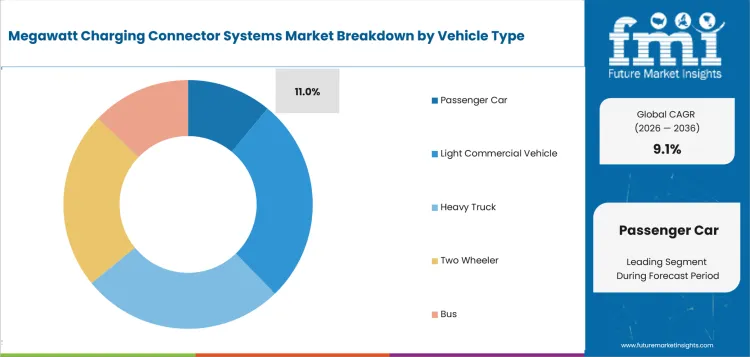
Passenger cars remain a secondary use case as MCS development centers on heavy commercial battery requirements. Mixed charging locations nevertheless need productive use from expensive power cabinets during early truck adoption. In May 2026 Kempower introduced Mega Satellite Flex with MCS and CCS connections through one dispenser. The configuration supports compatible passenger vehicles beside commercial lanes and improves equipment utilization during staged site expansion.
- Passenger car is projected to hold 11.0% share in 2026 owing to mixed-site utilization and shared power cabinets across vehicle classes. The share does not represent ordinary passenger use of a dedicated MCS interface across public charging networks. It reflects supporting equipment that serves passenger vehicles beside commercial lanes without duplicating controls or large power cabinets.
- Charging operators treat passenger compatibility as an equipment-utilization measure rather than the primary MCS design objective. Mixed outlets create billable CCS sessions during limited truck traffic and broaden use across electric vehicle battery sizes. Dynamic power controls must reserve adequate capacity for trucks during scheduled freight peaks at depot and corridor locations.
How does battery electric shape demand within the propulsion category?
Battery electric trucks require rapid energy transfer across large traction packs during predictable driver rest periods. CharIN held its first dedicated MCS Controller Testival in April 2025 with eight testing slots for communication hardware. The event exposed controller conflicts through focused cross-brand testing across truck and charger platforms under realistic communication sequences. Vehicle and charger manufacturers must therefore validate communication separately from connector geometry during commercial equipment approval.
- By propulsion, battery electric is forecast to represent 82.0% in 2026 driven by direct use across large commercial traction batteries during scheduled route pauses. Plug-in hybrid and fuel-cell platforms use smaller traction batteries or separate energy routes that reduce direct MCS requirements. Battery electric trucks therefore create the clearest link between connector capacity and scheduled long-haul charging.
- Heavy fleet operators prioritize systems that deliver repeatable charging inside planned driver breaks across several truck brands. Software-controlled power sharing directs available site capacity among battery electric vehicles at mixed depot operations. Acceptance testing compares grid-delivered power with nominal connector ratings so local supply limits do not hide reduced multi-vehicle performance.
Why do OEM channels remain central within the sales channel category?
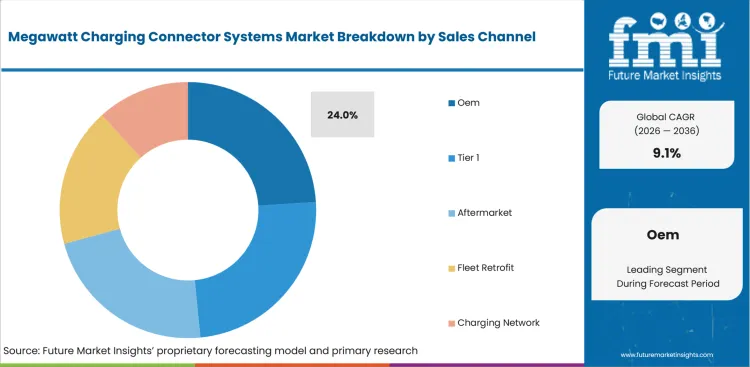
Vehicle manufacturers control inlet packaging and safety approval before a connector enters a series-production truck program. The charging cable and plug specification therefore begins inside vehicle development rather than through independent aftermarket purchasing. In February 2026 TE Connectivity executed a strategic asset transaction covering major charging-inlet operations from Phoenix Contact E-Mobility. The transaction expands TE inlet capabilities and supports continuity for existing OEM programs during integration.
- The sales channel category is forecast to be led by OEM at 24.0% share in 2026 due to platform qualification and coordinated vehicle integration. An interface approved during truck development can enter several fleet orders through the same vehicle architecture and qualification route. The channel concentrates responsibility for geometry and communication behavior within the vehicle warranty and release process.
- Connector manufacturers serving OEM programs join design reviews and prototype builds across several engineering locations. Each approved interface revision must remain linked to vehicle release documentation and service instructions across every model. Qualification takes longer than direct fleet purchasing, yet one successful platform approval can support repeat volume across model years and regional programs.
What are the drivers, restraints, and opportunities in the Megawatt Charging Connector Systems Market?
Heavy electric truck deployment supports demand; grid and interoperability work extends installation timing. Verified cross-brand performance creates an opening for companies that can document stable MCS operation.
- Driver: Series-produced electric trucks require charging power that fits scheduled operating breaks and preserves freight asset utilization across daily routes.
- Restraint: Grid interconnection and thermal validation extend deployment schedules, and cross-brand communication testing can outlast planned vehicle delivery dates.
- Opportunity: Verified interoperability records help charging manufacturers convert cross-brand trials into fleet approvals and repeat corridor equipment orders.
Vehicle programs create direct demand pressure as large traction batteries require rapid charging during limited operating pauses. Daimler Truck reported in March 2026 that two eActros 600 prototype trucks completed a long-distance MCS test across chargers from several manufacturers. The company also scheduled customer trials for MCS-capable trucks during real logistics operations in the second half of 2026. The test program moves connector qualification from laboratory compatibility toward route-based testing across several public and private charging systems. Charging manufacturers need validated communication and sustained current delivery before fleet trials can progress into ordered corridor equipment.
Grid capacity forms the principal restraint as rated connector power does not guarantee usable output at the charging location. The California Energy Commission reported in March 2026 that limited grid capacity creates lengthy and expensive delays for high-power charging projects. Its final report tested power electronics that combine charging with distributed energy resources and advanced power management. Megawatt projects therefore need utility studies early enough to coordinate equipment commissioning with grid construction. Charging manufacturers face deferred revenue if site construction advances ahead of interconnection approval or vehicle delivery.
Verified interoperability is one of the lucrative opportunity for manufacturers that can document stable operation across truck and charger brands. ABB E-mobility reported in September 2025 that joint MCS testing with MAN covered communication and performance validation. The program also examined emergency shutdown behavior and long-duration charging stability under demanding operating conditions. Documented results give fleet engineering teams a clearer basis for comparing equipment across several truck platforms. Published test records and assigned maintenance responsibility can shorten the route from trial sessions to repeat orders.
Which country CAGRs are profiled in the Megawatt Charging Connector Systems Market?
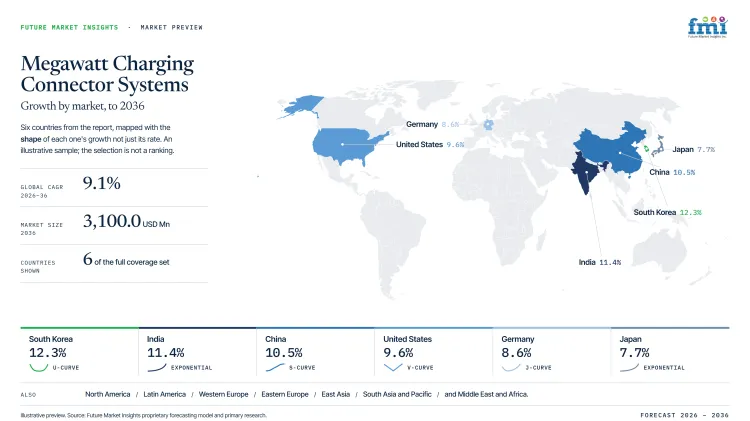
| Country | CAGR |
|---|---|
| South Korea | 12.3% |
| India | 11.4% |
| China | 10.5% |
| United States | 9.6% |
| Germany | 8.6% |
| Japan | 7.7% |
How do country-level CAGRs compare in the Megawatt Charging Connector Systems Market?
The six-country comparison spans 4.6 percentage points and separates rapid infrastructure buildout from more deliberate equipment qualification. South Korea and India form a closely grouped upper pair with a measured difference of 0.9 percentage points. India and China show the same spacing; China remains 0.9 percentage points above the United States. The widest adjacent difference reaches 1.0 percentage point between the United States and Germany within the displayed results. Germany and Japan return to a 0.9-point interval at the lower end of the comparison. These narrow gaps place greater weight on local service capacity and grid readiness than headline growth differences. Manufacturers with resident engineering teams can convert approved projects more consistently across otherwise similar national forecasts.
- South Korea links public charging support with enforceable maintenance duties across eligible commercial depots and logistics facilities.
- India combines direct electric-truck incentives with uneven high-capacity charging access across major freight corridors and secondary logistics locations.
- China coordinates high-power charging construction with distribution-grid planning and operating standards for logistics and heavy-vehicle applications.
- The United States combines concentrated freight activity with lengthy interconnection studies and sharply different utility economics across individual states.
- Germany uses motorway demonstrations and coordinated vehicle testing to reduce technical uncertainty at public truck-charging locations.
- Japan links commercial vehicle support with jointly installed charging equipment, although compact depots and deliberate qualification schedules constrain megawatt deployment.
Commercial execution and local service coverage therefore decide outcomes across national forecasts separated by relatively small percentage-point differences.
Comparable country forecasts still produce different deployment conditions because grid access and service coverage vary across freight corridors. Connector manufacturers must compare installation schedules and maintenance responsibility rather than relying on small CAGR differences. The full report provides country-level CAGR analysis across North America, Latin America, Europe, East Asia, South Asia, Oceania and the Middle East and Africa.
Country-wise Analysis
- South Korean charging projects use public support programs that cover commercial depots and logistics facilities. In February 2025 the Ministry of Environment reported a 43% budget increase and stronger maintenance duties for supported charging installations. The South Korea megawatt charging connector systems sector is projected to record 12.3% CAGR during the assessment period, aided by public charging support and enforceable maintenance obligations. The revised obligations connect public funding with repair accountability and create a direct local deployment enabler. Grid capacity remains a material friction at freight facilities outside established urban charging and service networks. Connector manufacturers need verified response times and regional spare-parts routes alongside equipment ratings during commercial bidding.
- Indian fleet electrification combines direct truck incentives with charging capacity that varies sharply across freight corridors. India's megawatt charging connector systems market is estimated to post 11.4% CAGR over the forecast period, influenced by incentives for N2 and N3 electric trucks and associated depot charging. In July 2025 the Ministry of Heavy Industries launched incentives for N2 and N3 electric trucks. The program targets approximately 5,600 vehicles and requires the scrapping of an older truck for eligibility. Qualified vehicle orders create a direct enabler for coordinated OEM charging projects at large depots. Limited high-capacity grid access remains a material friction beyond major logistics clusters and industrial zones. Modular systems and local service contracts reduce exposure during phased development across freight corridors with uneven infrastructure.
- Chinese deployment planning treats high-power charging as a coordinated transport and distribution-grid requirement for freight applications. In June 2025 national authorities directed provinces to plan high-power facilities alongside transport and distribution-grid plans. The same guidance calls for megawatt charging pilots involving electric heavy trucks and large traction batteries. China's megawatt charging connector systems outlook is anticipated to advance at 10.5% CAGR over the assessment period, supported by national high-power charging planning and distribution-grid coordination. Domestic manufacturing capacity provides a direct enabler through broad access to vehicle and charging equipment. Local approvals remain a material friction as distribution upgrades delay sites outside established industrial corridors. Successful bids require local engineering coverage and documented grid coordination across each proposed freight location.
- United States freight charging projects require early agreements among fleet operators and utilities throughout commercial site commissioning. Megawatt charging connector systems demand in the United States is forecast to rise at 9.6% CAGR over the forecast period, reinforced by large freight hubs and investment in grid-aware charging projects. Interconnection studies and demand charges remain material frictions even at locations with concentrated truck activity. In January 2025 the Department of Energy announced USD 68 million for commercial vehicle charging projects. Selected projects combine MCS-compatible charging with distributed energy resources at freight sites facing constrained grid access. Large freight hubs provide a direct enabler through concentrated demand and experienced charging-site developers in major logistics regions. Contracts should separate grid readiness from equipment acceptance so accountability remains clear across every project milestone.
- German market activity combines motorway locations with truck manufacturers and applied research organizations through coordinated field programs. In September 2025 NOW GmbH reported that Germany’s first public MCS charging point entered operation on the A2 motorway. Adoption of megawatt charging connector systems in Germany is estimated to expand at 8.6% CAGR through 2036, shaped by public motorway trials and coordinated vehicle testing. The installation creates a direct enabler by testing several truck platforms through one public-road charging location. High-voltage connections and site permits remain material frictions across additional freight routes and motorway locations. Local engineering partners shorten troubleshooting by giving charger and vehicle teams direct access during coordinated operating sessions.
- Japanese commercial vehicle programs connect charging-equipment support with vehicle deployment rather than broad public-network expansion. Megawatt charging connector systems demand within Japan is predicted to advance at 7.7% CAGR through 2036, facilitated by joint support for electric commercial vehicles and associated charging equipment. A joint funding route provides a direct enabler by aligning truck and charger decisions within one project. In April 2026 Japan’s Ministry of the Environment opened applications for support covering electric commercial vehicles and charging equipment installed with them. The program gives logistics companies a clearer purchasing route for coordinated fleet and depot projects. Limited depot space remains a material friction, and deliberate qualification schedules can extend megawatt equipment approvals. Charging manufacturers need compact cable paths and dependable maintenance access that preserve vehicle movement at dense logistics locations.
Who are the notable companies in the Megawatt Charging Connector Systems Market?
ABB E-mobility, Kempower, Siemens, Amphenol, TE Connectivity, HUBER+SUHNER, Stäubli and Milence are the notable companies shaping this market.
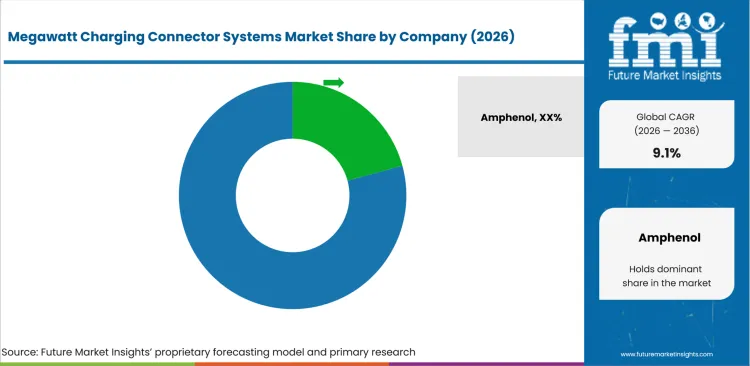
The competitive field combines integrated charging platforms with high-current interface specialists and one public network operator serving freight corridors. ABB E-mobility and Kempower supply integrated power systems and Siemens adds scalable architecture for mixed CCS and MCS sites. Amphenol and Stäubli focus on high-current connector engineering alongside HUBER+SUHNER liquid-cooled cable assemblies for heavy vehicles. TE Connectivity supports charging-inlet programs through automotive engineering and production networks across several manufacturing regions. Milence contributes public deployment evidence through operational truck-charging hubs across European freight corridors and network expansion programs. Commercial comparisons should prioritize verified interoperability and maintenance coverage rather than nominal peak power ratings.
- ABB E-mobility and Kempower focus on platforms that combine power cabinets with dispensers and site software. Siemens adds modular architecture for mixed connector configurations and staged capacity growth across expanding commercial charging locations. Fleet engineering teams should verify sustained current delivery and remote support under realistic thermal conditions.
- Amphenol and Stäubli focus on high-current plugs and inlets with cooled charging cable assemblies for MCS duty. HUBER+SUHNER supplies liquid-cooled cable systems and TE Connectivity supports charging-inlet programs across regional vehicle platforms. Program continuity remains decisive as interface changes affect vehicle approvals and station maintenance across several model years.
- Milence shapes demand through public MCS deployment and corridor operations across Europe rather than component manufacturing. Its operating sites provide evidence for truck access and charging-bay design across real freight schedules. Network operation also reveals practical constraints involving reservations and utility capacity alongside maintenance response across long-distance routes.
Competitive Benchmarking: Megawatt Charging Connector Systems Market
| Company | MCS Hardware | Thermal and Interoperability Support | Deployment and Lifecycle Support | Geographic Reach |
|---|---|---|---|---|
| ABB E-mobility | High | High | High | Global |
| Kempower | High | High | High | Europe and North America |
| Siemens | High | Medium | Medium | Global |
| Amphenol | High | Medium | Low | Global |
| TE Connectivity | Medium | Medium | Low | Global |
| HUBER+SUHNER | High | High | Medium | Global |
| Stäubli | High | High | Medium | Global |
| Milence | Low | Medium | High | Europe |
Key Developments in the Megawatt Charging Connector Systems Market
- In April 2025, ABB E-mobility launched the MCS1200 alongside two chargers designed for different vehicle and site requirements. The company positioned the MCS1200 for heavy-duty use through a shared platform architecture that supports consistent service procedures. The launch gave truck-charging projects a defined commercial megawatt system rather than a prototype interface. Fleet programs also gained remote asset management and documented service support across high-power installations and daily freight operations.
- In February 2025, Milence deployed its first MCS solution at the Port of Antwerp-Bruges truck hub. The installation added two high-power chargers following technical tests completed during 2024 across truck and charging equipment. Milence linked the project with its planned European megawatt corridor across major freight routes and logistics hubs. The operating site gives fleet companies field evidence about vehicle access and payment workflows alongside charging performance.
- In October 2025, Siemens introduced SICHARGE FLEX with output ranging from 480 kilowatts to more than 1.68 megawatts. The architecture supports CCS and as many as four MCS charging points through one scalable power system. Siemens also reported an initial commercial order from OMV for an Austrian location serving heavy transport. The launch created a staged route for mixed sites expecting truck volumes and power requirements to increase.
- In July 2026, Kempower started deliveries of the Mega Satellite Flex dispenser with CCS and MCS connectors. The system provides megawatt-class output and allocates power across multi-vehicle operations using shared cabinets and distributed controls. Kempower also reported more than 4,300 MCS charging sessions by July 1 across earlier programs. The delivery milestone converted prior testing into a commercially supplied mixed-connector platform for fleet and public charging sites.
Key Players in the Megawatt Charging Connector Systems Market
Integrated MCS Charging Platforms
- ABB E-mobility
- Kempower
- Siemens
Connector and Vehicle Interface Providers
- Amphenol
- TE Connectivity
- HUBER+SUHNER
- Stäubli
Public Charging Network Operator
- Milence
Megawatt Charging Connector Systems Market - Report Scope
| Coverage field | Report scope |
|---|---|
| Market breakdown | Component Type, Vehicle Type, Propulsion, Sales Channel, and Region. |
| Quantitative Units | USD Million, CAGR in %. |
| Market Definition | Commercially tracked demand for MCS connectors, vehicle inlets, cooled cable assemblies, control modules, software and thermal systems used in megawatt-scale DC charging. |
| Regions Covered | North America, Latin America, Western Europe, Eastern Europe, East Asia, South Asia and Pacific, and Middle East and Africa. |
| Countries Covered | United States, Germany, China, Japan, South Korea, India, and 30+ countries. |
| Key Companies Profiled | ABB E-mobility, Kempower, Siemens, Amphenol, TE Connectivity, HUBER+SUHNER, Stäubli and Milence. |
| Forecast Period | 2026 to 2036. |
| Approach | Hybrid bottom-up and top-down market sizing supported by primary interviews and official desk research. |
Megawatt Charging Connector Systems Market - Research Methodology
| Method | Approach |
|---|---|
| Primary Research | FMI analysts gathered input from manufacturers, service providers, technology developers, distributors, end users, Sourcing teams, and subject-matter experts. Interviews examined purchasing decisions, product or service evaluation, adoption barriers, approval requirements, pricing considerations, and expectations for technical or commercial support. Respondents were also asked what evidence is required before a trial, pilot, or initial order develops into regular purchasing. |
| Desk Research | Desk research covered government statistics, regulatory publications, trade data, industry associations, technical literature, standards, company filings, product information, and official corporate announcements. Sources were reviewed for relevance, publication date, geographic coverage, and consistency with the defined market scope. Claims relating to performance, applications, approvals, capacity, investment, and commercial activity were retained only when supported by credible public evidence. |
| Market Sizing and Forecasting | The market model combined the baseline value with historical performance, segment structure, pricing and volume indicators, adoption levels, company participation, and country-level demand conditions. Forecast assumptions considered economic activity, investment trends, regulatory developments, technology adoption, purchasing cycles, supply availability, and barriers to wider market use. Segment and regional estimates were reconciled before the final market total was calculated. |
| Data Validation | Estimates were checked against multiple independent indicators, including public data, company activity, trade patterns, industry developments, and findings from primary interviews. Validation also tested whether products, services, applications, and company revenues fell within the defined market boundaries. Adjacent categories, unsupported claims, overlapping revenues, and activities without direct market relevance were excluded to reduce double counting and maintain consistency across segments and countries. |
Megawatt Charging Connector Systems Market by Segments
Megawatt Charging Connector Systems Market segmented by Component Type:
- Sensor
- Module
- Connector
- Software
- Thermal System
Megawatt Charging Connector Systems Market segmented by Vehicle Type:
- Passenger Car
- Light Commercial Vehicle
- Heavy Truck
- Two Wheeler
- Bus
Megawatt Charging Connector Systems Market segmented by Propulsion:
- Battery Electric
- Plug-in Hybrid
- Fuel Cell
- Hybrid
- ICE Retrofit
Megawatt Charging Connector Systems Market segmented by Sales Channel:
- OEM
- Aftermarket
- Fleet Operators
- Distributors
- Direct Sales
Megawatt Charging Connector Systems Market by Region:
- North America
- United States
- Canada
- Latin America
- Brazil
- Mexico
- Argentina
- Chile
- Western Europe
- Germany
- France
- United Kingdom
- Italy
- Spain
- Benelux
- Nordics
- Eastern Europe
- Poland
- Czech Republic
- Romania
- Hungary
- East Asia
- China
- Japan
- South Korea
- South Asia and Pacific
- India
- ASEAN
- Australia and New Zealand
- Middle East and Africa
- GCC Countries
- South Africa
- Türkiye
- Israel
Research Sources and Bibliography
- International Electrotechnical Commission. (2026, January 28). IEC TS 63379:2026: Vehicle connector, vehicle inlet and cable assembly for megawatt DC charging.
- SAE International. (2025, March 5). J3271_202503 SAE Megawatt Charging System for Electric Vehicles.
- National Renewable Energy Laboratory. (2025, January 15). The Dawn of Electric Trucking Calls for High-Power Charging.
- Daimler Truck. (2026, March 19). Long-distance test drive: Mercedes-Benz eActros 600 delivers key insights for megawatt charging in long-haul operations.
- California Energy Commission. (2026, March 11). Design, Build and Test an Advanced Power Electronics Module That Enables Electric Vehicle Ultra-Fast Charging With Limited Grid Capacity.
- Charging Interface Initiative. (2025, April 3). Revolutionizing Heavy-Duty Electric Vehicle Charging: CharIN MCS Controller Testival 2025.
- Ministry of Environment, Republic of Korea. (2025, February 26). Full-Scale Promotion of Electric Vehicle Charging Facility Support in 2025.
- Press Information Bureau, Government of India. (2025, July 11). India Rolls Out First-Ever e-Truck Incentive Scheme Under PM Modi’s Green Mobility Vision.
- National Development and Reform Commission. (2025, June 13).[Notice on promoting the scientific planning and construction of high-power charging facilities].
- Ministry of the Environment, Government of Japan. (2026, April 24).[Call for applications under the FY2025 supplementary budget commercial vehicle electrification promotion project (trucks, taxis, and buses)].
- NOW GmbH. (2025, September 30). Forschungsprojekt HoLa: Erster Megawatt-Ladepunkt für E-Lkw in Betrieb.
- USA Department of Energy. (2025, January 15). DOE Invests $68 Million in Innovative Heavy-Duty Electric Vehicle Charging Solutions.
- ABB E-mobility. (2025, April 24). Unified Architecture Meets Segment-Specific Needs as ABB E-mobility Launches Trio of New EV Chargers.
- ABB E-mobility. (2025, September 23). MAN and ABB E-mobility Conduct Landmark MCS Test Week.
- Kempower. (2026, May 6). Kempower introduces Mega Satellite Flex to support the transition to megawatt charging.
- TE Connectivity. (2026, February 28). TE Connectivity acquires EV charging inlet assets from Phoenix Contact.
- Milence. (2025, February 25). Milence deploys its first Megawatt Charging System solution at the Port of Antwerp Bruges.
- Siemens. (2025, October 4). SICHARGE FLEX: Siemens unveils Next-Gen EV Charging System for the Megawatt era.
- Kempower. (2026, July 2). Mega Satellite Flex is here! Kempower starts deliveries of its latest scalable EV charging solution.
- Amphenol. (n.d.). MCS. Retrieved July 24, 2026.
- HUBER+SUHNER. (n.d.). Megawatt Charging System (MCS). Retrieved July 24, 2026.
- Stäubli Electrical Connectors. (n.d.). Megawatt Charging System (MCS) for commercial vehicles. Retrieved July 24, 2026.
This bibliography is provided for reader reference and is not exhaustive. The full report contains the complete reference list and detailed citations.
This Report Answers
- How large is the megawatt charging connector systems market in 2025, 2026 and 2036?
- Which component technologies carry the largest 2026 share and require the most demanding thermal validation?
- Why does battery electric propulsion account for most megawatt charging connector demand in 2026?
- How do OEM and direct fleet purchasing routes differ across connector qualification and service responsibility?
- How do approved country growth rates differ through 2036 across the six profiled national markets?
- How do grid capacity and interoperability testing affect project schedules and equipment utilization?
- Which companies provide connectors, charging platforms or public MCS deployment across major regions?
- What operating evidence should fleet engineering teams require before approving a megawatt charging system?
- How do mixed CCS and MCS platforms reduce early utilization risk during infrastructure expansion?
Frequently Asked Questions
What is driving growth in the megawatt charging connector systems market?
Series-produced electric trucks require substantially higher charging power during regulated driver breaks and tightly planned freight schedules. MCS equipment transfers more energy without extending truck downtime beyond the operating pauses already built into long-distance routes.
Who are the key players in the megawatt charging connector systems market?
ABB E-mobility and Kempower provide integrated charging platforms as Siemens supplies scalable architecture for mixed charging locations. Amphenol and Stäubli focus on high-current interfaces as HUBER+SUHNER and TE Connectivity support cable or inlet programs.
What is a notable restraint in the megawatt charging connector systems market?
Grid interconnection and thermal validation can delay commissioning at locations with constrained utility capacity and limited service coverage. Communication conflicts can also prevent compatible equipment from reaching rated output during coordinated multi-vehicle charging operations.
Why should executives track the megawatt charging connector systems market?
Megawatt charging directly affects truck utilization and depot investment across long-haul freight programs with narrow operating windows. Early interface choices also determine maintenance responsibility and interoperability costs across later fleet and corridor expansion.
What business problem does the megawatt charging connector systems market address?
The market addresses charging delays for large commercial traction batteries during limited operating pauses across freight routes. MCS interfaces support rapid energy transfer and preserve truck availability across planned depot and corridor dispatch schedules.
What should fleet and charging teams evaluate in the megawatt charging connector systems market?
Engineering teams should verify sustained current delivery and cross-brand communication under realistic site conditions and vehicle schedules. Local maintenance coverage and grid capacity belong in the same approval decision as equipment pricing and nominal power.
What limits return on investment in the megawatt charging connector systems market?
Low equipment utilization and delayed grid connections weaken returns across early high-power truck-charging locations with limited traffic. Unclear service obligations can extend downtime during the freight periods that originally justified the megawatt equipment investment.
What supports long-term confidence in the megawatt charging connector systems market?
Published standards create common requirements for connector geometry and charging communication across vehicle and charger manufacturers. Commercial deployments add field evidence about reliability and service response across complete sites rather than isolated laboratory equipment.
Preview the report firsthand - request a free sample
Get SampleGet the brochure for pricing and purchase details.
Get PDFTable of Content
- Key Takeaways
- Market Size and CAGR
- Top Growth Driver
- Fastest Growing Segment
- Leading Region
- Key Companies
- Emerging Opportunities
- Executive Summary
- Global Market Outlook
- Demand-side Trends
- Supply-side Trends
- Technology Roadmap Analysis
- Analysis and Recommendations
- Analyst Perspective (What is happening? Why now? What should investors know?)
- Key Questions Answered
- How large is the market?
- What is the CAGR?
- What are key trends?
- Which region dominates?
- Who are the leaders?
- Market Overview
- Market Coverage / Taxonomy
- Market Definition / Scope / Limitations
- Research Methodology
- Chapter Orientation
- Analytical Lens and Working Hypotheses
- Market Structure, Signals, and Trend Drivers
- Benchmarking and Cross-market Comparability
- Market Sizing, Forecasting, and Opportunity Mapping
- Research Design and Evidence Framework
- Desk Research Programme (Secondary Evidence)
- Expert Input and Fieldwork (Primary Evidence)
- Tooling, Models, and Reference Databases
- Data Engineering and Model Build
- Quality Assurance and Audit Trail
- Market Background
- Market Dynamics (Drivers, Restraints, Opportunity, Trends)
- Scenario Forecast (Optimistic, Likely, Conservative)
- Impact Analysis
- AI Impact
- Sustainability Impact
- Regulatory Impact
- Technology Impact
- Consumer / Buyer Analysis
- Purchase Drivers
- Adoption Barriers
- Buyer Journey
- Opportunity Map Analysis
- Product Life Cycle Analysis
- Supply Chain Analysis
- Investment Feasibility Matrix
- Value Chain Analysis
- PESTLE and Porter's Analysis
- Regulatory Landscape
- Regional Parent Market Outlook
- Production and Consumption Statistics
- Import and Export Statistics
- Global Market Analysis and Forecast, 2021 to 2036
- Historical Market Size Value (USD Billion) Analysis, 2021 to 2025
- Current and Future Market Size Value (USD Billion) Projections, 2026 to 2036
- Y-o-Y Growth Trend Analysis
- Absolute $ Opportunity Analysis
- Global Market Pricing Analysis, 2021 to 2036
- Global Market Analysis and Forecast, By Component Type, 2021 to 2036
- Introduction / Key Findings
- Historical Market Size Value (USD Billion) Analysis By Component Type, 2021 to 2025
- Current and Future Market Size Value (USD Billion) Analysis and Forecast By Component Type, 2026 to 2036
- Connector
- Module
- Sensor
- Software
- Thermal System
- Connector
- Y-o-Y Growth Trend Analysis By Component Type, 2021 to 2025
- Absolute $ Opportunity Analysis By Component Type, 2026 to 2036
- Global Market Analysis and Forecast, By Vehicle Type, 2021 to 2036
- Introduction / Key Findings
- Historical Market Size Value (USD Billion) Analysis By Vehicle Type, 2021 to 2025
- Current and Future Market Size Value (USD Billion) Analysis and Forecast By Vehicle Type, 2026 to 2036
- Passenger Car
- Light Commercial Vehicle
- Heavy Truck
- Two Wheeler
- Bus
- Passenger Car
- Y-o-Y Growth Trend Analysis By Vehicle Type, 2021 to 2025
- Absolute $ Opportunity Analysis By Vehicle Type, 2026 to 2036
- Global Market Analysis and Forecast, By Propulsion, 2021 to 2036
- Introduction / Key Findings
- Historical Market Size Value (USD Billion) Analysis By Propulsion, 2021 to 2025
- Current and Future Market Size Value (USD Billion) Analysis and Forecast By Propulsion, 2026 to 2036
- Battery Electric
- Plug-In Hybrid
- Fuel Cell
- Hybrid
- Ice Retrofit
- Battery Electric
- Y-o-Y Growth Trend Analysis By Propulsion, 2021 to 2025
- Absolute $ Opportunity Analysis By Propulsion, 2026 to 2036
- Global Market Analysis and Forecast, By Sales Channel, 2021 to 2036
- Introduction / Key Findings
- Historical Market Size Value (USD Billion) Analysis By Sales Channel, 2021 to 2025
- Current and Future Market Size Value (USD Billion) Analysis and Forecast By Sales Channel, 2026 to 2036
- Oem
- Tier 1
- Aftermarket
- Fleet Retrofit
- Charging Network
- Oem
- Y-o-Y Growth Trend Analysis By Sales Channel, 2021 to 2025
- Absolute $ Opportunity Analysis By Sales Channel, 2026 to 2036
- Global Market Analysis and Forecast, By Region, 2021 to 2036
- Introduction
- Historical Market Size Value (USD Billion) Analysis By Region, 2021 to 2025
- Current Market Size Value (USD Billion) Analysis and Forecast By Region, 2026 to 2036
- North America
- Latin America
- Western Europe
- Eastern Europe
- East Asia
- South Asia and Pacific
- Middle East & Africa
- Market Attractiveness Analysis By Region
- North America Market Analysis and Forecast, By Country, 2021 to 2036
- Historical Market Size Value (USD Billion) Trend Analysis By Market Taxonomy, 2021 to 2025
- Market Size Value (USD Billion) Forecast By Market Taxonomy, 2026 to 2036
- By Country
- USA
- Canada
- By Component Type
- By Vehicle Type
- By Propulsion
- By Sales Channel
- By Country
- Market Attractiveness Analysis
- By Country
- By Component Type
- By Vehicle Type
- By Propulsion
- By Sales Channel
- Key Takeaways
- Latin America Market Analysis and Forecast, By Country
- Historical Market Size Value (USD Billion) Trend Analysis By Market Taxonomy, 2021 to 2025
- Market Size Value (USD Billion) Forecast By Market Taxonomy, 2026 to 2036
- By Country
- Brazil
- Mexico
- Chile
- Rest of Latin America
- By Component Type
- By Vehicle Type
- By Propulsion
- By Sales Channel
- By Country
- Market Attractiveness Analysis
- By Country
- By Component Type
- By Vehicle Type
- By Propulsion
- By Sales Channel
- Key Takeaways
- Western Europe Market Analysis and Forecast, By Country
- Historical Market Size Value (USD Billion) Trend Analysis By Market Taxonomy, 2021 to 2025
- Market Size Value (USD Billion) Forecast By Market Taxonomy, 2026 to 2036
- By Country
- Germany
- UK
- Italy
- Spain
- France
- Nordic
- BENELUX
- Rest of Western Europe
- By Component Type
- By Vehicle Type
- By Propulsion
- By Sales Channel
- By Country
- Market Attractiveness Analysis
- By Country
- By Component Type
- By Vehicle Type
- By Propulsion
- By Sales Channel
- Key Takeaways
- Eastern Europe Market Analysis and Forecast, By Country
- Historical Market Size Value (USD Billion) Trend Analysis By Market Taxonomy, 2021 to 2025
- Market Size Value (USD Billion) Forecast By Market Taxonomy, 2026 to 2036
- By Country
- Russia
- Poland
- Hungary
- Balkan & Baltic
- Rest of Eastern Europe
- By Component Type
- By Vehicle Type
- By Propulsion
- By Sales Channel
- By Country
- Market Attractiveness Analysis
- By Country
- By Component Type
- By Vehicle Type
- By Propulsion
- By Sales Channel
- Key Takeaways
- East Asia Market Analysis and Forecast, By Country
- Historical Market Size Value (USD Billion) Trend Analysis By Market Taxonomy, 2021 to 2025
- Market Size Value (USD Billion) Forecast By Market Taxonomy, 2026 to 2036
- By Country
- China
- Japan
- South Korea
- By Component Type
- By Vehicle Type
- By Propulsion
- By Sales Channel
- By Country
- Market Attractiveness Analysis
- By Country
- By Component Type
- By Vehicle Type
- By Propulsion
- By Sales Channel
- Key Takeaways
- South Asia and Pacific Market Analysis and Forecast, By Country
- Historical Market Size Value (USD Billion) Trend Analysis By Market Taxonomy, 2021 to 2025
- Market Size Value (USD Billion) Forecast By Market Taxonomy, 2026 to 2036
- By Country
- India
- ASEAN
- Australia & New Zealand
- Rest of South Asia and Pacific
- By Component Type
- By Vehicle Type
- By Propulsion
- By Sales Channel
- By Country
- Market Attractiveness Analysis
- By Country
- By Component Type
- By Vehicle Type
- By Propulsion
- By Sales Channel
- Key Takeaways
- Middle East & Africa Market Analysis and Forecast, By Country
- Historical Market Size Value (USD Billion) Trend Analysis By Market Taxonomy, 2021 to 2025
- Market Size Value (USD Billion) Forecast By Market Taxonomy, 2026 to 2036
- By Country
- Kingdom of Saudi Arabia
- Other GCC Countries
- Türkiye
- South Africa
- Other African Union
- Rest of Middle East & Africa
- By Component Type
- By Vehicle Type
- By Propulsion
- By Sales Channel
- By Country
- Market Attractiveness Analysis
- By Country
- By Component Type
- By Vehicle Type
- By Propulsion
- By Sales Channel
- Key Takeaways
- Key Countries Market Analysis
- USA
- Pricing Analysis
- Market Share Analysis, 2025
- By Component Type
- By Vehicle Type
- By Propulsion
- By Sales Channel
- Canada
- Pricing Analysis
- Market Share Analysis, 2025
- By Component Type
- By Vehicle Type
- By Propulsion
- By Sales Channel
- Mexico
- Pricing Analysis
- Market Share Analysis, 2025
- By Component Type
- By Vehicle Type
- By Propulsion
- By Sales Channel
- Brazil
- Pricing Analysis
- Market Share Analysis, 2025
- By Component Type
- By Vehicle Type
- By Propulsion
- By Sales Channel
- Chile
- Pricing Analysis
- Market Share Analysis, 2025
- By Component Type
- By Vehicle Type
- By Propulsion
- By Sales Channel
- Germany
- Pricing Analysis
- Market Share Analysis, 2025
- By Component Type
- By Vehicle Type
- By Propulsion
- By Sales Channel
- UK
- Pricing Analysis
- Market Share Analysis, 2025
- By Component Type
- By Vehicle Type
- By Propulsion
- By Sales Channel
- Italy
- Pricing Analysis
- Market Share Analysis, 2025
- By Component Type
- By Vehicle Type
- By Propulsion
- By Sales Channel
- Spain
- Pricing Analysis
- Market Share Analysis, 2025
- By Component Type
- By Vehicle Type
- By Propulsion
- By Sales Channel
- France
- Pricing Analysis
- Market Share Analysis, 2025
- By Component Type
- By Vehicle Type
- By Propulsion
- By Sales Channel
- India
- Pricing Analysis
- Market Share Analysis, 2025
- By Component Type
- By Vehicle Type
- By Propulsion
- By Sales Channel
- ASEAN
- Pricing Analysis
- Market Share Analysis, 2025
- By Component Type
- By Vehicle Type
- By Propulsion
- By Sales Channel
- Australia & New Zealand
- Pricing Analysis
- Market Share Analysis, 2025
- By Component Type
- By Vehicle Type
- By Propulsion
- By Sales Channel
- China
- Pricing Analysis
- Market Share Analysis, 2025
- By Component Type
- By Vehicle Type
- By Propulsion
- By Sales Channel
- Japan
- Pricing Analysis
- Market Share Analysis, 2025
- By Component Type
- By Vehicle Type
- By Propulsion
- By Sales Channel
- South Korea
- Pricing Analysis
- Market Share Analysis, 2025
- By Component Type
- By Vehicle Type
- By Propulsion
- By Sales Channel
- Russia
- Pricing Analysis
- Market Share Analysis, 2025
- By Component Type
- By Vehicle Type
- By Propulsion
- By Sales Channel
- Poland
- Pricing Analysis
- Market Share Analysis, 2025
- By Component Type
- By Vehicle Type
- By Propulsion
- By Sales Channel
- Hungary
- Pricing Analysis
- Market Share Analysis, 2025
- By Component Type
- By Vehicle Type
- By Propulsion
- By Sales Channel
- Kingdom of Saudi Arabia
- Pricing Analysis
- Market Share Analysis, 2025
- By Component Type
- By Vehicle Type
- By Propulsion
- By Sales Channel
- Türkiye
- Pricing Analysis
- Market Share Analysis, 2025
- By Component Type
- By Vehicle Type
- By Propulsion
- By Sales Channel
- South Africa
- Pricing Analysis
- Market Share Analysis, 2025
- By Component Type
- By Vehicle Type
- By Propulsion
- By Sales Channel
- USA
- Market Structure Analysis
- Competition Dashboard
- Competition Benchmarking
- Market Share Analysis of Top Players
- By Regional
- By Component Type
- By Vehicle Type
- By Propulsion
- By Sales Channel
- Emerging Startups
- Innovation Benchmarking
- Competition Analysis
- Competition Deep Dive
- Amphenol
- Overview
- Product Portfolio
- Profitability by Market Segments
- Sales Footprint
- Strategy Overview
- Marketing Strategy
- Product Strategy
- Channel Strategy
- TE Connectivity
- Phoenix Contact
- Huber+Suhner
- Staubli
- ABB
- Siemens
- Eaton
- Amphenol
- Case Studies
- Success Stories
- Recent Developments
- Competition Deep Dive
- Assumptions & Acronyms Used


