

- Market Size (2026)
- 185.0 Mn
- Forecast (2036)
- USD 928.0 Mn
- CAGR (2026 to 2036)
- 17.5%
How big is the Methane-Reducing Feed Additive Market in 2026?
USD 185.0 million in 2026 and USD 928.0 million by 2036 at a 17.5% CAGR.
The methane-reducing feed additive market was valued at USD 157.4 million in 2025. It is projected to grow from USD 185.0 million in 2026 to USD 928.0 million by 2036 at 17.5% CAGR. Enteric methane pressure is turning cattle feed additives into a verified mitigation category for dairy farms and beef feedlots. UNEP reported in July 2024 that methane carries about 80 times the warming power of carbon dioxide during its first 20 years, which pushes food companies to test feed-based routes before farm emission claims reach audited channels. Feed mills using methane reduction additives are asking for dose records and species fit before repeat supply.
Dairy cooperatives and feed mills are expected to purchase these inputs after nutrition teams connect methane reduction to normal ration work. The decision is driven by farm-level measurement needs and retail pressure for lower-emission milk or beef programs. Technical staff then compare dry carrier behavior and rumen compatibility against familiar additive workflows. Residue documentation remains part of the same review before routine use.
Ration design to farm reporting is becoming the value chain that decides repeat purchasing for methane-reducing additives. Established dairy regions are projected to place greater weight on regulator-reviewed ingredients and carbon accounting files. High-growth livestock markets are likely to focus on channel access and feed conversion evidence before wider commercial use. Nutrition and sourcing teams comparing cattle feed outlook must judge whether a vendor supports dosing and documentation.
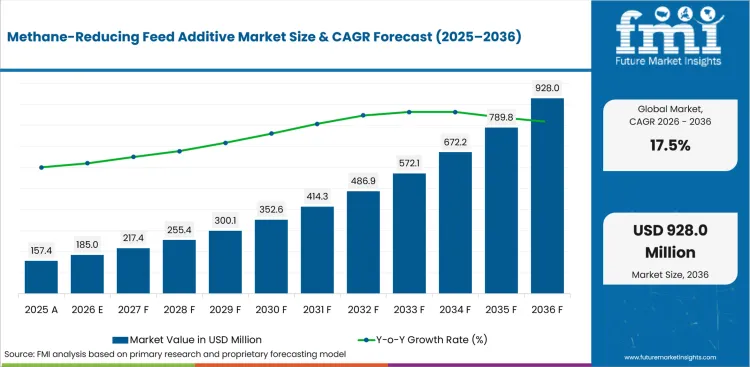
Summary of the Methane-Reducing Feed Additive Market
| Market Signal | Commercial Impact |
|---|---|
| Demand and Growth Drivers | Spending is expected to be driven by verified methane reduction and low-friction mill handling. Documentation urgency is rising due to dairy and beef accounts needing proof before emissions claims enter customer-facing programs.
|
| Product and Segment View | Dry form and synthetic source are expected to lead their parent categories in 2026. Ruminants are expected to lead livestock demand during the same year.
|
| Geography and Growth Outlook | India and China are expected to form the high-growth tier due to dairy scale and feed-channel expansion. The United States and Europe are projected to grow under stricter documentation and retailer assurance screens.
|
| Competitive Landscape | Competition is moderately concentrated around proven chemistry and seaweed supply. Procurement screens center on efficacy records and regulatory status. Delivery format and feed-channel execution shape the remaining review.
|
| Analyst Perspective | Market uptake is increasingly defined by additives that deliver verifiable emission mitigation while preserving productivity outcomes at the herd level. Continued use beyond initial rollout is expected to be shaped by the strength of post‑deployment, on‑farm technical engagement.
|
How is the Methane-Reducing Feed Additive Market segmented?
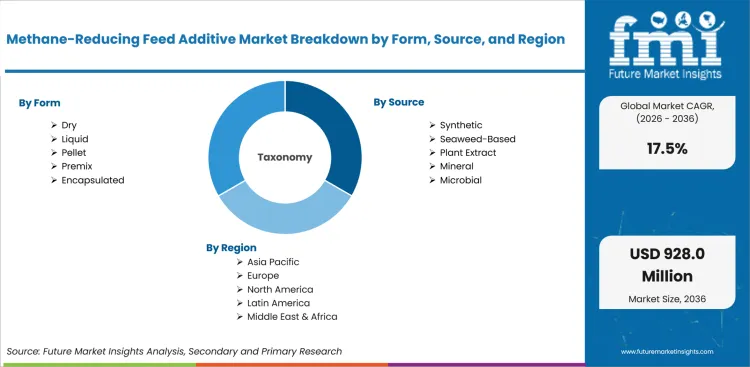
The methane-reducing feed additive industry is segmented by form, source, livestock, function, sales model, and region.
The methane-reducing feed additive market is segmented by form, source, livestock, function, sales model, and region. By form, the market covers dry, liquid, pellet, premix, and encapsulated. By source, it covers synthetic, seaweed-based, plant extract, mineral, and microbial inputs. By livestock, it covers ruminants, dairy cattle, beef cattle, sheep and goats, and mixed herds. By function, it covers enteric methane inhibition, rumen fermentation control, feed conversion support, emissions measurement support, and manure methane mitigation. By sales model, it covers direct feed mill supply, premix distributor, veterinary channel, cooperative program, and carbon-linked program. Regional coverage includes North America, Europe, East Asia, South Asia and Pacific, Latin America, and Middle East and Africa, aligned with adjacent compound feed forecast demand.
How does dry form shape demand within the form category?
Feed mills value form choice only after the additive proves safe storage and repeatable dosing under normal ration work. Dry formats fit premix lines and mineral-feed delivery routes that already serve dairy and beef herds. Cargill describes SilvAir as incorporated into compound feed, pointing to format discipline during feed-mill use. Nutrition teams need that handling fit before farm staff accept a new methane-control step.
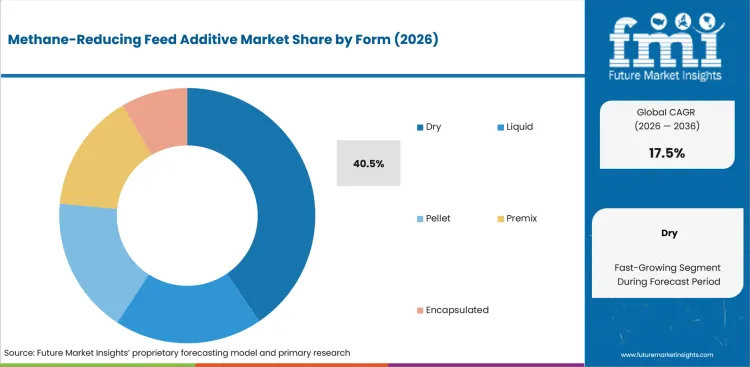
- Based on form, dry is projected to account for 40.5% share in 2026 due to blending control and easier inventory handling. Cargill states SilvAir reduces enteric methane by up to 20% across typical diets, which supports mill-led dosing rather than separate farm labor.
- Dry format adoption is gaining momentum in premix programs supported by fewer handling changes for dairy farms and beef feedlots. Feed mills reviewing feed premix category also value formats that move into standard bags and bins. Mineral blends are expected to extend the same dosing route.
What supports synthetic source demand in methane-control programs?
Source selection is expected to carry more scrutiny in methane-reducing feed additives than in routine nutrition products. Synthetic 3-NOP has a clearer regulatory file than many early-stage natural inputs. dsm-firmenich said in May 2024 that FDA completed its multi-year review of Bovaer for lactating dairy cattle. That review gives nutrition teams a reference point for safety and efficacy files.
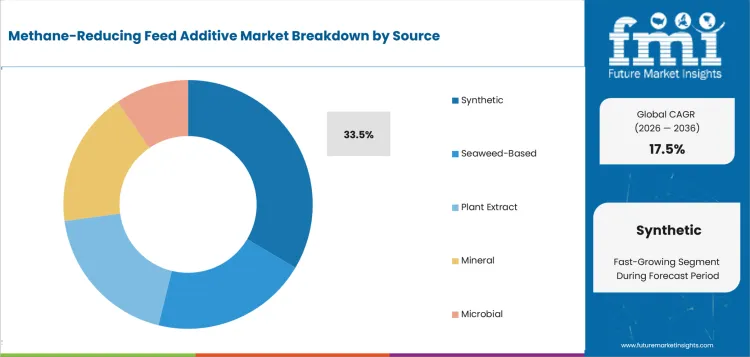
- By source, synthetic inputs are estimated to hold 33.5% share in 2026 owing to the regulatory progress around 3-NOP. dsm-firmenich reported that Bovaer met FDA safety and efficacy requirements in May 2024, which supports sourcing confidence in audited dairy accounts.
- Demand for synthetic inhibitors is expected to grow among dairy cooperatives attributable to clearer dose files and customer-facing carbon programs. These accounts also compare methane-control inputs against adjacent animal feed additives before approved herd deployment. These accounts prefer ingredients that arrive with trial history and label instructions. A defined regulatory pathway is expected to reduce approval friction.
How do ruminants influence livestock segmentation?
Livestock segmentation is tied to the biological origin of enteric methane rather than a broad animal nutrition trend. Ruminants produce methane during rumen fermentation. The pathway places cattle and sheep at the center of additive trials. Goat herds also enter programs in mixed ruminant systems. FAO identifies livestock methane mitigation as a specific climate action area for ruminant systems.
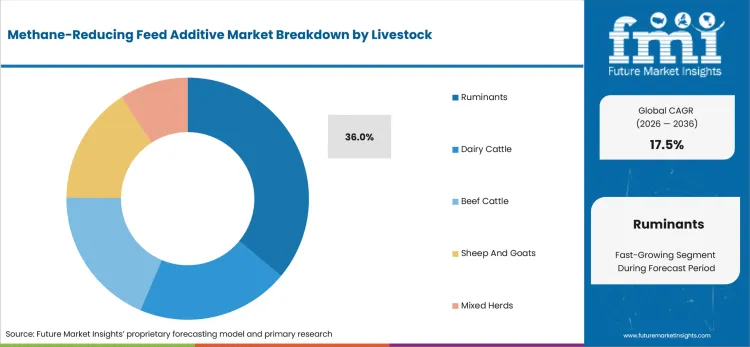
- In 2026, ruminants are expected to lead livestock demand with 36.0% share supported by the rumen pathway targeted by methane inhibitors. FAO’s enteric methane program calls for livestock methane reductions of 30% by 2030, which gives ruminant programs a policy-facing rationale.
- Ruminant producers are increasingly purchasing methane-control additives led by pressure from dairy processors and beef customers. Adjacent cattle supply planning reinforces the need for herd-level inputs that fit feeding routines and documentation reviews.
What makes enteric methane inhibition central to function choices?
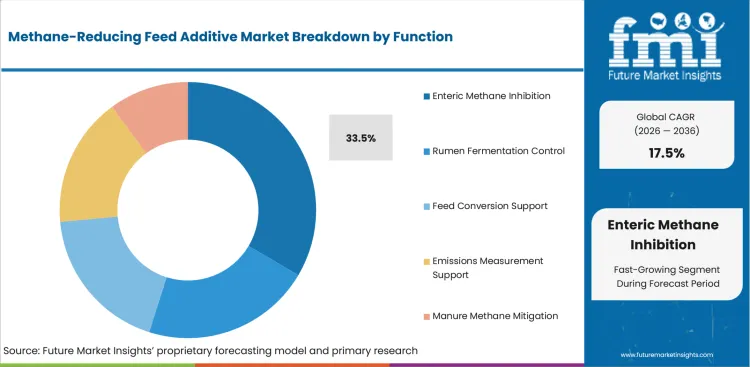
Function choices are expected to separate true methane-control inputs from ordinary performance additives. Enteric methane inhibition gives feed mills a measurable claim tied to rumen biochemistry rather than broad wellness language. CH4 Global announced in January 2025 that Methane Tamer uses asparagopsis to target enteric methane in cattle.
- By function, enteric methane inhibition is forecast to represent 33.5% share in 2026 driven by direct relevance to dairy and beef emission reporting. CH4 Global cited up to 90% methane reduction for Methane Tamer in 2025, which creates a benchmark for proof-led product review.
- Purchase activity for enteric methane inhibition is anticipated to rise driven by livestock carbon programs and retailer assurance demands. Feed mills then seek products that connect methane-control claims to ration stability and farm records.
How is direct feed mill supply positioned within sales models?
Sales model selection changes the adoption burden for every methane-reducing additive. Feed mills and premix distributors control mixing steps and dose consistency before a farm trial becomes routine use. Technical support then determines whether dosing remains stable. CH4 Global and Mitsubishi said in January 2025 that their partnership would examine product forms and production routes across Asia-Pacific. Channel design is part of product qualification.
- Direct feed mill supply is likely to capture 37.0% share in 2026 attributable to dosing accountability and batch record control. CH4 Global and Mitsubishi began workstreams covering feed formulation and production feasibility in 2025, which shows channel design becoming a scale requirement.
- Feed mills are expected to favor direct supply over fragmented resale due to formulation ownership and technical accountability. Programs connected to algae-based feed inputs need reliable ingredient forms before farmers accept wider herd use.
What are the drivers, restraints, and opportunities in the Methane-Reducing Feed Additive Market?
Near-term purchases are being shaped by verified methane reduction and farm implementation friction. Feed-channel expansion is outlined below.
- Driver: Dairy processors and beef programs are expected to push purchases toward additives that provide verified enteric methane reduction.
- Restraint: Adoption is likely to slow in accounts that lack farm performance records and clear dosing accountability.
- Opportunity: Feed-mill service packages are projected to create access routes for farms that need lower-emission ration programs.
Dairy processors are expected to expand additive screening after Bovaer entered the United States route for lactating dairy cattle. dsm-firmenich reported in May 2024 that FDA completed its review of the ingredient for safety and efficacy. The review is expected to raise the documentation baseline for nutrition teams that link lower-emission milk programs to farm ration records.
Safety review pressure is likely to slow rollouts in Europe during the next qualification cycle. EFSA opened a 2026 call for data on 3-NOP use in ruminants after Danish authorities reported concerns from about 400 farms. The request is expected to keep farm health records and raw performance data central during vendor approval.
Channel design is projected to turn the restraint into a service opportunity for vendors that support dosing and farm communication. CH4 Global and Mitsubishi started a 2025 Asia-Pacific partnership covering feed formulation and production pathways. The route is expected to support alternative protein feed discussions that connect ingredient scale to lower-emission cattle programs.
Which country CAGRs are profiled in the Methane-Reducing Feed Additive Market?
.webp "Top Country Growth Comparison Methane Reducing Feed Additive Market Cagr (2026 2036)")
| Country | CAGR |
|---|---|
| United States | 10.5% |
| China | 13.1% |
| India | 15.8% |
| Germany | 8.9% |
| United Kingdom | 9.6% |
| Japan | 7.5% |
| South Korea | 10.1% |
Source: FMI's proprietary forecasting model and primary research
How do country-level CAGRs compare in the Methane-Reducing Feed Additive Market?
India is projected to grow at 15.8% through 2036 and China is forecast to expand at 13.1%. The United States is anticipated to advance at 10.5% and South Korea is estimated at 10.1%. The United Kingdom is estimated at 9.6% and Germany is forecast at 8.9%. Japan is projected to record 7.5% under slower validation cycles. The variation reflects different combinations of dairy herd scale and additive registration clarity. Feed-mill service depth also shapes retailer pressure for lower-emission milk or beef records.
- United States demand is projected to grow at 10.5% CAGR driven by dairy carbon programs and FDA-reviewed 3-NOP access. USDA NASS reported cattle and calves at 86.2 million head in January 2026. The herd base gives feed mills enough commercial scale to test additives inside large dairy and beef accounts. Program friction remains tied to milk-handler acceptance and carbon payment clarity. Elanco and dsm-firmenich are positioned to gain traction where dairies require reviewed safety files and farm-level use instructions.
- China's methane-reducing feed additive outlook is anticipated to advance at 13.1% CAGR over the assessment period supported by meat output scale and dairy modernization. The National Bureau of Statistics of China reported beef output of 8.01 million tons in 2025. The production base increases the value of feed additives that reduce methane without disturbing weight-gain targets. Local adoption is likely to depend on demonstration farms and premix-company training. Cargill and CH4 Global are expected to draw attention in accounts that require China-specific feeding trials.
- Methane-reducing additive demand in India is forecast to rise at 15.8% CAGR over the forecast period owing to dairy expansion and cooperative feed access. Press Information Bureau reported milk production of 247.87 million tonnes during 2024-25. The output scale gives dairies a broad base for lower-emission ration pilots tied to milk collection networks. Farm fragmentation is likely to slow direct use unless cooperatives package the dosing route. Vendors with cooperative training and mineral-feed formats are expected to receive stronger consideration.
- Adoption of methane-reducing additives in Germany is estimated to expand at 8.9% CAGR through 2036 shaped by tighter livestock documentation and dairy herd concentration. Destatis showed dairy cows at 3.58 million in May 2025. The herd size gives ingredient vendors a defined commercial base for regulator-aligned dairy programs. EFSA scrutiny is likely to make farm health monitoring and additive traceability central to sourcing. Suppliers with documented European safety files are expected to receive stronger consideration in audited dairy accounts.
- The United Kingdom sector is projected to record 9.6% CAGR during the assessment period supported by retailer assurance pressure and stable dairy herd needs. Defra reported cattle and calves at 9.3 million animals in June 2025. The herd base gives feed mills a clear target for lower-emission milk and beef programs. Public scrutiny around Bovaer is expected to raise communication demands during sourcing. Feed channels that provide transparent safety explanations are expected to draw attention from dairies serving grocery contracts.
- In Japan, methane-reducing additive demand is predicted to advance at 7.5% CAGR through 2036 influenced by cautious validation cycles and premium beef documentation. USDA FAS cited Japan dairy cattle at approximately 1.3 million head in February 2025. The compact herd structure favors suppliers that prove performance consistency before wider use. Commercial entry is likely to require partner support and localized feed formulation evidence. CH4 Global and Mitsubishi are positioned to gain traction where validation work supports Japanese cattle programs.
- South Korea is estimated to post 10.1% CAGR over the forecast period led by concentrated cattle systems and retail food-chain quality expectations. The Ministry of Data and Statistics recorded Korean native and beef cattle at 3.422 million in the third quarter of 2025. The herd profile supports methane-additive pilots that link feed records to branded beef programs. Adoption barriers are expected to center on cost recovery and proof of productivity neutrality. Vendors with distributor training are expected to receive consideration in premium cattle accounts.
Who are the notable companies in the Methane-Reducing Feed Additive Market?
dsm-firmenich, Elanco Animal Health, CH4 Global, FutureFeed, Rumin8, Agolin SA, Mootral, and Cargill are the notable companies shaping this market.
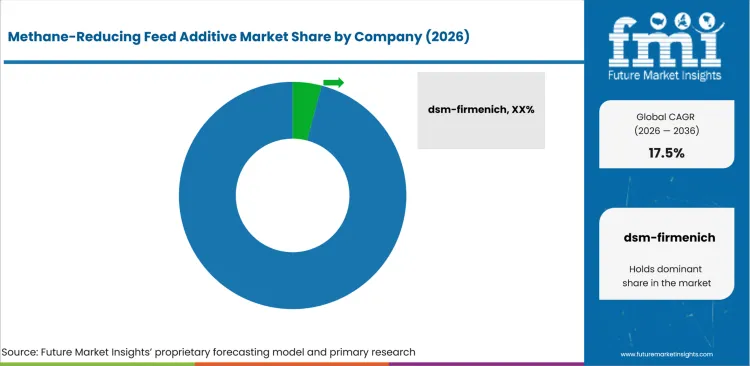
The competitive base is moderately concentrated in reviewed 3-NOP chemistry and fragmented across seaweed routes. Essential-oil and nitrate-based routes create additional specialist lanes. Established multinational players hold registration resources and feed-channel access. Service teams then support dairy processors during farm rollout. Smaller specialists compete in narrow pathways such as asparagopsis supply and grazing formats. Carbon-linked pilots create a separate route for early accounts. Competition centers on validated efficacy and safety files. Practical delivery into rations remains the operating test. Related mineral feed demand illustrates why mineral and premix channels remain central for farm-level execution.
- Regulatory access defines one competitive role for companies such as dsm-firmenich and Elanco Animal Health. Their Bovaer route serves dairy processors and feed mills that need reviewed safety files before herd-scale use. The commercial advantage is clearest in accounts that connect methane reduction to milk supply contracts and carbon accounting records.
- Seaweed supply and product-form control define the position of CH4 Global and FutureFeed. These companies compete around asparagopsis access and shelf stability. Cattle-trial evidence shapes account conversion. Beef feedlots and Asia-Pacific partners are expected to value products that translate high reduction claims into feedlot routines and documented delivery steps.
- Rumin8 is developing formats beyond standard feed inclusion, including water and sustained-release routes. Mootral competes around plant-derived bioactives for farms that need natural positioning and practical field use outside fully mixed rations.
- Feed-service reach separates Cargill and Agolin SA from narrower technology developers. Cargill uses SilvAir and ration expertise to serve compound feed accounts. Agolin SA uses essential-oil positioning and Alltech channel access to support dairy farms that require productivity evidence alongside methane-intensity reduction.
Competitive Benchmarking: Methane-Reducing Feed Additive Market
| Company | Methane Route | Regulatory or Evidence Fit | Feed Channel Fit | Service Reach |
|---|---|---|---|---|
| dsm-firmenich | 3-NOP | High | Strong | Global |
| Elanco Animal Health | 3-NOP distribution | High | Strong | Regional |
| CH4 Global | Asparagopsis | Strong | Medium | Regional |
| FutureFeed | Asparagopsis IP | Strong | Medium | Global |
| Rumin8 | Synthetic bromoform route | Medium | Medium | Regional |
| Agolin SA | Essential-oil route | Medium | Strong | Global |
| Mootral | Plant bioactives | Medium | Medium | Regional |
| Cargill | Nitrate route | Strong | High | Global |
Source: Future Market Insights competitive analysis, 2026. Ratings reflect relative portfolio relevance and workflow fit. Service capability and geographic reach shape the remaining comparison.
Key Developments in the Methane-Reducing Feed Additive Market
- In January 2024, CH4 Global made its first commercial delivery of Methane Tamer to a cattle customer. The delivery moved the asparagopsis supplement from validation into a revenue-generating feed route. The milestone is expected to sharpen purchaser interest in supply reliability and product form stability.
- In December 2025, Rumin8 announced the acquisition of ROAM Agricultural to expand its methane abatement product range. The transaction added cattle-focused formats including granules and drinking-water additives. Mineral mixes and boluses expanded the route for grazing systems. The development signals a shift toward delivery routes for grazing herds and mixed feeding systems.
- In April 2024, Cargill highlighted China methane reduction work through its technology application center and China Agricultural University. The program used GreenFeed equipment to validate SilvAir in dairy cow studies.
Key Players in the Methane-Reducing Feed Additive Market
3-NOP and Regulatory Access Companies
- dsm-firmenich
- Elanco Animal Health
Seaweed and Asparagopsis Platform Companies
- CH4 Global
- FutureFeed
Grazing and Multi-Format Developers
- Rumin8
- Mootral
Feed-Service and Plant-Extract Companies
- Cargill
- Agolin SA
Methane-Reducing Feed Additive Market - Report Scope
| Coverage field | Report scope |
|---|---|
| Market breakdown | Methane-Reducing Feed Additive Market Breakdown By Form, Source, Livestock, Function, Sales Model, and Region |
| Market Definition | Methane-reducing feed additives are ration inputs used by feed mills and dairy farms to lower enteric methane output from ruminant livestock. |
| Regions Covered | North America and Latin America. Europe, East Asia, South Asia and Pacific. Middle East and Africa. |
| Countries Covered | United States, China, India, Germany, United Kingdom, Japan, South Korea, and 30+ countries |
| Key Companies Profiled | dsm-firmenich, Elanco Animal Health, CH4 Global, FutureFeed, Rumin8, Agolin SA, Mootral, and Cargill |
| Forecast Period | 2026 to 2036 |
| Approach | Hybrid bottom-up and top-down methodology using additive route and ruminant herd exposure. Feed-mill access, regulatory status, farm-trial evidence, and country-level dairy or beef indicators refine the model. |
Source: Future Market Insights - analysis driven by proprietary forecasting models and primary research
Methane-Reducing Feed Additive Market - Research Methodology
| Method | Approach |
| Primary Research | FMI analysts gathered input from manufacturers, service providers, technology developers, distributors, end users, sourcing teams, and subject-matter experts. Interviews examined purchasing decisions, product or service evaluation, adoption barriers, approval requirements, pricing considerations, and expectations for technical or commercial support. Respondents were also asked what evidence is required before a trial, pilot, or initial order develops into regular purchasing. |
| Desk Research | Desk research covered government statistics, regulatory publications, trade data, industry associations, technical literature, standards, company filings, product information, and official corporate announcements. Sources were reviewed for relevance, publication date, geographic coverage, and consistency with the defined market scope. Claims relating to performance, applications, approvals, capacity, investment, and commercial activity were retained only when supported by credible public evidence. |
| Market Sizing and Forecasting | The market model combined the baseline value with historical performance, segment structure, pricing and volume indicators, adoption levels, company participation, and country-level demand conditions. Forecast assumptions considered economic activity, investment trends, regulatory developments, technology adoption, purchasing cycles, supply availability, and barriers to wider market use. Segment and regional estimates were reconciled before the final market total was calculated. |
| Data Validation | Estimates were checked against multiple independent indicators, including public data, company activity, trade patterns, industry developments, and findings from primary interviews. Validation also tested whether products, services, applications, and company revenues fell within the defined market boundaries. Adjacent categories, unsupported claims, overlapping revenues, and activities without direct market relevance were excluded to reduce double counting and maintain consistency across segments and countries. |
Methane-Reducing Feed Additive Market by Segments
Methane-Reducing Feed Additive Market segmented by Form:
- Dry
- Liquid
- Pellet
- Premix
- Encapsulated
Methane-Reducing Feed Additive Market segmented by Source:
- Synthetic
- Seaweed-Based
- Plant Extract
- Mineral
- Microbial
Methane-Reducing Feed Additive Market segmented by Livestock:
- Ruminants
- Dairy Cattle
- Beef Cattle
- Sheep And Goats
- Mixed Herds
Methane-Reducing Feed Additive Market segmented by Function:
- Enteric Methane Inhibition
- Rumen Fermentation Control
- Feed Conversion Support
- Emissions Measurement Support
- Manure Methane Mitigation
Methane-Reducing Feed Additive Market segmented by Sales Model:
- Direct Feed Mill Supply
- Premix Distributor
- Veterinary Channel
- Cooperative Program
- Carbon-Linked Program
Methane-Reducing Feed Additive Market by Region:
- North America
- United States
- Canada
- Latin America
- Brazil
- Mexico
- Chile
- Rest of Latin America
- Western Europe
- Germany
- United Kingdom
- Italy
- Spain
- France
- Nordic
- BENELUX
- Rest of Western Europe
- Eastern Europe
- Poland
- Hungary
- Balkan and Baltic
- Rest of Eastern Europe
- East Asia
- China
- Japan
- South Korea
- South Asia and Pacific
- India
- ASEAN
- Australia and New Zealand
- Rest of South Asia and Pacific
- Middle East and Africa
- Kingdom of Saudi Arabia
- Other GCC Countries
- Turkiye
- South Africa
- Other African Union
- Rest of Middle East and Africa
Research Sources and Bibliography
- United Nations Environment Programme. (2024, July). Facts about Methane. United Nations Environment Programme.
- USA Department of Agriculture, National Agricultural Statistics Service. (2026, January). United States cattle inventory down slightly. USA Department of Agriculture.
- National Bureau of Statistics of China. (2026, February). STATISTICAL COMMUNIQUÉ OF THE PEOPLE'S REPUBLIC OF CHINA ON THE 2025 NATIONAL ECONOMIC AND SOCIAL DEVELOPMENT. National Bureau of Statistics of China.
- Press Information Bureau, Government of India. (2025, November). Release of Basic Animal Husbandry Statistics 2025 on the Occasion of National Milk Day 2025. Ministry of Fisheries, Animal Husbandry & Dairying.
- Federal Statistical Office of Germany. (2025, July). Holdings with cattle and stock of cattle. Statistisches Bundesamt.
- Department for Environment, Food & Rural Affairs. (2025, December). Livestock populations in the United Kingdom at 1 June 2025. GOV.UK.
- USA Department of Agriculture, Foreign Agricultural Service. (2025, December). Dairy and Products Annual. USA Department of Agriculture.
- Ministry of Data and Statistics, Republic of Korea. (2025, October). Livestock Statistics in the Third Quarter of 2025. Ministry of Data and Statistics.
- European Food Safety Authority. (2026, February). Call for data on the use of 3-nitrooxypropanol in ruminants. European Food Safety Authority.
- dsm-firmenich. (2024, May). Methane-reducing feed ingredient Bovaer® ready for US market launch. dsm-firmenich.
- Food Standards Agency. (2024, December). Bovaer cow feed additive explained. Food Standards Agency.
- CH4 Global. (2024, January). CH4 Global Makes First Commercial Delivery of Its Methane-Reducing Cattle Feed Supplement. CH4 Global.
- CH4 Global. (2025, January). CH4 Global and Mitsubishi Corporation Partner to Accelerate Adoption of Methane-Reducing Cattle Feed Supplement in Asia-Pacific Markets. CH4 Global.
- Rumin8. (2024, June). Rumin8 hits 80% methane yield reduction in products suitable for grazing cattle. Rumin8.
- Rumin8. (2025, December). Rumin8 acquires ROAM to expand product range. Rumin8.
- Cargill. (2024, February). Leading Methane Emission Reduction Innovation in China. Cargill.
- Cargill. (2026, June). Reduce Cattle Methane Emissions. Cargill.
This bibliography is provided for reader reference and uses primary government and standards-body sources. Official trade body and company sources support product developments.
This Report Answers
- What value is the methane-reducing feed additive market estimated to reach in 2026 and 2036?
- What CAGR is forecast for the methane-reducing feed additive market from 2026 to 2036?
- Which segments shape demand across form and source categories alongside livestock function and sales model?
- Which operating pressures support additive adoption across dairy farms and beef feedlots?
- How do country CAGRs differ across the profiled methane-reducing feed additive market countries?
- Which companies compete across chemistry and seaweed supply alongside service reach and channel access?
- How does FMI validate forecasts and avoid duplicate external statistics in the article?
- What factors should feed mills and cattle integrators address before broader sourcing commitment?
- How do claims review and safety files interact with regulatory activity during vendor selection?
Frequently Asked Questions
Why should executives track the Methane Reducing Feed Additive Market?
Executives should monitor this market because feed additive choice directly influences verified livestock emission claims and downstream processor contracts. Supplier risk, documentation quality, and traceability increasingly affect commercial exposure.
What business problem does the Methane Reducing Feed Additive Market address?
The market responds to the need to lower enteric methane emissions without altering ration structure or compromising herd performance data. It enables producers to meet environmental benchmarks while protecting productivity metrics.
What should procurement leaders evaluate before selecting vendors?
Procurement leaders should prioritize regulatory approval status and validated dosage evidence before advancing vendors to commercial trials. Feed mill handling characteristics and on farm technical support should then be benchmarked against proven herd outcomes.
What limits return on investment for feed mills and farms?
Return on investment is constrained by inconsistent dose compliance and uncertainty around carbon credit monetization. Weak documentation of productivity neutrality can further delay repeat purchasing decisions.
How do vendors build long term account confidence?
Vendors build confidence by supplying transparent trial protocols along with residue, safety, and authorization files. Ongoing formulation support and proof of productivity neutrality improve customer retention.
Which segment position deserves close review?
Synthetic methane reduction additives warrant close scrutiny due to stronger regulatory clarity, particularly for 3 NOP based solutions. Many natural alternatives remain earlier stage with limited authorization depth.
Preview the report firsthand - request a free sample
Get SampleGet the brochure for pricing and purchase details.
Get PDFTable of Content
- Key Takeaways
- Market Size and CAGR
- Top Growth Driver
- Fastest Growing Segment
- Leading Region
- Key Companies
- Emerging Opportunities
- Executive Summary
- Global Market Outlook
- Demand-side Trends
- Supply-side Trends
- Technology Roadmap Analysis
- Analysis and Recommendations
- Analyst Perspective (What is happening? Why now? What should investors know?)
- Key Questions Answered
- How large is the market?
- What is the CAGR?
- What are key trends?
- Which region dominates?
- Who are the leaders?
- Market Overview
- Market Coverage / Taxonomy
- Market Definition / Scope / Limitations
- Research Methodology
- Chapter Orientation
- Analytical Lens and Working Hypotheses
- Market Structure, Signals, and Trend Drivers
- Benchmarking and Cross-market Comparability
- Market Sizing, Forecasting, and Opportunity Mapping
- Research Design and Evidence Framework
- Desk Research Programme (Secondary Evidence)
- Expert Input and Fieldwork (Primary Evidence)
- Tooling, Models, and Reference Databases
- Data Engineering and Model Build
- Quality Assurance and Audit Trail
- Market Background
- Market Dynamics (Drivers, Restraints, Opportunity, Trends)
- Scenario Forecast (Optimistic, Likely, Conservative)
- Impact Analysis
- AI Impact
- Sustainability Impact
- Regulatory Impact
- Technology Impact
- Consumer / Buyer Analysis
- Purchase Drivers
- Adoption Barriers
- Buyer Journey
- Opportunity Map Analysis
- Product Life Cycle Analysis
- Supply Chain Analysis
- Investment Feasibility Matrix
- Value Chain Analysis
- PESTLE and Porter's Analysis
- Regulatory Landscape
- Regional Parent Market Outlook
- Production and Consumption Statistics
- Import and Export Statistics
- Global Market Analysis and Forecast, 2021 to 2036
- Historical Market Size Value (USD Million) & Volume (Unit) Analysis, 2021 to 2025
- Current and Future Market Size Value (USD Million) & Volume (Unit) Projections, 2026 to 2036
- Y-o-Y Growth Trend Analysis
- Absolute $ Opportunity Analysis
- Global Market Pricing Analysis, 2021 to 2036
- Global Market Analysis and Forecast, By Form, 2021 to 2036
- Introduction / Key Findings
- Historical Market Size Value (USD Million) & Volume (Unit) Analysis By Form, 2021 to 2025
- Current and Future Market Size Value (USD Million) & Volume (Unit) Analysis and Forecast By Form, 2026 to 2036
- Dry
- Liquid
- Pellet
- Premix
- Encapsulated
- Dry
- Y-o-Y Growth Trend Analysis By Form, 2021 to 2025
- Absolute $ Opportunity Analysis By Form, 2026 to 2036
- Global Market Analysis and Forecast, By Source, 2021 to 2036
- Introduction / Key Findings
- Historical Market Size Value (USD Million) & Volume (Unit) Analysis By Source, 2021 to 2025
- Current and Future Market Size Value (USD Million) & Volume (Unit) Analysis and Forecast By Source, 2026 to 2036
- Synthetic
- Seaweed-Based
- Plant Extract
- Mineral
- Microbial
- Synthetic
- Y-o-Y Growth Trend Analysis By Source, 2021 to 2025
- Absolute $ Opportunity Analysis By Source, 2026 to 2036
- Global Market Analysis and Forecast, By Livestock, 2021 to 2036
- Introduction / Key Findings
- Historical Market Size Value (USD Million) & Volume (Unit) Analysis By Livestock, 2021 to 2025
- Current and Future Market Size Value (USD Million) & Volume (Unit) Analysis and Forecast By Livestock, 2026 to 2036
- Ruminants
- Dairy Cattle
- Beef Cattle
- Sheep And Goats
- Mixed Herds
- Ruminants
- Y-o-Y Growth Trend Analysis By Livestock, 2021 to 2025
- Absolute $ Opportunity Analysis By Livestock, 2026 to 2036
- Global Market Analysis and Forecast, By Function, 2021 to 2036
- Introduction / Key Findings
- Historical Market Size Value (USD Million) & Volume (Unit) Analysis By Function, 2021 to 2025
- Current and Future Market Size Value (USD Million) & Volume (Unit) Analysis and Forecast By Function, 2026 to 2036
- Enteric Methane Inhibition
- Rumen Fermentation Control
- Feed Conversion Support
- Emissions Measurement Support
- Manure Methane Mitigation
- Enteric Methane Inhibition
- Y-o-Y Growth Trend Analysis By Function, 2021 to 2025
- Absolute $ Opportunity Analysis By Function, 2026 to 2036
- Global Market Analysis and Forecast, By Sales Model, 2021 to 2036
- Introduction / Key Findings
- Historical Market Size Value (USD Million) & Volume (Unit) Analysis By Sales Model, 2021 to 2025
- Current and Future Market Size Value (USD Million) & Volume (Unit) Analysis and Forecast By Sales Model, 2026 to 2036
- Direct Feed Mill Supply
- Premix Distributor
- Veterinary Channel
- Cooperative Program
- Carbon-Linked Program
- Direct Feed Mill Supply
- Y-o-Y Growth Trend Analysis By Sales Model, 2021 to 2025
- Absolute $ Opportunity Analysis By Sales Model, 2026 to 2036
- Global Market Analysis and Forecast, By Region, 2021 to 2036
- Introduction
- Historical Market Size Value (USD Million) & Volume (Unit) Analysis By Region, 2021 to 2025
- Current Market Size Value (USD Million) & Volume (Unit) Analysis and Forecast By Region, 2026 to 2036
- North America
- Latin America
- Western Europe
- Eastern Europe
- East Asia
- South Asia and Pacific
- Middle East & Africa
- Market Attractiveness Analysis By Region
- North America Market Analysis and Forecast, By Country, 2021 to 2036
- Historical Market Size Value (USD Million) & Volume (Unit) Trend Analysis By Market Taxonomy, 2021 to 2025
- Market Size Value (USD Million) & Volume (Unit) Forecast By Market Taxonomy, 2026 to 2036
- By Country
- USA
- Canada
- Mexico
- By Form
- By Source
- By Livestock
- By Function
- By Sales Model
- By Country
- Market Attractiveness Analysis
- By Country
- By Form
- By Source
- By Livestock
- By Function
- By Sales Model
- Key Takeaways
- Latin America Market Analysis and Forecast, By Country
- Historical Market Size Value (USD Million) & Volume (Unit) Trend Analysis By Market Taxonomy, 2021 to 2025
- Market Size Value (USD Million) & Volume (Unit) Forecast By Market Taxonomy, 2026 to 2036
- By Country
- Brazil
- Chile
- Rest of Latin America
- By Form
- By Source
- By Livestock
- By Function
- By Sales Model
- By Country
- Market Attractiveness Analysis
- By Country
- By Form
- By Source
- By Livestock
- By Function
- By Sales Model
- Key Takeaways
- Western Europe Market Analysis and Forecast, By Country
- Historical Market Size Value (USD Million) & Volume (Unit) Trend Analysis By Market Taxonomy, 2021 to 2025
- Market Size Value (USD Million) & Volume (Unit) Forecast By Market Taxonomy, 2026 to 2036
- By Country
- Germany
- UK
- Italy
- Spain
- France
- Nordic
- BENELUX
- Rest of Western Europe
- By Form
- By Source
- By Livestock
- By Function
- By Sales Model
- By Country
- Market Attractiveness Analysis
- By Country
- By Form
- By Source
- By Livestock
- By Function
- By Sales Model
- Key Takeaways
- Eastern Europe Market Analysis and Forecast, By Country
- Historical Market Size Value (USD Million) & Volume (Unit) Trend Analysis By Market Taxonomy, 2021 to 2025
- Market Size Value (USD Million) & Volume (Unit) Forecast By Market Taxonomy, 2026 to 2036
- By Country
- Russia
- Poland
- Hungary
- Balkan & Baltic
- Rest of Eastern Europe
- By Form
- By Source
- By Livestock
- By Function
- By Sales Model
- By Country
- Market Attractiveness Analysis
- By Country
- By Form
- By Source
- By Livestock
- By Function
- By Sales Model
- Key Takeaways
- East Asia Market Analysis and Forecast, By Country
- Historical Market Size Value (USD Million) & Volume (Unit) Trend Analysis By Market Taxonomy, 2021 to 2025
- Market Size Value (USD Million) & Volume (Unit) Forecast By Market Taxonomy, 2026 to 2036
- By Country
- China
- Japan
- South Korea
- By Form
- By Source
- By Livestock
- By Function
- By Sales Model
- By Country
- Market Attractiveness Analysis
- By Country
- By Form
- By Source
- By Livestock
- By Function
- By Sales Model
- Key Takeaways
- South Asia and Pacific Market Analysis and Forecast, By Country
- Historical Market Size Value (USD Million) & Volume (Unit) Trend Analysis By Market Taxonomy, 2021 to 2025
- Market Size Value (USD Million) & Volume (Unit) Forecast By Market Taxonomy, 2026 to 2036
- By Country
- India
- ASEAN
- Australia & New Zealand
- Rest of South Asia and Pacific
- By Form
- By Source
- By Livestock
- By Function
- By Sales Model
- By Country
- Market Attractiveness Analysis
- By Country
- By Form
- By Source
- By Livestock
- By Function
- By Sales Model
- Key Takeaways
- Middle East & Africa Market Analysis and Forecast, By Country
- Historical Market Size Value (USD Million) & Volume (Unit) Trend Analysis By Market Taxonomy, 2021 to 2025
- Market Size Value (USD Million) & Volume (Unit) Forecast By Market Taxonomy, 2026 to 2036
- By Country
- Kingdom of Saudi Arabia
- Other GCC Countries
- Türkiye
- South Africa
- Other African Union
- Rest of Middle East & Africa
- By Form
- By Source
- By Livestock
- By Function
- By Sales Model
- By Country
- Market Attractiveness Analysis
- By Country
- By Form
- By Source
- By Livestock
- By Function
- By Sales Model
- Key Takeaways
- Key Countries Market Analysis
- USA
- Pricing Analysis
- Market Share Analysis, 2025
- By Form
- By Source
- By Livestock
- By Function
- By Sales Model
- Canada
- Pricing Analysis
- Market Share Analysis, 2025
- By Form
- By Source
- By Livestock
- By Function
- By Sales Model
- Mexico
- Pricing Analysis
- Market Share Analysis, 2025
- By Form
- By Source
- By Livestock
- By Function
- By Sales Model
- Brazil
- Pricing Analysis
- Market Share Analysis, 2025
- By Form
- By Source
- By Livestock
- By Function
- By Sales Model
- Chile
- Pricing Analysis
- Market Share Analysis, 2025
- By Form
- By Source
- By Livestock
- By Function
- By Sales Model
- Germany
- Pricing Analysis
- Market Share Analysis, 2025
- By Form
- By Source
- By Livestock
- By Function
- By Sales Model
- UK
- Pricing Analysis
- Market Share Analysis, 2025
- By Form
- By Source
- By Livestock
- By Function
- By Sales Model
- Italy
- Pricing Analysis
- Market Share Analysis, 2025
- By Form
- By Source
- By Livestock
- By Function
- By Sales Model
- Spain
- Pricing Analysis
- Market Share Analysis, 2025
- By Form
- By Source
- By Livestock
- By Function
- By Sales Model
- France
- Pricing Analysis
- Market Share Analysis, 2025
- By Form
- By Source
- By Livestock
- By Function
- By Sales Model
- India
- Pricing Analysis
- Market Share Analysis, 2025
- By Form
- By Source
- By Livestock
- By Function
- By Sales Model
- ASEAN
- Pricing Analysis
- Market Share Analysis, 2025
- By Form
- By Source
- By Livestock
- By Function
- By Sales Model
- Australia & New Zealand
- Pricing Analysis
- Market Share Analysis, 2025
- By Form
- By Source
- By Livestock
- By Function
- By Sales Model
- China
- Pricing Analysis
- Market Share Analysis, 2025
- By Form
- By Source
- By Livestock
- By Function
- By Sales Model
- Japan
- Pricing Analysis
- Market Share Analysis, 2025
- By Form
- By Source
- By Livestock
- By Function
- By Sales Model
- South Korea
- Pricing Analysis
- Market Share Analysis, 2025
- By Form
- By Source
- By Livestock
- By Function
- By Sales Model
- Russia
- Pricing Analysis
- Market Share Analysis, 2025
- By Form
- By Source
- By Livestock
- By Function
- By Sales Model
- Poland
- Pricing Analysis
- Market Share Analysis, 2025
- By Form
- By Source
- By Livestock
- By Function
- By Sales Model
- Hungary
- Pricing Analysis
- Market Share Analysis, 2025
- By Form
- By Source
- By Livestock
- By Function
- By Sales Model
- Kingdom of Saudi Arabia
- Pricing Analysis
- Market Share Analysis, 2025
- By Form
- By Source
- By Livestock
- By Function
- By Sales Model
- Türkiye
- Pricing Analysis
- Market Share Analysis, 2025
- By Form
- By Source
- By Livestock
- By Function
- By Sales Model
- South Africa
- Pricing Analysis
- Market Share Analysis, 2025
- By Form
- By Source
- By Livestock
- By Function
- By Sales Model
- USA
- Market Structure Analysis
- Competition Dashboard
- Competition Benchmarking
- Market Share Analysis of Top Players
- By Regional
- By Form
- By Source
- By Livestock
- By Function
- By Sales Model
- Emerging Startups
- Innovation Benchmarking
- Competition Analysis
- Competition Deep Dive
- dsm-firmenich
- Overview
- Product Portfolio
- Profitability by Market Segments (Product/Region/Sales Channel)
- Sales Footprint
- Strategy Overview
- Marketing Strategy
- Product Strategy
- Channel Strategy
- Elanco Animal Health
- CH 4 Global
- FutureFeed
- Rumin 8
- Agolin SA
- Mootral
- Cargill
- dsm-firmenich
- Case Studies
- Success Stories
- Recent Developments
- Competition Deep Dive
- Assumptions & Acronyms Used


