

- Market Size (2026)
- USD 860.7 Mn
- Forecast (2036)
- USD 1442.6 Mn
- CAGR (2026 to 2036)
- 5.3%
How big is Mineral Leaching Oxidants Market in 2026?
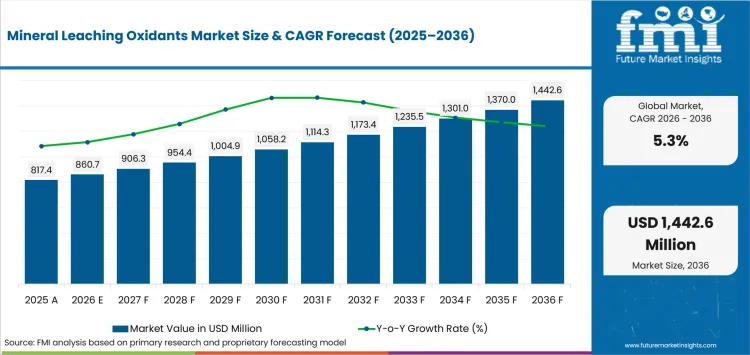
USD 860.7 Million in 2026 and USD 1,442.6 Million by 2036 at a 5.3% CAGR.
The mineral leaching oxidants market is expected to grow from USD 860.7 Million in 2026 to USD 1442.6 Million in 2036, a 5.3% CAGR. The estimate follows a 2025 market value of USD 817.4 Million. Mines purchase oxidants to control reactions within a specific ore-processing circuit. USGS’s February 2026 production review provides context for continued mining activity. A July 2026 review in Minerals also shows why the technical case varies: gold dissolution depends on mineralogy, dissolved oxygen, pH and solution chemistry. Site tests must establish recovery and reagent efficiency before the mine changes its chemical program.
Canadian exploration can create future testwork opportunities, although projects may take years to reach production. Chile has established copper operations and investment in local peroxide supply. Peru’s project portfolio offers another source of future demand, subject to approvals and construction. Japan’s activity is more closely tied to technical partnerships and resource security. In every case, the chosen reagent needs a demonstrated process benefit and a practical delivery arrangement.
Key Takeaways of Mineral Leaching Oxidants Market
- Hydrogen peroxide holds 31.0% of oxidant demand in 2026. It can influence oxidation conditions in suitable leach circuits, with dosage determined by the ore response.
- Gold ores account for 35.0% of ore demand in 2026. Oxygen availability and pre-oxidation requirements can affect recovery and reagent consumption.
- Acid leaching represents 34.0% of system demand in 2026. Controlling oxidation state is part of dissolving metals in several hydrometallurgical processes.
- Mining operations hold 64.0% of end-use demand in 2026. Continuous ore treatment creates recurring reagent purchases at the mine.
- Direct chemical supply accounts for 47.0% of sales in 2026. Large operations need bulk availability, reliable delivery and technical responsibility for the supplied reagent.
- Companies include Solvay, Evonik, Arkema, Nouryon, Kemira, LANXESS.
Analyst Perspective
"An oxidant earns its place through recovery and reagent efficiency in the actual circuit. Ore-specific testing and reliable supply are needed before a mine changes an established chemical program."
- Nikhil Kaitwade, Principal Consultant, Future Market Insights
How is the Mineral Leaching Oxidants Market segmented?
The market is analyzed by Oxidant Type, Ore Type, Leaching System, End Use, and Sales Channel to reflect how mines select chemistry and how suppliers reach operating sites.
By Oxidant Type: Hydrogen peroxide, Sodium hypochlorite, Ferric sulfate, Oxygen/air injection additives, Persulfate oxidants; By Ore Type: Gold ores, Copper ores, Uranium ores, Nickel/cobalt ores, Polymetallic ores; By Leaching System: Acid leaching, Alkaline leaching, Cyanide leaching support, Bioleaching support; By End Use: Mining operations, Hydrometallurgy plants, Pilot plants, Reagent distributors; By Sales Channel: Direct chemical supply, Mining reagent distributors, Technical service contracts, Regional depots.
Why does hydrogen peroxide lead demand within the oxidant type category?
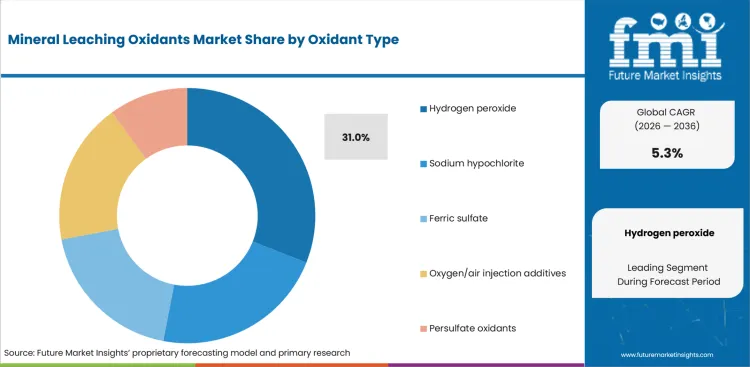
Hydrogen peroxide combines high oxidizing strength with the ability to increase dissolved oxygen in selected leach systems. That makes it useful where air transfer alone does not meet the process requirement. Its role extends beyond gold because peroxide can support redox control in uranium and other metal-processing circuits. The buying decision remains ore-specific since decomposition and competing reactions can alter reagent efficiency. Suppliers therefore compete on concentration options and safe handling. Delivery reliability and technical guidance matter as much as the molecule itself. This combination supports its leading position without making it a universal substitute for oxygen or other oxidants. Delivered hydrogen peroxide quality and handling arrangements affect the practical cost of this oxidant route.
- Hydrogen peroxide holds a 31.0% share of the Oxidant Type category in 2026 because it can supplement oxygen and directly influence oxidation conditions in multiple leach workflows.
- In June 2025, Solvay's Peróxidos do Brasil announced a USD 12 million investment at its Coronel site in Chile, where hydrogen peroxide production serves South American markets including mining.
Why do gold ores lead demand within the ore type category?
Gold ores create a concentrated use case for oxidants because cyanidation requires an oxidant alongside cyanide to sustain gold dissolution. The commercial need becomes stronger in sulfide-bearing feeds where reactive minerals consume oxygen or promote passivation. Operators may use air or oxygen depending on ore behavior. Hydrogen peroxide, ferric chemistry, and supporting oxidation steps are additional options. The July 2026 Minerals review emphasizes that reagent consumption and kinetics are strongly ore-dependent. That makes laboratory testing and plant trials central to procurement. Suppliers win by showing that an oxidant improves recovery or leach rate without creating an offsetting increase in reagent cost. Where oxygen supports the circuit, industrial gases supply becomes part of the leach operating plan.
- Gold ores hold a 35.0% share of the Ore Type category in 2026 because oxidant availability is integral to cyanide-leaching kinetics and pre-oxidation strategies.
- In July 2026, researchers from Curtin University's Western Australian School of Mines published a review showing that sulfide mineralogy can raise oxidant demand and suppress gold dissolution.
Why does acid leaching lead demand within the leaching system category?
Acid leaching places oxidation chemistry close to the core metal-dissolution reaction. Copper and uranium circuits can require redox control to convert minerals or dissolved species into forms that leach more readily. This creates demand for oxidants that work within low-pH process conditions and remain compatible with downstream separation. The commercial decision is not based on oxidizing strength alone. Metallurgists also test acid consumption and reaction selectivity. They assess impurity behavior and downstream solvent-extraction performance. Suppliers with application laboratories can therefore compete on the quality of circuit optimization rather than on delivered chemical price alone. Acid-leach design must account for upstream beneficiation reagents that may affect solution chemistry.
- Acid leaching holds a 34.0% share of the Leaching System category in 2026 because oxidation state can directly affect dissolution in several hydrometallurgical metal circuits.
- Arkema's January 2025 Jarrie-site reorganization retained hydrogen-peroxide production, illustrating how feedstock continuity and plant configuration shape oxidant availability.
Why do mining operations lead demand within the end use category?
Mining operations consume oxidants repeatedly as ore passes through leach circuits, which makes site-level use structurally larger than intermittent pilot demand. Mine metallurgists specify the reagent while procurement teams negotiate supply and storage requirements. Operations also carry the cost of lost recovery when oxidation conditions drift outside the preferred range. This pushes suppliers toward dependable bulk delivery and technical support. The demand profile is especially durable at mines with long operating lives or multiple ore domains because chemistry can be re-qualified as mineralogy changes. Pilot plants remain important for qualification, but their reagent volumes are smaller and less continuous. Mining sites using both concentration and leaching should consider carryover from flotation reagents into later process steps.
- Mining operations hold a 64.0% share of the End Use category in 2026 because continuous ore processing creates recurring reagent consumption and operating accountability at the mine site.
- In July 2026, Australia's Department of Industry reported that gold export earnings were forecast to peak at AUD 73 billion in 2026-27, underscoring the scale of active precious-metals processing.
Why does direct chemical supply lead demand within the sales channel category?
Direct chemical supply is favored when a mine consumes enough oxidant to justify bulk contracting and dedicated logistics. Large users typically need product specifications and storage guidance. Delivery scheduling and emergency-response procedures are also tied to the reagent. A direct relationship also gives the producer better visibility into demand and allows technical teams to support site trials. Distributors remain valuable where volumes are smaller or mines are far from a producer's core network. Technical-service contracts can overlap with direct supply when dosage optimization is part of the commercial arrangement. The leading channel therefore reflects both volume economics and the operational risk of interrupted reagent availability. Procurement may coordinate oxidant contracts with mining flotation chemicals while qualifying each reagent for its own process function.
- Direct chemical supply holds a 47.0% share of the Sales Channel category in 2026 because larger mines favor contracted bulk availability and direct technical accountability.
- In June 2025, Nouryon launched Eka HP Puroxide, a low-carbon hydrogen peroxide product produced in Sweden using fossil-free hydrogen and renewable electricity, providing pulp and paper, mining, and water treatment customers with a product that reduces Scope 3 carbon emissions by up to 90% compared to conventional natural gas steam reforming processes.
What are the drivers, restraints and opportunities in the Mineral Leaching Oxidants Market?
Mine throughput and ore complexity support reagent demand, while ore-specific qualification constrains switching and creates an opening for chemistry-plus-service models.
- Driver: Higher hydrometallurgical throughput and more complex ores raise the need for controlled oxidation in leach circuits.
- Restraint: Oxidant performance is highly ore-dependent, which lengthens testwork and can raise total reagent cost when dosing is poorly matched.
- Opportunity: Suppliers can capture more value by combining oxidant supply with metallurgical testing, dosing support, and regional logistics.
More ore throughput creates recurring oxidant demand where redox conditions influence recovery. Canada offers a clear upstream signal: Natural Resources Canada reported in April 2026 that precious-metals exploration spending rose 12% to CAD 2.2 billion in 2025. Spending intentions for 2026 indicated a further 24% increase. Exploration does not translate immediately into reagent sales, but successful projects add future ore throughput and extend mine lives. At operating sites, the purchase response is more direct. Metallurgists use oxidants when oxygen transfer, sulfide reactivity, or target oxidation state becomes a bottleneck that can be improved economically.
Metallurgical qualification can delay a change in oxidant. The July 2026 Minerals review found that gold cyanidation responds to mineralogy, dissolved oxygen, pH and solution chemistry, and that excessive peroxide may decompose rapidly or enter inefficient side reactions. A result from one ore domain may therefore not hold in another. Recovery, consumption, downstream compatibility and operating stability all need to be tested before the mine changes chemistry.
Technical service can extend the supplier's role beyond reagent delivery. Oxidant suppliers can provide laboratory screening, startup support and dosage reviews alongside local inventory. This is useful for remote mines and changing ore bodies, where a successful initial trial still needs follow-up and dependable deliveries.
Which country CAGRs are profiled in the Mineral Leaching Oxidants Market?
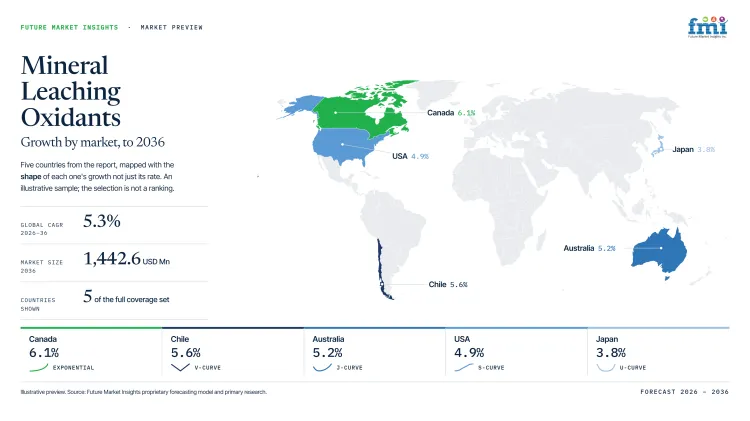
| Country | CAGR (2026 to 2036) |
|---|---|
| Canada | 6.1% |
| USA | 4.9% |
| Japan | 3.8% |
| Chile | 5.6% |
| Australia | 5.2% |
| Peru | 5.4% |
| South Africa | 5.0% |
How do country-level CAGRs compare in the mineral leaching oxidants market?
Canada’s 6.1% CAGR is the highest country forecast, ahead of Chile and Peru. Australia and South Africa complete a group ranging from 5.0% to 5.6%, with the USA close at 4.9%. Japan’s 3.8% produces a 2.3 percentage-point range over 2026 to 2036. Project pipelines, active processing and access to chemical supply explain the different opportunities; the rates do not rank present country market values.
- Natural Resources Canada’s April 2026 exploration review showed further precious-metals investment. Exploration is an early signal, with oxidant selection requiring metallurgical work well before a mine begins recurring purchases.
- USGS’s February 2026 review reported higher mineral-production value, including important western gold and copper operations. Remote sites need a dependable transport plan as well as evidence supporting any reagent change.
- JOGMEC’s December 2025 agreement with CODELCO addresses impurities in copper raw materials. This technical cooperation points to pilot and process-development work rather than a large domestic mine-volume opportunity.
- Solvay announced a Coronel hydrogen-peroxide capacity investment in June 2025. Nearby production can improve supply options, but each mine still needs to establish recovery and reagent economics through testwork.
- The government’s July 2026 resources outlook projected substantial gold and copper export earnings. Mines far from chemical production need regional inventory and safe bulk transport matched to the ore’s requirements.
- MINEM’s April 2025 investment portfolio spans projects across several departments. Approvals, community agreements and construction must progress before planned capacity becomes regular oxidant consumption.
- Statistics South Africa’s July 2026 release reported higher mining output, with gold contributing. Established circuits require diagnostics and ore-specific tests to justify a change in reagent or dosage.
Regional coverage includes North America; Latin America; Western Europe; Eastern Europe; East Asia; South Asia and Pacific; Middle East and Africa.
Country-wise Analysis
- Canada's market is projected to expand at 6.1% CAGR over 2026 to 2036. Natural Resources Canada reported in April 2026 that precious-metals exploration spending reached CAD 2.2 billion in 2025 and 2026 intentions pointed to CAD 2.7 billion. Exploration may take years to become producing throughput. Early metallurgical work can prepare a project for reagent selection, while regional stock and bulk transport plans address remote delivery.
- Sales of Mineral Leaching Oxidants in the USA are forecast to rise at 4.9% CAGR from 2026 to 2036. The USA Geological Survey reported in February 2026 that USA mineral production value reached USD 112 billion in 2025, with western states benefiting from higher gold and copper values. Qualification, chemical handling, and freight to remote mines can slow switching. A change from an established reagent program requires dependable domestic logistics and technical support at the mine.
- Adoption of Mineral Leaching Oxidants in Japan is forecast to expand at 3.8% CAGR from 2026 to 2036. JOGMEC announced in December 2025 a cooperation agreement with CODELCO to advance technology for reducing impurities in copper raw materials. The smaller domestic mining base limits bulk volumes. High-specification chemistry and pilot support can also serve Japanese resource projects at overseas processing sites.
- Demand for Mineral Leaching Oxidants in Chile is forecast to rise at 5.6% CAGR from 2026 to 2036. Solvay announced in June 2025 that Peróxidos do Brasil would invest USD 12 million at its Coronel hydrogen peroxide unit, with completion expected in 2026. Ore variability and the economics of mature leach assets keep qualification requirements high. Nearby production is most useful when local stock is backed by metallurgical testing and prompt technical response.
- Australia is expected to post 5.2% CAGR from 2026 to 2036. The Department of Industry reported in July 2026 that gold export earnings were forecast to reach AUD 73 billion in 2026-27, while copper export earnings were projected to rise over the outlook. Distance and changing ore mineralogy can raise delivered and technical-service costs. Regional depots and reliable bulk transport need to be matched with application support for remote sites.
- Demand for Mineral Leaching Oxidants in Peru is forecast to rise at 5.4% CAGR from 2026 to 2036. Peru's Ministry of Energy and Mines reported in April 2025 that its mining investment portfolio contained 67 projects across 19 departments with investment exceeding USD 64.1 billion. Project execution, community alignment, and site logistics can delay the point at which planned capacity becomes reagent demand. Local distributors, technical-service contracts and inventory near mining corridors can support projects as they reach operation.
- Sales of Mineral Leaching Oxidants in South Africa are forecast to expand at 5.0% CAGR from 2026 to 2036. Statistics South Africa reported in July 2026 that mining production increased 8.2% year on year in April 2026, with gold among the positive contributors. Older ore bodies and variable grades increase the need for testwork while cost pressure limits tolerance for inefficient dosing. Circuit diagnostics need to establish the reagent economics, backed by dependable supply.
Who are the notable companies in the Mineral Leaching Oxidants Market?
Solvay, Evonik, Arkema, Nouryon, Kemira, LANXESS.
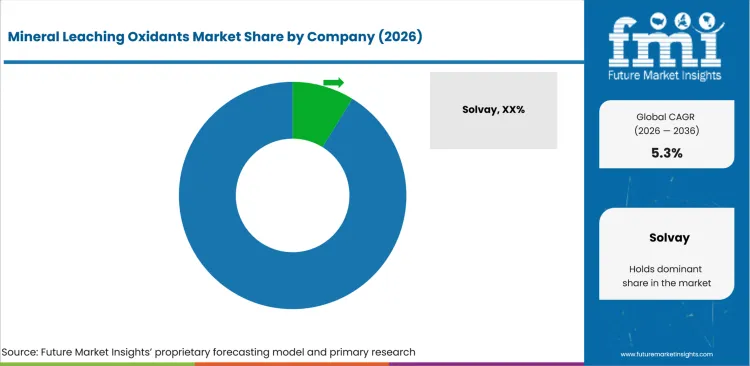
The company set is limited to current oxidant suppliers with products relevant to mineral extraction, metal treatment or closely related process oxidation.
- Peroxide platforms: Solvay, Evonik, Arkema and Nouryon combine industrial oxidant supply with product and process support.
- Specialty process oxidants: Kemira and LANXESS provide narrower oxidation chemistry and industrial supply capabilities for selected process conditions.
Competitive Benchmarking: Mineral Leaching Oxidants Market
| Company | Direct oxidant offer | Mine-process support | Industrial supply capability | Geographic reach |
|---|---|---|---|---|
| Solvay | High | High | High | International industrial markets |
| Evonik | High | High | High | International industrial markets |
| Arkema | High | High | High | International industrial markets |
| Nouryon | High | High | High | International industrial markets |
| Kemira | Medium | Medium | High | International process-industry markets |
| LANXESS | Medium | Medium | High | International specialty-chemical markets |
Scoring basis: High for Direct oxidant offer denotes documented peroxide or other oxidant products relevant to mineral processing. Medium denotes a narrower metal-treatment or process-oxidation role. High for Mine-process support denotes extraction-specific technical guidance; Medium denotes general industrial support. Ratings compare documented capabilities, not company sales shares.
Cyanide suppliers, water-treatment companies without a direct oxidant offer and former owners of divested mining businesses are excluded from the current company set.
Key Developments in the Mineral Leaching Oxidants Market
- In January 2025, Arkema announced a reorganization of its Jarrie site around hydrogen peroxide, chlorate and perchlorate production, highlighting the importance of feedstock continuity to oxidant supply.
- Evonik's HYPROX portfolio provides hydrogen-peroxide grades and technical support for oxidation applications, including mineral-processing use cases.
- Nouryon's Eka HP peroxide portfolio and Solvay's industrial hydrogen-peroxide operations provide alternative supply and technical routes for mineral-processing customers.
Key Players in the Mineral Leaching Oxidants Market
Industrial Peroxide Platforms
- Solvay
- Evonik
- Arkema
- Nouryon
Specialty Process-Oxidant Suppliers
- Kemira
- LANXESS
Mineral Leaching Oxidants Market - Report Scope
| Coverage field | Report scope |
|---|---|
| Market breakdown | Oxidant Type, Ore Type, Leaching System, End Use, and Sales Channel |
| Quantitative Units | Revenue in USD Million and CAGR in %. |
| Market Definition | Revenue includes sales of hydrogen peroxide, sodium hypochlorite, ferric sulfate, oxygen/air injection additives, and persulfate oxidants when sold for mineral-leaching systems across the defined ore types and end uses. Downstream metal revenue, finished products, non-oxidant leachants, and adjacent substitute chemistries are excluded. |
| Regions Covered | North America; Latin America; Western Europe; Eastern Europe; East Asia; South Asia and Pacific; Middle East and Africa |
| Countries Covered | Canada, USA, Japan, Chile, Australia, Peru, South Africa |
| Key Companies Profiled | Solvay, Evonik, Arkema, Nouryon, Kemira, LANXESS |
| Forecast Period | 2026 to 2036 |
| Approach | FMI applies a hybrid bottom-up and top-down approach, reconciling oxidant consumption by leach circuit and ore-processing activity with supplier, trade, and end-use indicators. |
Mineral Leaching Oxidants Market - Research Methodology
| Method | Approach |
|---|---|
| Primary Research | Structured discussions with chemical manufacturers, mining reagent distributors, hydrometallurgy specialists, mine-site procurement teams, and process engineers are used to test purchase criteria, dosing economics, supply constraints, and channel behavior. |
| Desk Research | Official mining statistics, government investment publications, company filings, first-party product material, and peer-reviewed technical literature are reviewed. |
| Market Sizing and Forecasting | Bottom-up reagent-demand estimates by ore type, leaching system, end use, and channel are reconciled with top-down chemical-supply and mining-activity indicators. Forecast assumptions consider mine development, ore throughput, reagent intensity, substitution, logistics, and environmental controls. |
| Data Validation | Cross-checks reconcile supplier capability, country mining activity, technical suitability, and channel evidence. Downstream metal revenue, adjacent leachants, duplicate reagent volumes, and unsupported claims are excluded. |
Mineral Leaching Oxidants Market by Segments
Mineral Leaching Oxidants Market segmented by Oxidant Type:
- Hydrogen peroxide
- Sodium hypochlorite
- Ferric sulfate
- Oxygen/air injection additives
- Persulfate oxidants
Mineral Leaching Oxidants Market segmented by Ore Type:
- Gold ores
- Copper ores
- Uranium ores
- Nickel/cobalt ores
- Polymetallic ores
Mineral Leaching Oxidants Market segmented by Leaching System:
- Acid leaching
- Alkaline leaching
- Cyanide leaching support
- Bioleaching support
Mineral Leaching Oxidants Market segmented by End Use:
- Mining operations
- Hydrometallurgy plants
- Pilot plants
- Reagent distributors
Mineral Leaching Oxidants Market segmented by Sales Channel:
- Direct chemical supply
- Mining reagent distributors
- Technical service contracts
- Regional depots
Mineral Leaching Oxidants Market by Region:
- North America
- United States
- Canada
- Latin America
- Brazil
- Mexico
- Argentina
- Chile
- Western Europe
- Germany
- France
- United Kingdom
- Italy
- Spain
- Benelux
- Nordics
- Eastern Europe
- Poland
- Czech Republic
- Romania
- Hungary
- East Asia
- China
- Japan
- South Korea
- South Asia and Pacific
- India
- ASEAN
- Australia and New Zealand
- Middle East and Africa
- GCC Countries
- South Africa
- Türkiye
- Israel
Research Sources and Bibliography
- Natural Resources Canada (2026, April 7). Canadian Mineral Exploration Information Bulletin.
- USA Geological Survey (2026, February 6). Value of USA mineral production rose last year, driven by precious metals prices.
- Japan Organization for Metals and Energy Security (2025, December 8). Agreement on Cooperation for Technology to Reduce Impurities in Copper Raw Materials with CODELCO - Expectation for Stable Supply of Copper Resources.
- Australian Government Department of Industry, Science and Resources (2026, July 3). Resources and energy quarterly: June 2026.
- Ministerio de Energía y Minas, Peru (2025, April 28). MINEM: Cartera de Proyectos de Inversión Minera 2025 está compuesta por 67 proyectos.
- Statistics South Africa (2026, July 14). Mining: Production and sales, April 2026.
- Matar, M., Lim, B., Albijanic, B., Oraby, E., Baawuah, E., Staunton, W., and Blackwell, K. (2026, July 17). Industrial Relevance of Oxidants and Leaching Accelerants in Cyanidation of Gold Sulfide Ores. Minerals, 16(7), 745.
- Solvay (2025, June 23). Peróxidos do Brasil reinforces leadership in South America with new strategic investment in Chile.
- Solvay (n.d.; accessed August 18, 2026). Peroxides Metals and Mining Solutions.
- Evonik (n.d.; accessed August 18, 2026). Energy and Mining | Mining.
- Evonik (2026, July 30). Evonik-licensed hydrogen peroxide mega plant starts operations in Leshan, China.
- Arkema (2025, January 21). Arkema announces a project to refocus the activity of its Jarrie site.
- Nouryon (n.d.; accessed August 18, 2026). Eka® HP - hydrogen peroxide.
- Evonik Active Oxygens (n.d.; accessed September 9, 2026). Hydrogen Peroxide for Mining.
- Arkema (n.d.; accessed September 9, 2026). Mining and Mineral Processing; Hydrogen Peroxide.
- Nouryon (n.d.; accessed September 9, 2026). Eka HP Hydrogen Peroxide.
- LANXESS (n.d.; accessed September 9, 2026). Oxone: Metal Finishing & Hydrometallurgy.
- Evonik (accessed September 9, 2026). HYPROX hydrogen peroxide for mining and mineral processing.
- Nouryon (accessed September 9, 2026). Eka HP hydrogen peroxide portfolio.
- Solvay (accessed September 9, 2026). Hydrogen peroxide for industrial and mining applications.
This bibliography is provided for reader reference and is not exhaustive. The full report contains the complete reference list and detailed citations.
This Report Answers
- Which mining and hydrometallurgical pressures support demand for mineral leaching oxidants?
- Why does Hydrogen peroxide hold the leading position within Oxidant Type?
- How do Gold ores influence downstream demand for oxidant chemistry and process support?
- Why does Acid leaching hold the leading position within Leaching System?
- How do growth rates differ across Canada, USA, Japan, Chile, Australia, Peru, and South Africa?
- Which companies have direct products and market-relevant capabilities in this market?
- What technical and qualification constraints limit adoption of mineral leaching oxidants?
- What should mine-site procurement and metallurgical teams evaluate before purchasing an oxidant program?
Frequently Asked Questions
How big is the Mineral Leaching Oxidants Market in 2026?
The mineral leaching oxidants market is valued at USD 860.7 million in 2026 and is forecast to reach USD 1442.6 million by 2036. Growth is supported by rising hydrometallurgical throughput and more complex ore bodies that create recurring demand for controlled oxidation chemistry across active leach circuits at mining operations worldwide.
What is the CAGR of the Mineral Leaching Oxidants Market from 2026 to 2036?
The mineral leaching oxidants market grows at a CAGR of 5.3% between 2026 and 2036, supported by mining operations adopting oxidant programs once ore-specific testwork confirms recovery improvements and reagent efficiency within established leach circuits across gold, copper, uranium, and polymetallic processing sites.
Which oxidant type leads the Mineral Leaching Oxidants Market?
Hydrogen peroxide accounts for 31.0% of the mineral leaching oxidants market by oxidant type in 2026, driven by its ability to supplement oxygen and directly influence oxidation conditions in multiple leach workflows, with suppliers competing on concentration options, safe handling, and technical guidance alongside reliable bulk delivery.
How much will the Mineral Leaching Oxidants Market add between 2026 and 2036?
The mineral leaching oxidants market is set to add USD 581.9 million between 2026 and 2036, growing from USD 860.7 million to USD 1442.6 million as oxidant supply combined with metallurgical testing, dosing support, and regional logistics enters recurring procurement programs across a widening base of mining operations.
Who are the leading companies in the Mineral Leaching Oxidants Market?
Six companies lead the mineral leaching oxidants market, including Solvay, Evonik, Arkema, Nouryon, Kemira, and LANXESS, competing through industrial peroxide platforms, specialty process-oxidant chemistry, mine-process technical support, and international supply capabilities across hydrometallurgical leach circuits and mining reagent procurement programs worldwide.
Preview the report firsthand - request a free sample
Get SampleGet the brochure for pricing and purchase details.
Get PDFTable of Content
- Key Takeaways
- Market Size and CAGR
- Top Growth Driver
- Fastest Growing Segment
- Leading Region
- Key Companies
- Emerging Opportunities
- Executive Summary
- Global Market Outlook
- Demand-side Trends
- Supply-side Trends
- Technology Roadmap Analysis
- Analysis and Recommendations
- Analyst Perspective (What is happening? Why now? What should investors know?)
- Key Questions Answered
- How large is the market?
- What is the CAGR?
- What are key trends?
- Which region dominates?
- Who are the leaders?
- Market Overview
- Market Coverage / Taxonomy
- Market Definition / Scope / Limitations
- Research Methodology
- Chapter Orientation
- Analytical Lens and Working Hypotheses
- Market Structure, Signals, and Trend Drivers
- Benchmarking and Cross-market Comparability
- Market Sizing, Forecasting, and Opportunity Mapping
- Research Design and Evidence Framework
- Desk Research Programme (Secondary Evidence)
- Expert Input and Fieldwork (Primary Evidence)
- Tooling, Models, and Reference Databases
- Data Engineering and Model Build
- Quality Assurance and Audit Trail
- Market Background
- Market Dynamics (Drivers, Restraints, Opportunity, Trends)
- Scenario Forecast (Optimistic, Likely, Conservative)
- Impact Analysis
- AI Impact
- Sustainability Impact
- Regulatory Impact
- Technology Impact
- Consumer / Buyer Analysis
- Purchase Drivers
- Adoption Barriers
- Buyer Journey
- Opportunity Map Analysis
- Product Life Cycle Analysis
- Supply Chain Analysis
- Investment Feasibility Matrix
- Value Chain Analysis
- PESTLE and Porter's Analysis
- Regulatory Landscape
- Regional Parent Market Outlook
- Production and Consumption Statistics
- Import and Export Statistics
- Global Market Analysis and Forecast, 2021 to 2036
- Historical Market Size Value (USD Million) Analysis, 2021 to 2025
- Current and Future Market Size Value (USD Million) Projections, 2026 to 2036
- Y-o-Y Growth Trend Analysis
- Absolute $ Opportunity Analysis
- Global Market Pricing Analysis, 2021 to 2036
- Global Market Analysis and Forecast, By Oxidant Type, 2021 to 2036
- Introduction / Key Findings
- Historical Market Size Value (USD Million) Analysis By Oxidant Type, 2021 to 2025
- Current and Future Market Size Value (USD Million) Analysis and Forecast By Oxidant Type, 2026 to 2036
- Hydrogen peroxide
- Sodium hypochlorite
- Ferric sulfate
- Oxygen/air injection additives
- Persulfate oxidants
- Hydrogen peroxide
- Y-o-Y Growth Trend Analysis By Oxidant Type, 2021 to 2025
- Absolute $ Opportunity Analysis By Oxidant Type, 2026 to 2036
- Global Market Analysis and Forecast, By Ore Type, 2021 to 2036
- Introduction / Key Findings
- Historical Market Size Value (USD Million) Analysis By Ore Type, 2021 to 2025
- Current and Future Market Size Value (USD Million) Analysis and Forecast By Ore Type, 2026 to 2036
- Gold ores
- Copper ores
- Uranium ores
- Nickel/cobalt ores
- Polymetallic ores
- Gold ores
- Y-o-Y Growth Trend Analysis By Ore Type, 2021 to 2025
- Absolute $ Opportunity Analysis By Ore Type, 2026 to 2036
- Global Market Analysis and Forecast, By Leaching System, 2021 to 2036
- Introduction / Key Findings
- Historical Market Size Value (USD Million) Analysis By Leaching System, 2021 to 2025
- Current and Future Market Size Value (USD Million) Analysis and Forecast By Leaching System, 2026 to 2036
- Acid leaching
- Alkaline leaching
- Cyanide leaching support
- Bioleaching support
- Acid leaching
- Y-o-Y Growth Trend Analysis By Leaching System, 2021 to 2025
- Absolute $ Opportunity Analysis By Leaching System, 2026 to 2036
- Global Market Analysis and Forecast, By End Use, 2021 to 2036
- Introduction / Key Findings
- Historical Market Size Value (USD Million) Analysis By End Use, 2021 to 2025
- Current and Future Market Size Value (USD Million) Analysis and Forecast By End Use, 2026 to 2036
- Mining operations
- Hydrometallurgy plants
- Pilot plants
- Reagent distributors
- Mining operations
- Y-o-Y Growth Trend Analysis By End Use, 2021 to 2025
- Absolute $ Opportunity Analysis By End Use, 2026 to 2036
- Global Market Analysis and Forecast, By Sales Channel, 2021 to 2036
- Introduction / Key Findings
- Historical Market Size Value (USD Million) Analysis By Sales Channel, 2021 to 2025
- Current and Future Market Size Value (USD Million) Analysis and Forecast By Sales Channel, 2026 to 2036
- Direct chemical supply
- Mining reagent distributors
- Technical service contracts
- Regional depots
- Direct chemical supply
- Y-o-Y Growth Trend Analysis By Sales Channel, 2021 to 2025
- Absolute $ Opportunity Analysis By Sales Channel, 2026 to 2036
- Global Market Analysis and Forecast, By Region, 2021 to 2036
- Introduction
- Historical Market Size Value (USD Million) Analysis By Region, 2021 to 2025
- Current Market Size Value (USD Million) Analysis and Forecast By Region, 2026 to 2036
- North America
- Latin America
- Western Europe
- Eastern Europe
- East Asia
- South Asia and Pacific
- Middle East & Africa
- Market Attractiveness Analysis By Region
- North America Market Analysis and Forecast, By Country, 2021 to 2036
- Historical Market Size Value (USD Million) Trend Analysis By Market Taxonomy, 2021 to 2025
- Market Size Value (USD Million) Forecast By Market Taxonomy, 2026 to 2036
- By Country
- USA
- Canada
- By Oxidant Type
- By Ore Type
- By Leaching System
- By End Use
- By Sales Channel
- By Country
- Market Attractiveness Analysis
- By Country
- By Oxidant Type
- By Ore Type
- By Leaching System
- By End Use
- By Sales Channel
- Key Takeaways
- Latin America Market Analysis and Forecast, By Country
- Historical Market Size Value (USD Million) Trend Analysis By Market Taxonomy, 2021 to 2025
- Market Size Value (USD Million) Forecast By Market Taxonomy, 2026 to 2036
- By Country
- Brazil
- Mexico
- Chile
- Rest of Latin America
- By Oxidant Type
- By Ore Type
- By Leaching System
- By End Use
- By Sales Channel
- By Country
- Market Attractiveness Analysis
- By Country
- By Oxidant Type
- By Ore Type
- By Leaching System
- By End Use
- By Sales Channel
- Key Takeaways
- Western Europe Market Analysis and Forecast, By Country
- Historical Market Size Value (USD Million) Trend Analysis By Market Taxonomy, 2021 to 2025
- Market Size Value (USD Million) Forecast By Market Taxonomy, 2026 to 2036
- By Country
- Germany
- UK
- Italy
- Spain
- France
- Nordic
- BENELUX
- Rest of Western Europe
- By Oxidant Type
- By Ore Type
- By Leaching System
- By End Use
- By Sales Channel
- By Country
- Market Attractiveness Analysis
- By Country
- By Oxidant Type
- By Ore Type
- By Leaching System
- By End Use
- By Sales Channel
- Key Takeaways
- Eastern Europe Market Analysis and Forecast, By Country
- Historical Market Size Value (USD Million) Trend Analysis By Market Taxonomy, 2021 to 2025
- Market Size Value (USD Million) Forecast By Market Taxonomy, 2026 to 2036
- By Country
- Russia
- Poland
- Hungary
- Balkan & Baltic
- Rest of Eastern Europe
- By Oxidant Type
- By Ore Type
- By Leaching System
- By End Use
- By Sales Channel
- By Country
- Market Attractiveness Analysis
- By Country
- By Oxidant Type
- By Ore Type
- By Leaching System
- By End Use
- By Sales Channel
- Key Takeaways
- East Asia Market Analysis and Forecast, By Country
- Historical Market Size Value (USD Million) Trend Analysis By Market Taxonomy, 2021 to 2025
- Market Size Value (USD Million) Forecast By Market Taxonomy, 2026 to 2036
- By Country
- China
- Japan
- South Korea
- By Oxidant Type
- By Ore Type
- By Leaching System
- By End Use
- By Sales Channel
- By Country
- Market Attractiveness Analysis
- By Country
- By Oxidant Type
- By Ore Type
- By Leaching System
- By End Use
- By Sales Channel
- Key Takeaways
- South Asia and Pacific Market Analysis and Forecast, By Country
- Historical Market Size Value (USD Million) Trend Analysis By Market Taxonomy, 2021 to 2025
- Market Size Value (USD Million) Forecast By Market Taxonomy, 2026 to 2036
- By Country
- India
- ASEAN
- Australia & New Zealand
- Rest of South Asia and Pacific
- By Oxidant Type
- By Ore Type
- By Leaching System
- By End Use
- By Sales Channel
- By Country
- Market Attractiveness Analysis
- By Country
- By Oxidant Type
- By Ore Type
- By Leaching System
- By End Use
- By Sales Channel
- Key Takeaways
- Middle East & Africa Market Analysis and Forecast, By Country
- Historical Market Size Value (USD Million) Trend Analysis By Market Taxonomy, 2021 to 2025
- Market Size Value (USD Million) Forecast By Market Taxonomy, 2026 to 2036
- By Country
- Kingdom of Saudi Arabia
- Other GCC Countries
- Türkiye
- South Africa
- Other African Union
- Rest of Middle East & Africa
- By Oxidant Type
- By Ore Type
- By Leaching System
- By End Use
- By Sales Channel
- By Country
- Market Attractiveness Analysis
- By Country
- By Oxidant Type
- By Ore Type
- By Leaching System
- By End Use
- By Sales Channel
- Key Takeaways
- Key Countries Market Analysis
- USA
- Pricing Analysis
- Market Share Analysis, 2025
- By Oxidant Type
- By Ore Type
- By Leaching System
- By End Use
- By Sales Channel
- Canada
- Pricing Analysis
- Market Share Analysis, 2025
- By Oxidant Type
- By Ore Type
- By Leaching System
- By End Use
- By Sales Channel
- Mexico
- Pricing Analysis
- Market Share Analysis, 2025
- By Oxidant Type
- By Ore Type
- By Leaching System
- By End Use
- By Sales Channel
- Brazil
- Pricing Analysis
- Market Share Analysis, 2025
- By Oxidant Type
- By Ore Type
- By Leaching System
- By End Use
- By Sales Channel
- Chile
- Pricing Analysis
- Market Share Analysis, 2025
- By Oxidant Type
- By Ore Type
- By Leaching System
- By End Use
- By Sales Channel
- Germany
- Pricing Analysis
- Market Share Analysis, 2025
- By Oxidant Type
- By Ore Type
- By Leaching System
- By End Use
- By Sales Channel
- UK
- Pricing Analysis
- Market Share Analysis, 2025
- By Oxidant Type
- By Ore Type
- By Leaching System
- By End Use
- By Sales Channel
- Italy
- Pricing Analysis
- Market Share Analysis, 2025
- By Oxidant Type
- By Ore Type
- By Leaching System
- By End Use
- By Sales Channel
- Spain
- Pricing Analysis
- Market Share Analysis, 2025
- By Oxidant Type
- By Ore Type
- By Leaching System
- By End Use
- By Sales Channel
- France
- Pricing Analysis
- Market Share Analysis, 2025
- By Oxidant Type
- By Ore Type
- By Leaching System
- By End Use
- By Sales Channel
- India
- Pricing Analysis
- Market Share Analysis, 2025
- By Oxidant Type
- By Ore Type
- By Leaching System
- By End Use
- By Sales Channel
- ASEAN
- Pricing Analysis
- Market Share Analysis, 2025
- By Oxidant Type
- By Ore Type
- By Leaching System
- By End Use
- By Sales Channel
- Australia & New Zealand
- Pricing Analysis
- Market Share Analysis, 2025
- By Oxidant Type
- By Ore Type
- By Leaching System
- By End Use
- By Sales Channel
- China
- Pricing Analysis
- Market Share Analysis, 2025
- By Oxidant Type
- By Ore Type
- By Leaching System
- By End Use
- By Sales Channel
- Japan
- Pricing Analysis
- Market Share Analysis, 2025
- By Oxidant Type
- By Ore Type
- By Leaching System
- By End Use
- By Sales Channel
- South Korea
- Pricing Analysis
- Market Share Analysis, 2025
- By Oxidant Type
- By Ore Type
- By Leaching System
- By End Use
- By Sales Channel
- Russia
- Pricing Analysis
- Market Share Analysis, 2025
- By Oxidant Type
- By Ore Type
- By Leaching System
- By End Use
- By Sales Channel
- Poland
- Pricing Analysis
- Market Share Analysis, 2025
- By Oxidant Type
- By Ore Type
- By Leaching System
- By End Use
- By Sales Channel
- Hungary
- Pricing Analysis
- Market Share Analysis, 2025
- By Oxidant Type
- By Ore Type
- By Leaching System
- By End Use
- By Sales Channel
- Kingdom of Saudi Arabia
- Pricing Analysis
- Market Share Analysis, 2025
- By Oxidant Type
- By Ore Type
- By Leaching System
- By End Use
- By Sales Channel
- Türkiye
- Pricing Analysis
- Market Share Analysis, 2025
- By Oxidant Type
- By Ore Type
- By Leaching System
- By End Use
- By Sales Channel
- South Africa
- Pricing Analysis
- Market Share Analysis, 2025
- By Oxidant Type
- By Ore Type
- By Leaching System
- By End Use
- By Sales Channel
- USA
- Market Structure Analysis
- Competition Dashboard
- Competition Benchmarking
- Market Share Analysis of Top Players
- By Regional
- By Oxidant Type
- By Ore Type
- By Leaching System
- By End Use
- By Sales Channel
- Emerging Startups
- Innovation Benchmarking
- Competition Analysis
- Competition Deep Dive
- Solvay
- Overview
- Product Portfolio
- Profitability by Market Segments
- Sales Footprint
- Strategy Overview
- Marketing Strategy
- Product Strategy
- Channel Strategy
- Evonik
- Arkema
- Kemira
- BASF
- Nouryon
- Orica
- Ecolab
- Chemours
- LANXESS
- Solvay
- Case Studies
- Success Stories
- Recent Developments
- Competition Deep Dive
- Assumptions & Acronyms Used


