Moveable Water Tap Market
Ease of Utility and Convenience are primary reasons propelling demand for Moveable Water Taps in the long-run
Moveable Water Tap Market by End User, Material, Application, Distribution Channels, End-user & Region - Forecast 2022 - 2032
Moveable Water Tap Market Outlook (2022-2032)
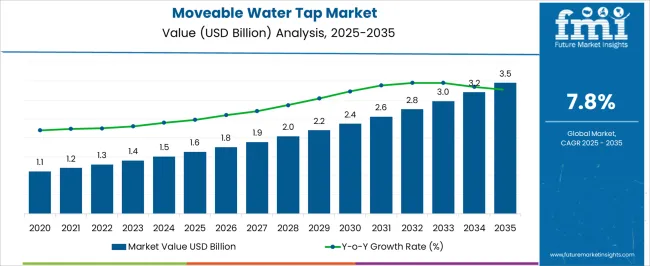
[297 Pages Report] The global moveable water tap market is anticipated to reach a valuation of US$ 1,300 Million in 2022. Demand is expected to take a turn for the better, attributable to preference for using portable accessories which offers more convenience. Overall, sales of moveable water taps are projected to grow at a CAGR of 7.8% between 2022 and 2032, totaling around US$ 2,755.1 Million by the end of 2032.
Data Points |
Key Statistics |
Moveable Water Tap Market Size (2022) |
US$ 1,300 Million |
Moveable Water Tap Market Revenue Forecast (2032) |
US$ 2,755.1 Million |
Moveable Water Tap Market Growth Rate (2022-2032) |
7.8% CAGR |
North America Market Share |
29.4% |
According to Future Market Insights' most recent research, the movable water tap market is predicted to expand steadily over the forecast period. The burgeoning use of modernized kitchens and bathrooms is expected to boost demand for mobile kitchen and bathroom water taps.
The growing preference for the elegant design of kitchen and bathroom fixtures, as well as the configuration of multi-functional tools, is predicted to propel the faucets market.
Let us know your requirement to get
100% FREE customization
Which Factors are driving the Growth of the Moveable Water Tap Market?
Customers' preference for an urban lifestyle has fueled the market growth. Furthermore, the customer's improving lifestyle, shifting preferences, and widening disposable income has increased spending on luxury homes and remodeling.
This encourages manufacturers to produce elevated bathroom and kitchen apparel. This shift in lifestyle and urbanization will have a positive impact on the demand for mobile faucets.
Furthermore, many participants are investing in R&D to deliver the best quality and appearance of tap to the customer. HASDING, for example, introduced a 360° rotatable anti-splash sink faucet with three modes. The high-performance tap extender makes it simple to modify the water outlet mode. Soft Stream Bubble, Shower Mode, and Shower Pulse are three modes that provide more options for conserving water. Such tap features entice customers to select such faucets that save water and promote sales in the water scarcity area.
How Will Growth Unfold in the North America Moveable Water Tap Market?
The most technologically advanced generations are thought to be the youngest ones. Because these generations have witnessed several technological advancements, millennials expect firms to supply a greater choice of accessories. The younger generation is captivated by smart products. Millennials are the generation most interested in having smart technology in their bathroom and kitchen. The introduction of the sensor-based movable bathroom and kitchen tap, with an aim of water conservation and ensuring proper hygiene in the washing area, is happily accepted by the people of North America.
Furthermore, with the fast-changing lifestyle and urbanization, the possessions of houses are also growing in the United States and Canada, this factor has required the installation of the tap in the bathroom and kitchen. And people of the region know the benefits of the moveable taps like this type of taps save water, also cleaning is easy with these taps. Thus, the business of the moving tap is rising in the region. Moreover, the remodeling and repairing of house utility areas including bathrooms and kitchens have generated a fair demand for movable water faucets in the region. North America is accounting for a market share of 29.4% of the global moveable water tap market.
Find your sweet spots for generating winning opportunities in this market.
Talk to AnalystHow Will Growth Unfold in the European Moveable Water Tap Market?
Amid the COVID-19 outbreak, the moveable water tap market has faced extensive growth challenges, due to store closures across different regions of Europe. Besides this, the consumers’ shift from retail stores to online buying has opened new sales opportunities for online retailers in the market. While during the forecast period the movable water faucet demand remains fragmented with the presence and entering of a large number of key players in the market in Europe.
Many key players in the market are providing unique looks, styles, and designs for faucets. Many pro players are also having skilled labor to manufacture and design products, which helps the player to strengthen their presence in the European countries. Furthermore, many players supply their movable water taps through their distribution channels. Moreover, to maintain good relations with customers, players are providing advisory and technical services along with a warranty to their consumers. This helps the players to gain competitive advantages in the market in Europe.
Moreover, the changing lifestyle has a renovated kitchen as a place for family and friends to gather rather than a place for just cooking. This change is attributed to the increasing demand for sophisticated, elegant, and multifunctional kitchen taps. For instance, Franke Kitchen Systems introduce a tap equipped with the ability to swivel 360 degrees and switch between full and needle water spray. Europe is accounting for a market share of 23.4% of the global moveable water tap market in 2022.
Also, its 3-in-1 tap is manufactured to give cold, hot, and distilled water to provide all types of water for kitchen purposes. Such innovation gives the idea to other players to launch such type of tap to gain a competitive advantage in the market.
Category-wise Analysis
Which Segments Dominate the Global Moveable Water Tap Market?
Commercial and Residential Segments that Likely to Augment Moveable Water Tap Sales
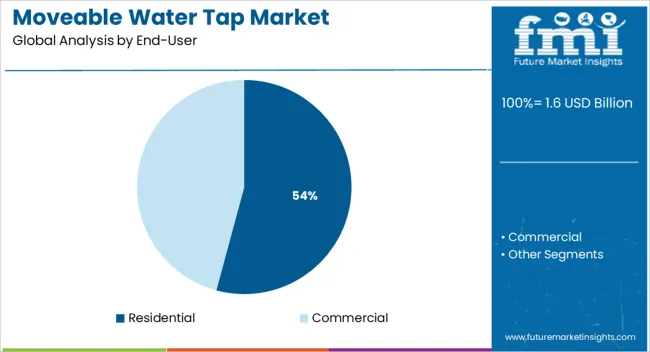
Significant expansion in commercial places including hospitals, restaurants, hotels, shopping complexes, railway stations, airports, and utility areas is expected to drive the market demand for movable water faucets during the forecast period. For instance, Delta Faucet Company offers innovative commercial taps for various sectors.
The ShieldSpray® Technology of the company cleans like laser precision while containing splatter ad mess. A pressurized jet present in the protective sphere powers away the stubborn messes with almost 90% less splatter than a traditional spray so people can spend minimum time soaking, shirt swapping, and scrubbing.
Furthermore, in the residential sector, the market for the moveable tap is growing because people depend on premium bathroom and kitchen accessories that complement the interiors as well as survey the purpose. Also, the sales of water taps are increased with the increasing number of households.

A unified Market Research Subscription Platform, built for today's disparate research needs.
The Start-Up Ecosystem: How key Players are opening Frontiers for Future Growth?
Manufacturers are adopting various marketing strategies such as new product launches, geographical expansion, mergers and acquisitions, partnerships, and collaboration to identify the interest of potential buyers and create a larger customer base. For instance,
- Spazio Infracity Private Limited is a Private company that was founded on June 30, 2014. SPAZIO Stainless Steel MAX Collection Bib Cock Tap has been introduced to the market.
- Kanye announced the founding of DONDA, a creative content company named after his mother, on January 5, 2012. The DONDA Stainless Steel 360 Degree Flexible Rotating 2 Modes Water Saving Faucet was recently introduced to the market.
Who are the Leading Players in the Moveable Water Tap Market?
Some of the leading moveable water tap manufacturers include Franke Home Solutions, Kohler Co., Gerber Plumbing Fixtures LLC, DELTA FAUCET COMPANY, Meon Incorporated, Quooker Hong Kong Ltd, GROHE, LIXIL Corporation, and many others.
These key moveable water tap providers are adopting various strategies such as new product launches and approvals, partnerships, collaborations, acquisitions, mergers, etc. to increase their sales and gain a competitive edge in the global moveable water tap market. For instance,
- Franke Kitchen Systems introduced a tap that can swivel 360 degrees and switch between full and needle water spray in June 2021.
- The Sensate® faucet with KOHLER Konnect®, introduced by Kohler Co. in January 2019, is a virtual kitchen assistant. Simply say the words to receive precise amounts of water and other hands-free assistance.
- Danze® by Gerber, a pioneer in the North American décor plumbing industry, launched three new pull-down prep faucets in September 2019, creating a comprehensive kitchen solution that enhances both functionality and efficiency.
- Delta H 2Okinetic Technology, which was introduced by DELTA FAUCET in May 2022, sculpts water into a distinctive wave pattern that provides more warmth, intensity, and coverage.
Report Scope
Report Attribute |
Details |
Growth Rate |
CAGR of 7.8% from 2022-2032 |
Market Value in 2022 |
US$ 1,300 Million |
Market Value in 2032 |
US$ 2,755.1 Million |
Base Year for Estimates |
2021 |
Historical Data |
2016-2021 |
Forecast Period |
2022-2032 |
Quantitative Units |
Revenue in US$ Million and CAGR from 2022-2032 |
Report Coverage |
Revenue Forecast, Company Ranking, Competitive Landscape, Growth Factors, Trends, and Pricing Analysis |
Segments Covered |
|
Regions Covered |
|
Key Countries Profiled |
|
Key Companies Profiled |
|
Report Customization & Pricing |
Available upon Request |
Key Segments of Moveable Water Tap Industry Survey
Moveable Water Taps Market by End User:
- Moveable Water Taps for Residential Use
- Moveable Water Taps for Commercial Use
Moveable Water Taps Market by Material:
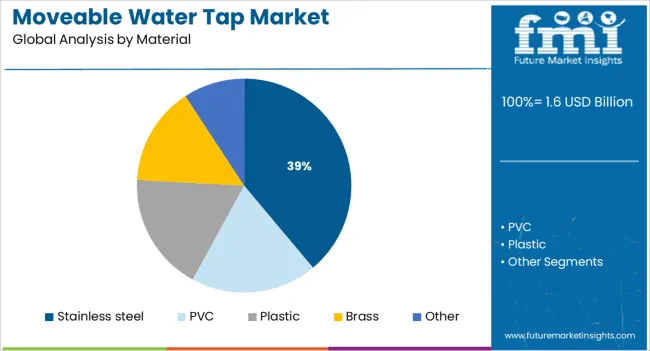
- PVC-based Moveable Water Taps
- Plastic-based Moveable Water Taps
- Brass-based Moveable Water Taps
- Stainless Steel-based Moveable Water Taps
- Other Material-based Moveable Water Taps
Moveable Water Taps Market by Application:
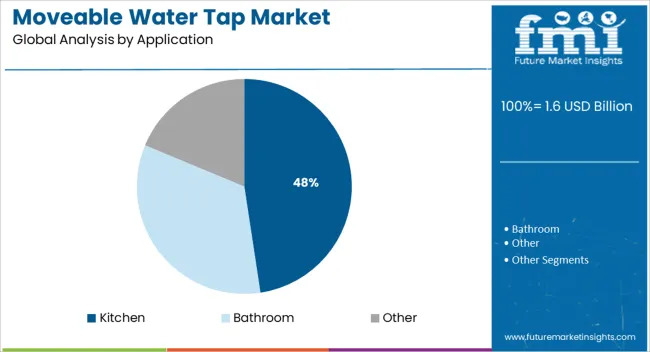
- Moveable Water Taps for Kitchens
- Moveable Water Taps for Bathrooms
- Moveable Water Taps for Other Applications
Moveable Water Taps Market by Distribution Channels:
- Direct Sales of Moveable Water Taps
- Moveable Water Tap Sales via Hypermarkets/Supermarkets
- Moveable Water Tap Sales via Specialty Stores
- Moveable Water Tap Sales via Online Retailing
- Moveable Water Tap Sales via Other Distribution Channels
Moveable Water Taps Market by Region:
- North America Moveable Water Tap Market
- Latin America Moveable Water Tap Market
- Europe Moveable Water Tap Market
- Asia Pacific Moveable Water Tap Market
- Middle East & Africa Moveable Water Tap Market
Frequently Asked Questions
The global moveable water tap market reached US$ 1,300 Million in 2022
As per FMI, the moveable water tap industry is expected to grow at a CAGR of 7.8% from 2022-2032
The global sales of Moveable Water Taps are anticipated to total a valuation of US$ 2,755.1 Million by 2032
North America will continue to remain the most lucrative market for moveable water taps, accounting for a share of 29.4%
Table of Content
1. Executive Summary
1.1. Global Market Outlook
1.2. Demand-side Trends
1.3. Supply-side Trends
1.4. Technology Roadmap Analysis
1.5. Analysis and Recommendations
2. Market Overview
2.1. Market Coverage / Taxonomy
2.2. Market Definition / Scope / Limitations
3. Market Background
3.1. Market Dynamics
3.1.1. Drivers
3.1.2. Restraints
3.1.3. Opportunity
3.1.4. Trends
3.2. Scenario Forecast
3.2.1. Demand in Optimistic Scenario
3.2.2. Demand in Likely Scenario
3.2.3. Demand in Conservative Scenario
3.3. Opportunity Map Analysis
3.4. Product Life Cycle Analysis
3.5. Supply Chain Analysis
3.5.1. Supply Side Participants and their Roles
3.5.1.1. Producers
3.5.1.2. Mid-Level Participants (Traders/ Agents/ Brokers)
3.5.1.3. Wholesalers and Distributors
3.5.2. Value Added and Value Created at Node in the Supply Chain
3.5.3. List of Raw Material Suppliers
3.5.4. List of Existing and Potential Buyer’s
3.6. Investment Feasibility Matrix
3.7. Value Chain Analysis
3.7.1. Profit Margin Analysis
3.7.2. Wholesalers and Distributors
3.7.3. Retailers
3.8. PESTLE and Porter’s Analysis
3.9. Regulatory Landscape
3.9.1. By Key Regions
3.9.2. By Key Countries
3.10. Regional Parent Market Outlook
3.11. Production and Consumption Statistics
3.12. Import and Export Statistics
4. Global Moveable Water Tap Market Analysis 2016-2021 and Forecast, 2022-2032
4.1. Historical Market Size Value (US$ Mn) & Volume (Units) Analysis, 2016-2021
4.2. Current and Future Market Size Value (US$ Mn) & Volume (Units) Projections, 2022-2032
4.2.1. Y-o-Y Growth Trend Analysis
4.2.2. Absolute $ Opportunity Analysis
5. Global Moveable Water Tap Market Analysis 2016-2021 and Forecast 2022-2032, By End-User
5.1. Introduction / Key Findings
5.2. Historical Market Size Value (US$ Mn) & Volume (Units) Analysis By End-User, 2016-2021
5.3. Current and Future Market Size Value (US$ Mn) & Volume (Units) Analysis and Forecast By End-User, 2022-2032
5.3.1. Residential
5.3.2. Commercial
5.4. Y-o-Y Growth Trend Analysis By End-User, 2016-2021
5.5. Absolute $ Opportunity Analysis By End-User, 2022-2032
6. Global Moveable Water Tap Market Analysis 2016-2021 and Forecast 2022-2032, By Material
6.1. Introduction / Key Findings
6.2. Historical Market Size Value (US$ Mn) & Volume (Units) Analysis By Material, 2016-2021
6.3. Current and Future Market Size Value (US$ Mn) & Volume (Units) Analysis and Forecast By Material, 2022-2032
6.3.1. PVC
6.3.2. Plastic
6.3.3. Brass
6.3.4. Stainless steel
6.3.5. Other
6.4. Y-o-Y Growth Trend Analysis By Material, 2016-2021
6.5. Absolute $ Opportunity Analysis By Material, 2022-2032
7. Global Moveable Water Tap Market Analysis 2016-2021 and Forecast 2022-2032, By Application
7.1. Introduction / Key Findings
7.2. Historical Market Size Value (US$ Mn) & Volume (Units) Analysis By Application, 2016-2021
7.3. Current and Future Market Size Value (US$ Mn) & Volume (Units) Analysis and Forecast By Application, 2022-2032
7.3.1. Kitchen
7.3.2. Bathroom
7.3.3. Other
7.4. Y-o-Y Growth Trend Analysis By Application, 2016-2021
7.5. Absolute $ Opportunity Analysis By Application, 2022-2032
8. Global Moveable Water Tap Market Analysis 2016-2021 and Forecast 2022-2032, By Distribution Channels
8.1. Introduction / Key Findings
8.2. Historical Market Size Value (US$ Mn) & Volume (Units) Analysis By Distribution Channels, 2016-2021
8.3. Current and Future Market Size Value (US$ Mn) & Volume (Units) Analysis and Forecast By Distribution Channels, 2022-2032
8.3.1. Direct Sales
8.3.2. Hypermarkets/ Supermarkets
8.3.3. Specialty Stores
8.3.4. Online retailing
8.3.5. Others
8.4. Y-o-Y Growth Trend Analysis By Distribution Channels, 2016-2021
8.5. Absolute $ Opportunity Analysis By Distribution Channels, 2022-2032
9. Global Moveable Water Tap Market Analysis 2016-2021 and Forecast 2022-2032, By Region
9.1. Introduction
9.2. Historical Market Size Value (US$ Mn) & Volume (Units) Analysis By Region, 2016-2021
9.3. Current Market Size Value (US$ Mn) & Volume (Units) Analysis and Forecast By Region, 2022-2032
9.3.1. North America
9.3.2. Latin America
9.3.3. Europe
9.3.4. Asia Pacific
9.3.5. MEA
9.4. Market Attractiveness Analysis By Region
10. North America Moveable Water Tap Market Analysis 2016-2021 and Forecast 2022-2032, By Country
10.1. Historical Market Size Value (US$ Mn) & Volume (Units) Trend Analysis By Market Taxonomy, 2016-2021
10.2. Market Size Value (US$ Mn) & Volume (Units) Forecast By Market Taxonomy, 2022-2032
10.2.1. By Country
10.2.1.1. U.S.
10.2.1.2. Canada
10.2.2. By End-User
10.2.3. By Material
10.2.4. By Application
10.2.5. By Distribution Channels
10.3. Market Attractiveness Analysis
10.3.1. By Country
10.3.2. By End-User
10.3.3. By Material
10.3.4. By Application
10.3.5. By Distribution Channels
10.4. Key Takeaways
11. Latin America Moveable Water Tap Market Analysis 2016-2021 and Forecast 2022-2032, By Country
11.1. Historical Market Size Value (US$ Mn) & Volume (Units) Trend Analysis By Market Taxonomy, 2016-2021
11.2. Market Size Value (US$ Mn) & Volume (Units) Forecast By Market Taxonomy, 2022-2032
11.2.1. By Country
11.2.1.1. Brazil
11.2.1.2. Mexico
11.2.1.3. Rest of Latin America
11.2.2. By End-User
11.2.3. By Material
11.2.4. By Application
11.2.5. By Distribution Channels
11.3. Market Attractiveness Analysis
11.3.1. By Country
11.3.2. By End-User
11.3.3. By Material
11.3.4. By Application
11.3.5. By Distribution Channels
11.4. Key Takeaways
12. Europe Moveable Water Tap Market Analysis 2016-2021 and Forecast 2022-2032, By Country
12.1. Historical Market Size Value (US$ Mn) & Volume (Units) Trend Analysis By Market Taxonomy, 2016-2021
12.2. Market Size Value (US$ Mn) & Volume (Units) Forecast By Market Taxonomy, 2022-2032
12.2.1. By Country
12.2.1.1. Germany
12.2.1.2. U.K.
12.2.1.3. France
12.2.1.4. Spain
12.2.1.5. Italy
12.2.1.6. Rest of Europe
12.2.2. By End-User
12.2.3. By Material
12.2.4. By Application
12.2.5. By Distribution Channels
12.3. Market Attractiveness Analysis
12.3.1. By Country
12.3.2. By End-User
12.3.3. By Material
12.3.4. By Application
12.3.5. By Distribution Channels
12.4. Key Takeaways
13. Asia Pacific Moveable Water Tap Market Analysis 2016-2021 and Forecast 2022-2032, By Country
13.1. Historical Market Size Value (US$ Mn) & Volume (Units) Trend Analysis By Market Taxonomy, 2016-2021
13.2. Market Size Value (US$ Mn) & Volume (Units) Forecast By Market Taxonomy, 2022-2032
13.2.1. By Country
13.2.1.1. China
13.2.1.2. Japan
13.2.1.3. South Korea
13.2.1.4. Singapore
13.2.1.5. Thailand
13.2.1.6. Indonesia
13.2.1.7. Australia
13.2.1.8. New Zealand
13.2.1.9. Rest of Asia Pacific
13.2.2. By End-User
13.2.3. By Material
13.2.4. By Application
13.2.5. By Distribution Channels
13.3. Market Attractiveness Analysis
13.3.1. By Country
13.3.2. By End-User
13.3.3. By Material
13.3.4. By Application
13.3.5. By Distribution Channels
13.4. Key Takeaways
14. MEA Moveable Water Tap Market Analysis 2016-2021 and Forecast 2022-2032, By Country
14.1. Historical Market Size Value (US$ Mn) & Volume (Units) Trend Analysis By Market Taxonomy, 2016-2021
14.2. Market Size Value (US$ Mn) & Volume (Units) Forecast By Market Taxonomy, 2022-2032
14.2.1. By Country
14.2.1.1. GCC Countries
14.2.1.2. South Africa
14.2.1.3. Israel
14.2.1.4. Rest of MEA
14.2.2. By End-User
14.2.3. By Material
14.2.4. By Application
14.2.5. By Distribution Channels
14.3. Market Attractiveness Analysis
14.3.1. By Country
14.3.2. By End-User
14.3.3. By Material
14.3.4. By Application
14.3.5. By Distribution Channels
14.4. Key Takeaways
15. Key Countries Moveable Water Tap Market Analysis
15.1. U.S.
15.1.1. Pricing Analysis
15.1.2. Market Share Analysis, 2021
15.1.2.1. By End-User
15.1.2.2. By Material
15.1.2.3. By Application
15.1.2.4. By Distribution Channels
15.2. Canada
15.2.1. Pricing Analysis
15.2.2. Market Share Analysis, 2021
15.2.2.1. By End-User
15.2.2.2. By Material
15.2.2.3. By Application
15.2.2.4. By Distribution Channels
15.3. Brazil
15.3.1. Pricing Analysis
15.3.2. Market Share Analysis, 2021
15.3.2.1. By End-User
15.3.2.2. By Material
15.3.2.3. By Application
15.3.2.4. By Distribution Channels
15.4. Mexico
15.4.1. Pricing Analysis
15.4.2. Market Share Analysis, 2021
15.4.2.1. By End-User
15.4.2.2. By Material
15.4.2.3. By Application
15.4.2.4. By Distribution Channels
15.5. Germany
15.5.1. Pricing Analysis
15.5.2. Market Share Analysis, 2021
15.5.2.1. By End-User
15.5.2.2. By Material
15.5.2.3. By Application
15.5.2.4. By Distribution Channels
15.6. U.K.
15.6.1. Pricing Analysis
15.6.2. Market Share Analysis, 2021
15.6.2.1. By End-User
15.6.2.2. By Material
15.6.2.3. By Application
15.6.2.4. By Distribution Channels
15.7. France
15.7.1. Pricing Analysis
15.7.2. Market Share Analysis, 2021
15.7.2.1. By End-User
15.7.2.2. By Material
15.7.2.3. By Application
15.7.2.4. By Distribution Channels
15.8. Spain
15.8.1. Pricing Analysis
15.8.2. Market Share Analysis, 2021
15.8.2.1. By End-User
15.8.2.2. By Material
15.8.2.3. By Application
15.8.2.4. By Distribution Channels
15.9. Italy
15.9.1. Pricing Analysis
15.9.2. Market Share Analysis, 2021
15.9.2.1. By End-User
15.9.2.2. By Material
15.9.2.3. By Application
15.9.2.4. By Distribution Channels
15.10. China
15.10.1. Pricing Analysis
15.10.2. Market Share Analysis, 2021
15.10.2.1. By End-User
15.10.2.2. By Material
15.10.2.3. By Application
15.10.2.4. By Distribution Channels
15.11. Japan
15.11.1. Pricing Analysis
15.11.2. Market Share Analysis, 2021
15.11.2.1. By End-User
15.11.2.2. By Material
15.11.2.3. By Application
15.11.2.4. By Distribution Channels
15.12. South Korea
15.12.1. Pricing Analysis
15.12.2. Market Share Analysis, 2021
15.12.2.1. By End-User
15.12.2.2. By Material
15.12.2.3. By Application
15.12.2.4. By Distribution Channels
15.13. Singapore
15.13.1. Pricing Analysis
15.13.2. Market Share Analysis, 2021
15.13.2.1. By End-User
15.13.2.2. By Material
15.13.2.3. By Application
15.13.2.4. By Distribution Channels
15.14. Thailand
15.14.1. Pricing Analysis
15.14.2. Market Share Analysis, 2021
15.14.2.1. By End-User
15.14.2.2. By Material
15.14.2.3. By Application
15.14.2.4. By Distribution Channels
15.15. Indonesia
15.15.1. Pricing Analysis
15.15.2. Market Share Analysis, 2021
15.15.2.1. By End-User
15.15.2.2. By Material
15.15.2.3. By Application
15.15.2.4. By Distribution Channels
15.16. Australia
15.16.1. Pricing Analysis
15.16.2. Market Share Analysis, 2021
15.16.2.1. By End-User
15.16.2.2. By Material
15.16.2.3. By Application
15.16.2.4. By Distribution Channels
15.17. New Zealand
15.17.1. Pricing Analysis
15.17.2. Market Share Analysis, 2021
15.17.2.1. By End-User
15.17.2.2. By Material
15.17.2.3. By Application
15.17.2.4. By Distribution Channels
15.18. GCC Countries
15.18.1. Pricing Analysis
15.18.2. Market Share Analysis, 2021
15.18.2.1. By End-User
15.18.2.2. By Material
15.18.2.3. By Application
15.18.2.4. By Distribution Channels
15.19. South Africa
15.19.1. Pricing Analysis
15.19.2. Market Share Analysis, 2021
15.19.2.1. By End-User
15.19.2.2. By Material
15.19.2.3. By Application
15.19.2.4. By Distribution Channels
15.20. Israel
15.20.1. Pricing Analysis
15.20.2. Market Share Analysis, 2021
15.20.2.1. By End-User
15.20.2.2. By Material
15.20.2.3. By Application
15.20.2.4. By Distribution Channels
16. Market Structure Analysis
16.1. Competition Dashboard
16.2. Competition Benchmarking
16.3. Market Share Analysis of Top Players
16.3.1. By Regional
16.3.2. By End-User
16.3.3. By Material
16.3.4. By Application
16.3.5. By Distribution Channels
17. Competition Analysis
17.1. Competition Deep Dive
17.1.1. Franke Home Solutions
17.1.1.1. Overview
17.1.1.2. Product Portfolio
17.1.1.3. Profitability by Market Segments
17.1.1.4. Sales Footprint
17.1.1.5. Strategy Overview
17.1.1.5.1. Marketing Strategy
17.1.1.5.2. Product Strategy
17.1.1.5.3. Channel Strategy
17.1.2. Kohler Co.
17.1.2.1. Overview
17.1.2.2. Product Portfolio
17.1.2.3. Profitability by Market Segments
17.1.2.4. Sales Footprint
17.1.2.5. Strategy Overview
17.1.2.5.1. Marketing Strategy
17.1.2.5.2. Product Strategy
17.1.2.5.3. Channel Strategy
17.1.3. Gerber Plumbing Fixtures LLC
17.1.3.1. Overview
17.1.3.2. Product Portfolio
17.1.3.3. Profitability by Market Segments
17.1.3.4. Sales Footprint
17.1.3.5. Strategy Overview
17.1.3.5.1. Marketing Strategy
17.1.3.5.2. Product Strategy
17.1.3.5.3. Channel Strategy
17.1.4. DELTA FAUCET COMPANY
17.1.4.1. Overview
17.1.4.2. Product Portfolio
17.1.4.3. Profitability by Market Segments
17.1.4.4. Sales Footprint
17.1.4.5. Strategy Overview
17.1.4.5.1. Marketing Strategy
17.1.4.5.2. Product Strategy
17.1.4.5.3. Channel Strategy
17.1.5. Meon Incorporated
17.1.5.1. Overview
17.1.5.2. Product Portfolio
17.1.5.3. Profitability by Market Segments
17.1.5.4. Sales Footprint
17.1.5.5. Strategy Overview
17.1.5.5.1. Marketing Strategy
17.1.5.5.2. Product Strategy
17.1.5.5.3. Channel Strategy
17.1.6. Quooker Hong Kong Ltd
17.1.6.1. Overview
17.1.6.2. Product Portfolio
17.1.6.3. Profitability by Market Segments
17.1.6.4. Sales Footprint
17.1.6.5. Strategy Overview
17.1.6.5.1. Marketing Strategy
17.1.6.5.2. Product Strategy
17.1.6.5.3. Channel Strategy
17.1.7. GROHE
17.1.7.1. Overview
17.1.7.2. Product Portfolio
17.1.7.3. Profitability by Market Segments
17.1.7.4. Sales Footprint
17.1.7.5. Strategy Overview
17.1.7.5.1. Marketing Strategy
17.1.7.5.2. Product Strategy
17.1.7.5.3. Channel Strategy
17.1.8. LIXIL Corporation
17.1.8.1. Overview
17.1.8.2. Product Portfolio
17.1.8.3. Profitability by Market Segments
17.1.8.4. Sales Footprint
17.1.8.5. Strategy Overview
17.1.8.5.1. Marketing Strategy
17.1.8.5.2. Product Strategy
17.1.8.5.3. Channel Strategy
17.1.9. Gokul Poly Valves PVT. LTD.
17.1.9.1. Overview
17.1.9.2. Product Portfolio
17.1.9.3. Profitability by Market Segments
17.1.9.4. Sales Footprint
17.1.9.5. Strategy Overview
17.1.9.5.1. Marketing Strategy
17.1.9.5.2. Product Strategy
17.1.9.5.3. Channel Strategy
17.1.10. Waterman
17.1.10.1. Overview
17.1.10.2. Product Portfolio
17.1.10.3. Profitability by Market Segments
17.1.10.4. Sales Footprint
17.1.10.5. Strategy Overview
17.1.10.5.1. Marketing Strategy
17.1.10.5.2. Product Strategy
17.1.10.5.3. Channel Strategy
18. Assumptions & Acronyms Used
19. Research Methodology
Let us know your requirement to get
100% FREE customization
List of Tables
Table 01: Global Moveable Water Tap Market Value (US$ Mn) Forecast by Region, 2016-2032
Table 02: Global Moveable Water Tap Market Volume (Units) Forecast by Region, 2016-2032
Table 03: Global Moveable Water Tap Market Value (US$ Mn) Forecast by End-User, 2016-2032
Table 04: Global Moveable Water Tap Market Volume (Units) Forecast by End-User, 2016-2032
Table 05: Global Moveable Water Tap Market Value (US$ Mn) Forecast by Material, 2016-2032
Table 06: Global Moveable Water Tap Market Volume (Units) Forecast by Material, 2016-2032
Table 07: Global Moveable Water Tap Market Value (US$ Mn) Forecast by Application, 2016-2032
Table 08: Global Moveable Water Tap Market Volume (Units) Forecast by Application, 2016-2032
Table 09: Global Moveable Water Tap Market Value (US$ Mn) Forecast by Distribution Channels, 2016-2032
Table 10: Global Moveable Water Tap Market Volume (Units) Forecast by Distribution Channels, 2016-2032
Table 11: North America Moveable Water Tap Market Value (US$ Mn) Forecast by Country, 2016-2032
Table 12: North America Moveable Water Tap Market Volume (Units) Forecast by Country, 2016-2032
Table 13: North America Moveable Water Tap Market Value (US$ Mn) Forecast by End-User, 2016-2032
Table 14: North America Moveable Water Tap Market Volume (Units) Forecast by End-User, 2016-2032
Table 15: North America Moveable Water Tap Market Value (US$ Mn) Forecast by Material, 2016-2032
Table 16: North America Moveable Water Tap Market Volume (Units) Forecast by Material, 2016-2032
Table 17: North America Moveable Water Tap Market Value (US$ Mn) Forecast by Application, 2016-2032
Table 18: North America Moveable Water Tap Market Volume (Units) Forecast by Application, 2016-2032
Table 19: North America Moveable Water Tap Market Value (US$ Mn) Forecast by Distribution Channels, 2016-2032
Table 20: North America Moveable Water Tap Market Volume (Units) Forecast by Distribution Channels, 2016-2032
Table 21: Latin America Moveable Water Tap Market Value (US$ Mn) Forecast by Country, 2016-2032
Table 22: Latin America Moveable Water Tap Market Volume (Units) Forecast by Country, 2016-2032
Table 23: Latin America Moveable Water Tap Market Value (US$ Mn) Forecast by End-User, 2016-2032
Table 24: Latin America Moveable Water Tap Market Volume (Units) Forecast by End-User, 2016-2032
Table 25: Latin America Moveable Water Tap Market Value (US$ Mn) Forecast by Material, 2016-2032
Table 26: Latin America Moveable Water Tap Market Volume (Units) Forecast by Material, 2016-2032
Table 27: Latin America Moveable Water Tap Market Value (US$ Mn) Forecast by Application, 2016-2032
Table 28: Latin America Moveable Water Tap Market Volume (Units) Forecast by Application, 2016-2032
Table 29: Latin America Moveable Water Tap Market Value (US$ Mn) Forecast by Distribution Channels, 2016-2032
Table 30: Latin America Moveable Water Tap Market Volume (Units) Forecast by Distribution Channels, 2016-2032
Table 31: Europe Moveable Water Tap Market Value (US$ Mn) Forecast by Country, 2016-2032
Table 32: Europe Moveable Water Tap Market Volume (Units) Forecast by Country, 2016-2032
Table 33: Europe Moveable Water Tap Market Value (US$ Mn) Forecast by End-User, 2016-2032
Table 34: Europe Moveable Water Tap Market Volume (Units) Forecast by End-User, 2016-2032
Table 35: Europe Moveable Water Tap Market Value (US$ Mn) Forecast by Material, 2016-2032
Table 36: Europe Moveable Water Tap Market Volume (Units) Forecast by Material, 2016-2032
Table 37: Europe Moveable Water Tap Market Value (US$ Mn) Forecast by Application, 2016-2032
Table 38: Europe Moveable Water Tap Market Volume (Units) Forecast by Application, 2016-2032
Table 39: Europe Moveable Water Tap Market Value (US$ Mn) Forecast by Distribution Channels, 2016-2032
Table 40: Europe Moveable Water Tap Market Volume (Units) Forecast by Distribution Channels, 2016-2032
Table 41: Asia Pacific Moveable Water Tap Market Value (US$ Mn) Forecast by Country, 2016-2032
Table 42: Asia Pacific Moveable Water Tap Market Volume (Units) Forecast by Country, 2016-2032
Table 43: Asia Pacific Moveable Water Tap Market Value (US$ Mn) Forecast by End-User, 2016-2032
Table 44: Asia Pacific Moveable Water Tap Market Volume (Units) Forecast by End-User, 2016-2032
Table 45: Asia Pacific Moveable Water Tap Market Value (US$ Mn) Forecast by Material, 2016-2032
Table 46: Asia Pacific Moveable Water Tap Market Volume (Units) Forecast by Material, 2016-2032
Table 47: Asia Pacific Moveable Water Tap Market Value (US$ Mn) Forecast by Application, 2016-2032
Table 48: Asia Pacific Moveable Water Tap Market Volume (Units) Forecast by Application, 2016-2032
Table 49: Asia Pacific Moveable Water Tap Market Value (US$ Mn) Forecast by Distribution Channels, 2016-2032
Table 50: Asia Pacific Moveable Water Tap Market Volume (Units) Forecast by Distribution Channels, 2016-2032
Table 51: MEA Moveable Water Tap Market Value (US$ Mn) Forecast by Country, 2016-2032
Table 52: MEA Moveable Water Tap Market Volume (Units) Forecast by Country, 2016-2032
Table 53: MEA Moveable Water Tap Market Value (US$ Mn) Forecast by End-User, 2016-2032
Table 54: MEA Moveable Water Tap Market Volume (Units) Forecast by End-User, 2016-2032
Table 55: MEA Moveable Water Tap Market Value (US$ Mn) Forecast by Material, 2016-2032
Table 56: MEA Moveable Water Tap Market Volume (Units) Forecast by Material, 2016-2032
Table 57: MEA Moveable Water Tap Market Value (US$ Mn) Forecast by Application, 2016-2032
Table 58: MEA Moveable Water Tap Market Volume (Units) Forecast by Application, 2016-2032
Table 59: MEA Moveable Water Tap Market Value (US$ Mn) Forecast by Distribution Channels, 2016-2032
Table 60: MEA Moveable Water Tap Market Volume (Units) Forecast by Distribution Channels, 2016-2032
Find your sweet spots for generating winning opportunities in this market.
Talk to AnalystList of Charts
Figure 01: Global Moveable Water Tap Market Value (US$ Mn) by End-User, 2022-2032
Figure 02: Global Moveable Water Tap Market Value (US$ Mn) by Material, 2022-2032
Figure 03: Global Moveable Water Tap Market Value (US$ Mn) by Application, 2022-2032
Figure 04: Global Moveable Water Tap Market Value (US$ Mn) by Distribution Channels, 2022-2032
Figure 05: Global Moveable Water Tap Market Value (US$ Mn) by Region, 2022-2032
Figure 06: Global Moveable Water Tap Market Value (US$ Mn) Analysis by Region, 2016-2032
Figure 07: Global Moveable Water Tap Market Volume (Units) Analysis by Region, 2016-2032
Figure 08: Global Moveable Water Tap Market Value Share (%) and BPS Analysis by Region, 2022-2032
Figure 09: Global Moveable Water Tap Market Y-o-Y Growth (%) Projections by Region, 2022-2032
Figure 10: Global Moveable Water Tap Market Value (US$ Mn) Analysis by End-User, 2016-2032
Figure 11: Global Moveable Water Tap Market Volume (Units) Analysis by End-User, 2016-2032
Figure 12: Global Moveable Water Tap Market Value Share (%) and BPS Analysis by End-User, 2022-2032
Figure 13: Global Moveable Water Tap Market Y-o-Y Growth (%) Projections by End-User, 2022-2032
Figure 14: Global Moveable Water Tap Market Value (US$ Mn) Analysis by Material, 2016-2032
Figure 15: Global Moveable Water Tap Market Volume (Units) Analysis by Material, 2016-2032
Figure 16: Global Moveable Water Tap Market Value Share (%) and BPS Analysis by Material, 2022-2032
Figure 17: Global Moveable Water Tap Market Y-o-Y Growth (%) Projections by Material, 2022-2032
Figure 18: Global Moveable Water Tap Market Value (US$ Mn) Analysis by Application, 2016-2032
Figure 19: Global Moveable Water Tap Market Volume (Units) Analysis by Application, 2016-2032
Figure 20: Global Moveable Water Tap Market Value Share (%) and BPS Analysis by Application, 2022-2032
Figure 21: Global Moveable Water Tap Market Y-o-Y Growth (%) Projections by Application, 2022-2032
Figure 22: Global Moveable Water Tap Market Value (US$ Mn) Analysis by Distribution Channels, 2016-2032
Figure 23: Global Moveable Water Tap Market Volume (Units) Analysis by Distribution Channels, 2016-2032
Figure 24: Global Moveable Water Tap Market Value Share (%) and BPS Analysis by Distribution Channels, 2022-2032
Figure 25: Global Moveable Water Tap Market Y-o-Y Growth (%) Projections by Distribution Channels, 2022-2032
Figure 26: Global Moveable Water Tap Market Attractiveness by End-User, 2022-2032
Figure 27: Global Moveable Water Tap Market Attractiveness by Material, 2022-2032
Figure 28: Global Moveable Water Tap Market Attractiveness by Application, 2022-2032
Figure 29: Global Moveable Water Tap Market Attractiveness by Distribution Channels, 2022-2032
Figure 30: Global Moveable Water Tap Market Attractiveness by Region, 2022-2032
Figure 31: North America Moveable Water Tap Market Value (US$ Mn) by End-User, 2022-2032
Figure 32: North America Moveable Water Tap Market Value (US$ Mn) by Material, 2022-2032
Figure 33: North America Moveable Water Tap Market Value (US$ Mn) by Application, 2022-2032
Figure 34: North America Moveable Water Tap Market Value (US$ Mn) by Distribution Channels, 2022-2032
Figure 35: North America Moveable Water Tap Market Value (US$ Mn) by Country, 2022-2032
Figure 36: North America Moveable Water Tap Market Value (US$ Mn) Analysis by Country, 2016-2032
Figure 37: North America Moveable Water Tap Market Volume (Units) Analysis by Country, 2016-2032
Figure 38: North America Moveable Water Tap Market Value Share (%) and BPS Analysis by Country, 2022-2032
Figure 39: North America Moveable Water Tap Market Y-o-Y Growth (%) Projections by Country, 2022-2032
Figure 40: North America Moveable Water Tap Market Value (US$ Mn) Analysis by End-User, 2016-2032
Figure 41: North America Moveable Water Tap Market Volume (Units) Analysis by End-User, 2016-2032
Figure 42: North America Moveable Water Tap Market Value Share (%) and BPS Analysis by End-User, 2022-2032
Figure 43: North America Moveable Water Tap Market Y-o-Y Growth (%) Projections by End-User, 2022-2032
Figure 44: North America Moveable Water Tap Market Value (US$ Mn) Analysis by Material, 2016-2032
Figure 45: North America Moveable Water Tap Market Volume (Units) Analysis by Material, 2016-2032
Figure 46: North America Moveable Water Tap Market Value Share (%) and BPS Analysis by Material, 2022-2032
Figure 47: North America Moveable Water Tap Market Y-o-Y Growth (%) Projections by Material, 2022-2032
Figure 48: North America Moveable Water Tap Market Value (US$ Mn) Analysis by Application, 2016-2032
Figure 49: North America Moveable Water Tap Market Volume (Units) Analysis by Application, 2016-2032
Figure 50: North America Moveable Water Tap Market Value Share (%) and BPS Analysis by Application, 2022-2032
Figure 51: North America Moveable Water Tap Market Y-o-Y Growth (%) Projections by Application, 2022-2032
Figure 52: North America Moveable Water Tap Market Value (US$ Mn) Analysis by Distribution Channels, 2016-2032
Figure 53: North America Moveable Water Tap Market Volume (Units) Analysis by Distribution Channels, 2016-2032
Figure 54: North America Moveable Water Tap Market Value Share (%) and BPS Analysis by Distribution Channels, 2022-2032
Figure 55: North America Moveable Water Tap Market Y-o-Y Growth (%) Projections by Distribution Channels, 2022-2032
Figure 56: North America Moveable Water Tap Market Attractiveness by End-User, 2022-2032
Figure 57: North America Moveable Water Tap Market Attractiveness by Material, 2022-2032
Figure 58: North America Moveable Water Tap Market Attractiveness by Application, 2022-2032
Figure 59: North America Moveable Water Tap Market Attractiveness by Distribution Channels, 2022-2032
Figure 60: North America Moveable Water Tap Market Attractiveness by Country, 2022-2032
Figure 61: Latin America Moveable Water Tap Market Value (US$ Mn) by End-User, 2022-2032
Figure 62: Latin America Moveable Water Tap Market Value (US$ Mn) by Material, 2022-2032
Figure 63: Latin America Moveable Water Tap Market Value (US$ Mn) by Application, 2022-2032
Figure 64: Latin America Moveable Water Tap Market Value (US$ Mn) by Distribution Channels, 2022-2032
Figure 65: Latin America Moveable Water Tap Market Value (US$ Mn) by Country, 2022-2032
Figure 66: Latin America Moveable Water Tap Market Value (US$ Mn) Analysis by Country, 2016-2032
Figure 67: Latin America Moveable Water Tap Market Volume (Units) Analysis by Country, 2016-2032
Figure 68: Latin America Moveable Water Tap Market Value Share (%) and BPS Analysis by Country, 2022-2032
Figure 69: Latin America Moveable Water Tap Market Y-o-Y Growth (%) Projections by Country, 2022-2032
Figure 70: Latin America Moveable Water Tap Market Value (US$ Mn) Analysis by End-User, 2016-2032
Figure 71: Latin America Moveable Water Tap Market Volume (Units) Analysis by End-User, 2016-2032
Figure 72: Latin America Moveable Water Tap Market Value Share (%) and BPS Analysis by End-User, 2022-2032
Figure 73: Latin America Moveable Water Tap Market Y-o-Y Growth (%) Projections by End-User, 2022-2032
Figure 74: Latin America Moveable Water Tap Market Value (US$ Mn) Analysis by Material, 2016-2032
Figure 75: Latin America Moveable Water Tap Market Volume (Units) Analysis by Material, 2016-2032
Figure 76: Latin America Moveable Water Tap Market Value Share (%) and BPS Analysis by Material, 2022-2032
Figure 77: Latin America Moveable Water Tap Market Y-o-Y Growth (%) Projections by Material, 2022-2032
Figure 78: Latin America Moveable Water Tap Market Value (US$ Mn) Analysis by Application, 2016-2032
Figure 79: Latin America Moveable Water Tap Market Volume (Units) Analysis by Application, 2016-2032
Figure 80: Latin America Moveable Water Tap Market Value Share (%) and BPS Analysis by Application, 2022-2032
Figure 81: Latin America Moveable Water Tap Market Y-o-Y Growth (%) Projections by Application, 2022-2032
Figure 82: Latin America Moveable Water Tap Market Value (US$ Mn) Analysis by Distribution Channels, 2016-2032
Figure 83: Latin America Moveable Water Tap Market Volume (Units) Analysis by Distribution Channels, 2016-2032
Figure 84: Latin America Moveable Water Tap Market Value Share (%) and BPS Analysis by Distribution Channels, 2022-2032
Figure 85: Latin America Moveable Water Tap Market Y-o-Y Growth (%) Projections by Distribution Channels, 2022-2032
Figure 86: Latin America Moveable Water Tap Market Attractiveness by End-User, 2022-2032
Figure 87: Latin America Moveable Water Tap Market Attractiveness by Material, 2022-2032
Figure 88: Latin America Moveable Water Tap Market Attractiveness by Application, 2022-2032
Figure 89: Latin America Moveable Water Tap Market Attractiveness by Distribution Channels, 2022-2032
Figure 90: Latin America Moveable Water Tap Market Attractiveness by Country, 2022-2032
Figure 91: Europe Moveable Water Tap Market Value (US$ Mn) by End-User, 2022-2032
Figure 92: Europe Moveable Water Tap Market Value (US$ Mn) by Material, 2022-2032
Figure 93: Europe Moveable Water Tap Market Value (US$ Mn) by Application, 2022-2032
Figure 94: Europe Moveable Water Tap Market Value (US$ Mn) by Distribution Channels, 2022-2032
Figure 95: Europe Moveable Water Tap Market Value (US$ Mn) by Country, 2022-2032
Figure 96: Europe Moveable Water Tap Market Value (US$ Mn) Analysis by Country, 2016-2032
Figure 97: Europe Moveable Water Tap Market Volume (Units) Analysis by Country, 2016-2032
Figure 98: Europe Moveable Water Tap Market Value Share (%) and BPS Analysis by Country, 2022-2032
Figure 99: Europe Moveable Water Tap Market Y-o-Y Growth (%) Projections by Country, 2022-2032
Figure 100: Europe Moveable Water Tap Market Value (US$ Mn) Analysis by End-User, 2016-2032
Figure 101: Europe Moveable Water Tap Market Volume (Units) Analysis by End-User, 2016-2032
Figure 102: Europe Moveable Water Tap Market Value Share (%) and BPS Analysis by End-User, 2022-2032
Figure 103: Europe Moveable Water Tap Market Y-o-Y Growth (%) Projections by End-User, 2022-2032
Figure 104: Europe Moveable Water Tap Market Value (US$ Mn) Analysis by Material, 2016-2032
Figure 105: Europe Moveable Water Tap Market Volume (Units) Analysis by Material, 2016-2032
Figure 106: Europe Moveable Water Tap Market Value Share (%) and BPS Analysis by Material, 2022-2032
Figure 107: Europe Moveable Water Tap Market Y-o-Y Growth (%) Projections by Material, 2022-2032
Figure 108: Europe Moveable Water Tap Market Value (US$ Mn) Analysis by Application, 2016-2032
Figure 109: Europe Moveable Water Tap Market Volume (Units) Analysis by Application, 2016-2032
Figure 110: Europe Moveable Water Tap Market Value Share (%) and BPS Analysis by Application, 2022-2032
Figure 111: Europe Moveable Water Tap Market Y-o-Y Growth (%) Projections by Application, 2022-2032
Figure 112: Europe Moveable Water Tap Market Value (US$ Mn) Analysis by Distribution Channels, 2016-2032
Figure 113: Europe Moveable Water Tap Market Volume (Units) Analysis by Distribution Channels, 2016-2032
Figure 114: Europe Moveable Water Tap Market Value Share (%) and BPS Analysis by Distribution Channels, 2022-2032
Figure 115: Europe Moveable Water Tap Market Y-o-Y Growth (%) Projections by Distribution Channels, 2022-2032
Figure 116: Europe Moveable Water Tap Market Attractiveness by End-User, 2022-2032
Figure 117: Europe Moveable Water Tap Market Attractiveness by Material, 2022-2032
Figure 118: Europe Moveable Water Tap Market Attractiveness by Application, 2022-2032
Figure 119: Europe Moveable Water Tap Market Attractiveness by Distribution Channels, 2022-2032
Figure 120: Europe Moveable Water Tap Market Attractiveness by Country, 2022-2032
Figure 121: Asia Pacific Moveable Water Tap Market Value (US$ Mn) by End-User, 2022-2032
Figure 122: Asia Pacific Moveable Water Tap Market Value (US$ Mn) by Material, 2022-2032
Figure 123: Asia Pacific Moveable Water Tap Market Value (US$ Mn) by Application, 2022-2032
Figure 124: Asia Pacific Moveable Water Tap Market Value (US$ Mn) by Distribution Channels, 2022-2032
Figure 125: Asia Pacific Moveable Water Tap Market Value (US$ Mn) by Country, 2022-2032
Figure 126: Asia Pacific Moveable Water Tap Market Value (US$ Mn) Analysis by Country, 2016-2032
Figure 127: Asia Pacific Moveable Water Tap Market Volume (Units) Analysis by Country, 2016-2032
Figure 128: Asia Pacific Moveable Water Tap Market Value Share (%) and BPS Analysis by Country, 2022-2032
Figure 129: Asia Pacific Moveable Water Tap Market Y-o-Y Growth (%) Projections by Country, 2022-2032
Figure 130: Asia Pacific Moveable Water Tap Market Value (US$ Mn) Analysis by End-User, 2016-2032
Figure 131: Asia Pacific Moveable Water Tap Market Volume (Units) Analysis by End-User, 2016-2032
Figure 132: Asia Pacific Moveable Water Tap Market Value Share (%) and BPS Analysis by End-User, 2022-2032
Figure 133: Asia Pacific Moveable Water Tap Market Y-o-Y Growth (%) Projections by End-User, 2022-2032
Figure 134: Asia Pacific Moveable Water Tap Market Value (US$ Mn) Analysis by Material, 2016-2032
Figure 135: Asia Pacific Moveable Water Tap Market Volume (Units) Analysis by Material, 2016-2032
Figure 136: Asia Pacific Moveable Water Tap Market Value Share (%) and BPS Analysis by Material, 2022-2032
Figure 137: Asia Pacific Moveable Water Tap Market Y-o-Y Growth (%) Projections by Material, 2022-2032
Figure 138: Asia Pacific Moveable Water Tap Market Value (US$ Mn) Analysis by Application, 2016-2032
Figure 139: Asia Pacific Moveable Water Tap Market Volume (Units) Analysis by Application, 2016-2032
Figure 140: Asia Pacific Moveable Water Tap Market Value Share (%) and BPS Analysis by Application, 2022-2032
Figure 141: Asia Pacific Moveable Water Tap Market Y-o-Y Growth (%) Projections by Application, 2022-2032
Figure 142: Asia Pacific Moveable Water Tap Market Value (US$ Mn) Analysis by Distribution Channels, 2016-2032
Figure 143: Asia Pacific Moveable Water Tap Market Volume (Units) Analysis by Distribution Channels, 2016-2032
Figure 144: Asia Pacific Moveable Water Tap Market Value Share (%) and BPS Analysis by Distribution Channels, 2022-2032
Figure 145: Asia Pacific Moveable Water Tap Market Y-o-Y Growth (%) Projections by Distribution Channels, 2022-2032
Figure 146: Asia Pacific Moveable Water Tap Market Attractiveness by End-User, 2022-2032
Figure 147: Asia Pacific Moveable Water Tap Market Attractiveness by Material, 2022-2032
Figure 148: Asia Pacific Moveable Water Tap Market Attractiveness by Application, 2022-2032
Figure 149: Asia Pacific Moveable Water Tap Market Attractiveness by Distribution Channels, 2022-2032
Figure 150: Asia Pacific Moveable Water Tap Market Attractiveness by Country, 2022-2032
Figure 151: MEA Moveable Water Tap Market Value (US$ Mn) by End-User, 2022-2032
Figure 152: MEA Moveable Water Tap Market Value (US$ Mn) by Material, 2022-2032
Figure 153: MEA Moveable Water Tap Market Value (US$ Mn) by Application, 2022-2032
Figure 154: MEA Moveable Water Tap Market Value (US$ Mn) by Distribution Channels, 2022-2032
Figure 155: MEA Moveable Water Tap Market Value (US$ Mn) by Country, 2022-2032
Figure 156: MEA Moveable Water Tap Market Value (US$ Mn) Analysis by Country, 2016-2032
Figure 157: MEA Moveable Water Tap Market Volume (Units) Analysis by Country, 2016-2032
Figure 158: MEA Moveable Water Tap Market Value Share (%) and BPS Analysis by Country, 2022-2032
Figure 159: MEA Moveable Water Tap Market Y-o-Y Growth (%) Projections by Country, 2022-2032
Figure 160: MEA Moveable Water Tap Market Value (US$ Mn) Analysis by End-User, 2016-2032
Figure 161: MEA Moveable Water Tap Market Volume (Units) Analysis by End-User, 2016-2032
Figure 162: MEA Moveable Water Tap Market Value Share (%) and BPS Analysis by End-User, 2022-2032
Figure 163: MEA Moveable Water Tap Market Y-o-Y Growth (%) Projections by End-User, 2022-2032
Figure 164: MEA Moveable Water Tap Market Value (US$ Mn) Analysis by Material, 2016-2032
Figure 165: MEA Moveable Water Tap Market Volume (Units) Analysis by Material, 2016-2032
Figure 166: MEA Moveable Water Tap Market Value Share (%) and BPS Analysis by Material, 2022-2032
Figure 167: MEA Moveable Water Tap Market Y-o-Y Growth (%) Projections by Material, 2022-2032
Figure 168: MEA Moveable Water Tap Market Value (US$ Mn) Analysis by Application, 2016-2032
Figure 169: MEA Moveable Water Tap Market Volume (Units) Analysis by Application, 2016-2032
Figure 170: MEA Moveable Water Tap Market Value Share (%) and BPS Analysis by Application, 2022-2032
Figure 171: MEA Moveable Water Tap Market Y-o-Y Growth (%) Projections by Application, 2022-2032
Figure 172: MEA Moveable Water Tap Market Value (US$ Mn) Analysis by Distribution Channels, 2016-2032
Figure 173: MEA Moveable Water Tap Market Volume (Units) Analysis by Distribution Channels, 2016-2032
Figure 174: MEA Moveable Water Tap Market Value Share (%) and BPS Analysis by Distribution Channels, 2022-2032
Figure 175: MEA Moveable Water Tap Market Y-o-Y Growth (%) Projections by Distribution Channels, 2022-2032
Figure 176: MEA Moveable Water Tap Market Attractiveness by End-User, 2022-2032
Figure 177: MEA Moveable Water Tap Market Attractiveness by Material, 2022-2032
Figure 178: MEA Moveable Water Tap Market Attractiveness by Application, 2022-2032
Figure 179: MEA Moveable Water Tap Market Attractiveness by Distribution Channels, 2022-2032
Figure 180: MEA Moveable Water Tap Market Attractiveness by Country, 2022-2032
Need specific information?
Request CustomizationExplore Consumer Product Insights
View Reports