Nitinol Heart Valve Frames Market Size and Share Forecast Outlook 2025 to 2035

The nitinol heart valve frames market is expected to record a valuation of USD 756.3 million in 2025 and USD 1,174.5 million in 2035, with reflecting a growth of USD 418.2 million across the ten-year span. The overall expansion represents a CAGR of 4.5% and 1.77X increase in market size.
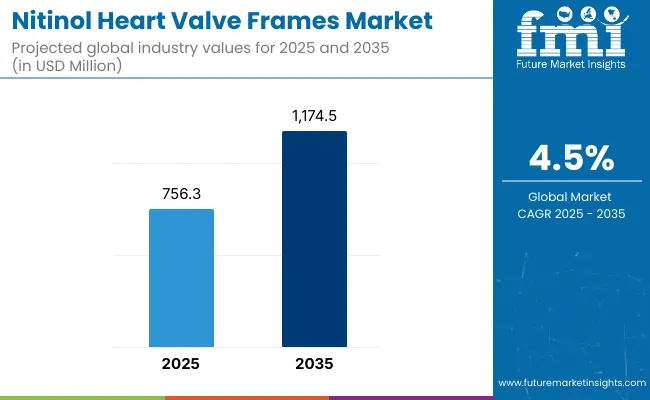
Quick Stats for Nitinol Heart Valve Frames Market

  • Nitinol Heart Valve Frames Market Value (2025): USD 756.3 million
  • Nitinol Heart Valve Frames Market Forecast Value (2035): USD 1,174.5 million
  • Nitinol Heart Valve Frames Market Forecast CAGR (2025 to 2035): 4.5%
  • Leading Segment in 2025 (Frame Design): Open-Cell (43.5%)
  • Key Growth Regions: North America, East Asia, and Europe
  • Top Key Players: MeKo Manufacturing e.K., FURUKAWA TECHNO MATERIAL CO., LTD., AMETEK.Inc, Norman Noble, Inc., ViVitro Labs, Resolution Medical, Peiertech Company, AccuPath®,GTI Medical and Others

Nitinol Heart Valve Frames Market

Metric Value
Nitinol Heart Valve Frames Market in (2025E) USD 756.3 million
Nitinol Heart Valve Frames Market in (2035F) USD 1,174.5 million
Forecast CAGR (2025 to 2035) 4.5%

During the first five year period between 2025 to 2030, the nitinol heart valve frames market is projected to grow steadily form USD 756.3 million to USD 942.5 million, driven by rising transcatheter aortic valve replacement (TAVR) procedures and increasing adoption of minimally invasive valve technologies. The market is expected to register a compound annual growth rate (CAGR) of 4.5%, translating to an incremental revenue opportunity of USD 186.2 million over this periodwhich accounts for 44.5% of the total decade growth. The Open-Cell frame design will continue to dominate, accounting for approximately 43.5% of the total revenue share due to its superior radial force and conformability, which facilitate effective anchoring during deployment.

The second half from 2030 to 2035, the market is forecasted to gain further momentum, contributing an additional USD 232.0 million which accounts for 55.5% of the total decade growth, with a projected CAGR of 3.7%. As device engineering advances, Hybrid designs are anticipated to gain share due to their ability to combine flexibility and strength. However, Aortic Valve Replacement will remain the largest application, consistently accounting for more than 91.2% of overall market revenue due to high procedural volumes and aging patient demographics.

From 2020 to 2024, The Nitinol heart valve frames market grew from USD 618.4 Million in 2020 to USD 731.3 Million in 2024 with CAGR of 3.3%, driven by TAVR expansion into intermediate-risk cohorts and rising adoption of self-expanding frames for complex anatomies. The top three manufacturers held around 46.1% share in 2024, supported by proprietary laser-cut architectures, fatigue-resistant heat-setting, sealing skirts, and commissural alignment features. Strategies centered on delivery profile miniaturization, expanding valve-in-valve and bicuspid indications, enhancing durability, and localizing production. TMVR frames saw minimal uptake due to anchoring challenges and LVOT obstruction risk.

Demand for Nitinol heart valve frames is projected at USD 756.3 Million in 2025. Traditional surgical players risk share loss without transcatheter innovations; major incumbents will defend position through next-gen features and durability data, while new manufacturers from Europe and Asia pacific are targeting niche anatomies, aiming for 1-2 pp gains via cost-optimized, precision-engineered frames.

Why Nitinol Heart Valve Frames Market is Growing?

A key driver is the rising prevalence of aortic stenosis and degenerative valve diseases, particularly among the aging global population. As life expectancy increases, so does the pool of patients eligible for transcatheter valve replacement, especially those deemed high-risk for open-heart surgery. This has accelerated the shift toward minimally invasive interventions, where nitinol frames play a critical role due to their super elasticity, fatigue resistance, and shape memory properties, enabling precise deployment and durable anchoring in anatomically complex regions.

In parallel, advancements in valve frame design especially open-cell and hybrid configurations have improved conformability and radial strength, reducing complications such as paravalvular leak. Moreover, favorable reimbursement policies in the United States and Europe and regulatory fast-tracking of next-gen transcatheter devices have created a conducive market environment. Device manufacturers are also expanding access to emerging markets and investing in physician training programs, further broadening procedural adoption and fueling sustained growth in the nitinol frame segment.

Segmental Analysis

The market is segmented by frame design, application, and end user. By frame design, the categories include open-cell, closed-cell, and hybrid configurations. Open-cell frames are the most widely adopted, offering superior flexibility and conformability to the dynamic anatomy of the aortic root, which enhances anchoring stability and reduces migration risk. Closed-cell designs provide higher radial strength, while hybrid frames combine the benefits of both geometries for specific procedural needs.

By application, Nitinol heart valve frames are primarily used in aortic valve replacement procedures, representing the bulk of global demand, with emerging use in mitral, pulmonary, and tricuspid interventions. By end user, hospitals dominate due to advanced infrastructure, hybrid operating rooms, and comprehensive reimbursement support. Independent cardiac catheterization labs are expanding their presence, particularly in urban, high-volume cardiovascular centers. Ambulatory surgical centers, while currently a smaller segment, are expected to record faster growth as transcatheter valve replacement becomes more viable in outpatient settings through streamlined protocols and lower-risk patient selection.
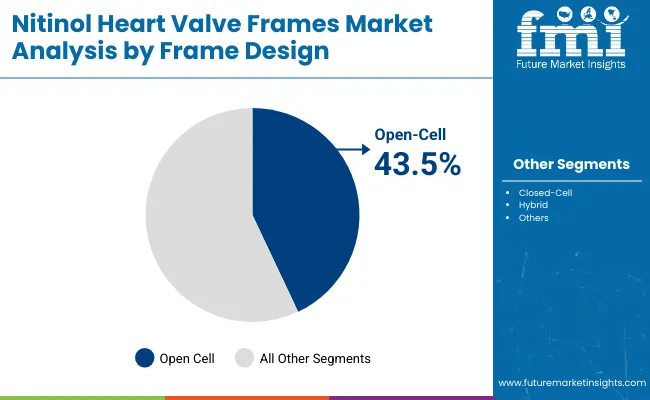
Insights on Segments Frame Design Segment with Dominance of Open-Cell Structures

Nitinol Heart Valve Frames Market By Frame Design

By Frame Design Market Value Share, 2025
Open-Cell 43.5%
Closed-Cell 31.5%
Hybrid 25.0%

In 2025, Open-Cell frame designs lead the nitinol heart valve frames market in terms of market share it holds around 43.5%. Their dominance is attributed to their exceptional conformability, radial expansion capability, and deployment precision, making them ideal for navigating the complex anatomy of the aortic root. These structures allow better blood flow through the open struts and accommodate dynamic motion without compromising structural integrity.

The demand is particularly strong in aortic valve replacement procedures, where secure anchoring and adaptability are crucial to reduce complications like valve migration or paravalvular leak. Furthermore, top-tier manufacturers have heavily focused on advancing Open-Cell technologies in their TAVR systems, reinforcing physician familiarity and clinical trust. As transcatheter procedures expand into intermediate and low-risk populations, Open-Cell frames are expected to maintain their lead due to reproducible outcomes and favorable hemodynamics across varied patient profiles
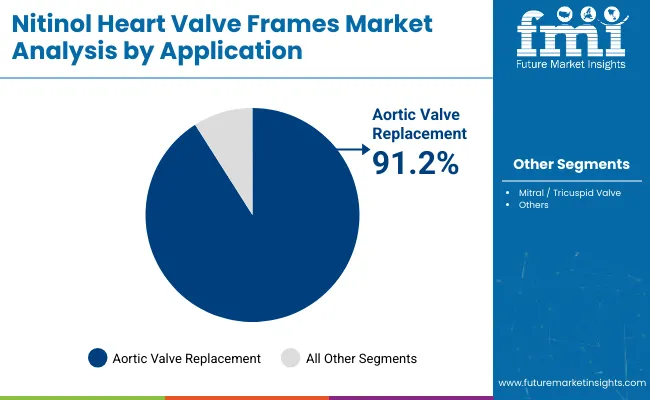
Insights on Segments Application Segment with Dominance of Aortic Valve Replacement

Nitinol Heart Valve Frames Market By Application

By Application Market Value Share, 2025
Aortic Valve Replacement 91.2%
Mitral / Tricuspid Valve 8.9%

In 2025, Aortic Valve Replacement (AVR) is the dominant application segment driving demand for nitinol heart valve frames with market share of 91.2%. This leadership is rooted in the high global burden of aortic stenosis, particularly among aging populations. With the continued shift from surgical to transcatheter aortic valve replacement (TAVR) procedures, the demand for nitinol-based frames-valued for their super elasticity and reliable deployment-is rising sharply.

Clinical guidelines increasingly endorse TAVR for not only high-risk but also intermediate- and low-risk patients, expanding the addressable market. Additionally, the majority of regulatory approvals and commercialized TAVR systems are centered around aortic valve interventions, reinforcing AVR’s dominant position. As device iterations improve procedural outcomes and reduce recovery time, hospitals and cath labs are increasingly favoring AVR as a standard-of-care solution, sustaining its top-tier position in application-based segmentation.
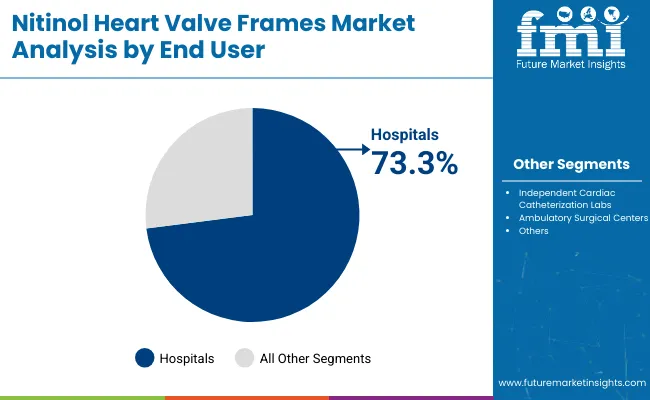
Insights on End User Segment with Hospitals as the Primary Demand Center

Nitinol Heart Valve Frames Market By End User

By End User Market Value Share, 2025
Hospitals 73.3%
Independent Cardiac Catheterization Labs 18.5%
Ambulatory Surgical Centers 8.2%

In 2025, Hospitals dominate the end-user landscape for nitinol heart valve frames with holding significant market share of 73.3%. Their leadership stems from their advanced infrastructure, access to hybrid operating rooms, and comprehensive cardiac care teams capable of handling complex transcatheter valve replacement procedures. Hospitals also benefit from established reimbursement frameworks and integrated care pathways, which support higher procedural volumes.

Furthermore, leading device manufacturers prioritize hospital partnerships for clinical trials, training, and early technology adoption, making hospitals the first point of access for new-generation frames. The growing number of TAVR-certified hospital centers globally, particularly in the United States, Europe, and Japan, amplifies this dominance. As procedural complexity rises especially in elderly or comorbid patient’s hospitals remain the preferred setting for managing intraoperative risks and post-operative care, ensuring their continued position as the primary demand driver.

What are Key Drivers, Restraints, and Trends Shaping Nitinol Heart Valve Fames Market Growth?

Self-expanding, conformable frames have enabled treatment of anatomically challenging cases, boosting adoption globally. Growth is restrained by technical and anatomical complexities in non-aortic applications such as mitral, pulmonary, and tricuspid valves, where anchoring, sealing, and regulatory hurdles slow commercialization. A key trend is the development of next-generation self-expanding and hybrid frames with improved radial strength, sealing, fatigue resistance, and delivery systems, enhancing procedural precision, durability, and patient eligibility across diverse anatomical presentations.

Expanding Indications and Patient Eligibility for TAVR

A major growth driver for the Nitinol heart valve frames market is the rapid expansion of transcatheter aortic valve replacement (TAVR) indications into intermediate- and lower-risk patient populations, supported by strong clinical evidence from pivotal trials. Historically confined to inoperable and high-risk patients, TAVR is now being adopted for younger, more active patients due to demonstrated survival benefits, reduced procedural trauma, and faster recovery times.

Nitinol frames, particularly self-expanding and repositionable designs, have enabled this expansion by offering superior conformability in anatomically challenging cases, such as bicuspid valves and small annuli, which previously posed procedural limitations. This trend has increased procedure volumes in both mature and emerging markets, with hospitals investing in hybrid operating rooms and advanced imaging to handle higher throughput. Moreover, improved delivery systems with reduced sheath sizes have broadened access to patients with peripheral artery disease, directly contributing to market growth and reinforcing the dominance of Nitinol-based valve frames in TAVR procedures.

Technical and Anatomical Challenges in Non-Aortic Applications

While TAVR has driven strong adoption of Nitinol heart valve frames, their application in transcatheter mitral, pulmonary, and tricuspid valve replacement remains limited due to technical and anatomical challenges. In the mitral position, anchoring a frame securely without surgical suturing is complex, given the non-circular annulus, variable calcification, and risk of left ventricular outflow tract (LVOT) obstruction.

Pulmonary and tricuspid valve anatomies pose their own challenges, including low-pressure environments and larger, irregular annuli that complicate frame fixation. These anatomical barriers necessitate highly specialized frame geometries and anchoring mechanisms, increasing design complexity and development costs.

As a result, many emerging applications remain in early feasibility or limited commercial rollout phases, slowing overall market diversification. Regulatory pathways for these non-aortic applications are also less established, requiring extended clinical validation and long-term outcome data, which delays commercialization timelines. Until these engineering and procedural hurdles are addressed, growth in these segments will lag behind the aortic valve replacement market.

Shift Toward Next-Generation Self-Expanding and Hybrid Frame Designs

A defining trend in the Nitinol heart valve frames market is the shift toward next-generation self-expanding and hybrid frame designs that balance conformability with enhanced radial strength. Traditional open-cell frames dominate due to their flexibility, but newer designs are integrating hybrid geometries that maintain this adaptability while improving sealing and reducing paravalvular leak (PVL) rates.

Manufacturers are also optimizing frame fatigue resistance through advanced heat-setting processes, ensuring durability over billions of cardiac cycles-a critical factor as TAVR expands into younger populations with longer life expectancy. Furthermore, delivery system innovations, such as lower-profile sheaths and improved recapture mechanisms, are being paired with these advanced frames to facilitate precise positioning and enable coronary reaccess post-implantation.

These advancements not only improve procedural success rates but also expand patient eligibility to more complex anatomies, including bicuspid valves and heavily calcified annuli. This trend reflects a market-wide focus on engineering refinements that enhance both short-term outcomes and long-term valve durability.
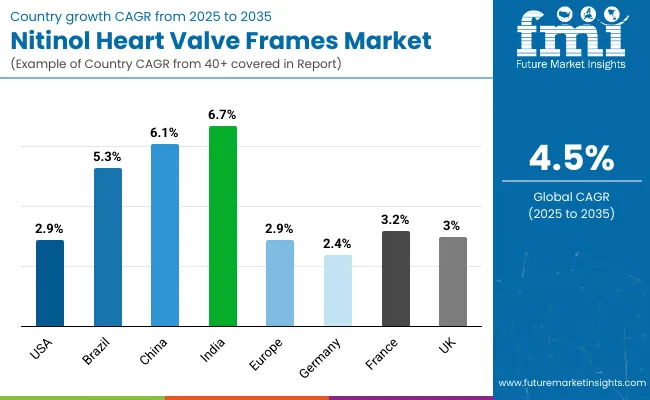
Analysis of Nitinol Heart Valve Frames Key Countries

Country Wise Analysis Of Nitinol Heart Valve Frames Market

Country CAGR (%)
United States 2.9%
Brazil 5.3%
China 6.1%
India 6.7%
Europe 2.9%
Germany 2.4%
France 3.2%
United Kingdom 3.0%

Asia-Pacific is emerging as the fastest-growing region in the Nitinol Heart Valve Frames Market, driven by robust healthcare infrastructure development, rising cardiovascular disease burden, and increasing access to advanced interventional cardiology. India (6.7% CAGR) and China (6.1% CAGR) are the two fastest-growing countries, supported by government-led public health programs, medical tourism growth, and the rapid expansion of TAVR-certified cardiac centers. Additionally, domestic device manufacturers are entering the space, improving price accessibility and local availability, which further accelerates adoption in previously underpenetrated markets.

Europe shows a moderate growth outlook (3.3% CAGR), with key countries like Germany (2.4%), France (3.2%), and the United Kingdom (3.0%) reflecting differentiated dynamics. France benefits from strong public insurance coverage for TAVR, while the United Kingdom is steadily expanding specialized cardiac centers under NHS modernization. Germany’s slower growth is due to high market saturation and conservative procedural guidelines. However, all three countries maintain stable demand due to aging populations and consistent clinical uptake in tertiary care hospitals.

North America remains a mature but strategically important market, with the United States growing at a 2.9% CAGR. Growth is driven by continuous expansion of low-risk TAVR indications, strong reimbursement frameworks (e.g., Medicare), and ongoing innovation by domestic manufacturers such as Medtronic and Edwards Lifesciences. United States hospitals also benefit from widespread adoption of hybrid ORs and structured training programs, making the country a leader in early adoption of next-gen frame designs. The focus on personalized cardiac care and value-based outcomes sustains long-term growth.

Sales Outlook of Nitinol Heart Valve Frames in United States

Year USA Nitinol Heart Valve Frames Market (USD Million)
2025 756.3
2026 785.7
2027 820.5
2028 857.4
2029 896.1
2030 936.9
2031 979.3
2032 1024.2
2033 1072.4
2034 1123.6
2035 1174.59

The nitinol heart valve frames market in the United States is projected to grow at a CAGR of 2.9% from 2025 to 2035. Although the market is mature, it continues to expand steadily due to rising volumes of transcatheter aortic valve replacement (TAVR) procedures and favorable reimbursement through Medicare and private insurers. The growth is also supported by the aging population, increasing prevalence of aortic stenosis, and FDA approvals expanding TAVR indications to low-risk patient groups.

Hospitals remain the dominant end users, but Independent Cardiac Catheterization Labs are seeing rising adoption due to faster patient throughput and growing access to hybrid procedural suites in outpatient settings.

  • Treatment of elderly patients with high surgical risk for aortic stenosis
  • Valve-in-valve TAVR procedures for failing bioprosthetic valves
  • Minimally invasive valve replacement in intermediate-risk patients under CMS coverage

Growth and Expansion Outlook of Nitinol Heart Valve Frames in Germany

Germany’s Nitinol Heart Valve Frames Market is expected to grow at a CAGR of 2.4% between 2025 and 2035. Although growth is modest, Germany remains one of the largest markets in Europe due to its well-established cardiovascular treatment infrastructure, high procedural volume, and strong clinical adoption of TAVR. The market is largely driven by its aging population, universal insurance coverage, and continuous advancements in Open-Cell and Hybrid frame technologies. However, stringent clinical guidelines and slower reimbursement adjustments slightly temper the pace of growth.

Hospitals remain the primary end users, especially university-affiliated cardiac centers equipped with hybrid operating rooms. Outpatient catheterization centers are slowly gaining traction, particularly for low-risk cases.

  • Routine TAVR in elderly patients covered under statutory health insurance
  • Hybrid frame use in anatomically challenging valve-in-valve procedures
  • Early adoption of next-gen nitinol frames through university hospital clinical trials

Growth and Expansion Outlook of Nitinol Heart Valve Frames in United Kingdom

The United Kingdom's nitinol heart valve frames market is projected to grow at a CAGR of 2.9% from 2025 to 2035. Growth is driven by the National Health Service (NHS) expansion of structural heart programs, increased referrals for TAVR in elderly patients, and wider adoption of minimally invasive procedures across regional cardiac centers. Government investments in modernizing cath labs and hybrid ORs are enhancing accessibility, especially in Tier-2 cities.

While hospitals remain the primary end users, Independent Cardiac Catheterization Labs are increasingly utilized for elective valve procedures due to shorter wait times and resource efficiency.

  • Publicly funded TAVR for elderly patient’s ineligible for surgery
  • TAVR procedures under the NHS England structural heart program
  • Post-COVID prioritization of minimally invasive interventions in backlogged elective cases

Europe Outlook of Nitinol Heart Valve Frames by Country

Europe Countries Share 2025 % Share
Germany 27.9%
United Kingdom 16.8%
France 15.0%
Italy 11.3%
Spain 8.5%
BENELUX 6.9%
Nordic Countries 5.9%
Rest of Western Europe 7.7%
Europe Countries Share 2035 % Share
Germany 27.3%
United Kingdom 16.5%
France 14.7%
Italy 11.1%
Spain 8.3%
BENELUX 6.8%
Nordic Countries 5.8%
Rest of Western Europe 9.6%

Growth and Expansion Outlook of Nitinol Heart Valve Frames in India

India’s Nitinol Heart Valve Frames Market is expected to grow at a CAGR of 6.7% between 2025 and 2035, making it one of the fastest-growing global markets. This growth is driven by an increasing burden of valvular heart disease, rising awareness of transcatheter therapies, and a growing number of TAVR-capable cardiac centers in metropolitan hospitals. Additionally, favorable regulatory pathways, government investments in cardiac care infrastructure, and the emergence of local valve manufacturers are improving cost accessibility.

Hospitals are the dominant end users due to their access to hybrid operating rooms and skilled interventional cardiologists. However, private multispecialty centers are seeing rising adoption, especially in Tier-1 cities, due to patient preference for premium, minimally invasive solutions.

  • TAVR for elderly patients unfit for open-heart surgery
  • High-income patients opting for minimally invasive procedures in private hospitals
  • Early-stage TAVR adoption in government-funded cardiac specialty hospitals

Growth and Expansion Outlook of Nitinol Heart Valve Frames in China

China’s nitinol heart valve frames market is projected to grow at a CAGR of 6.1% from 2025 to 2035, driven by rapid expansion in cardiovascular care infrastructure and rising prevalence of aortic stenosis among the aging population. The Chinese government’s support for domestic innovation, through programs like “Made in China 2025,” has enabled local companies to develop cost-effective TAVR systems using nitinol frames, increasing accessibility beyond Tier-1 cities. The National Reimbursement Drug List (NRDL) and pilot insurance schemes in provinces are also improving procedural affordability.

Tertiary hospitals are the leading end users, but adoption is rapidly increasing in provincial cardiac centers due to government-backed training and equipment grants.

  • TAVR procedures in high-risk elderly patients in large urban hospitals
  • Valve-in-valve therapy using domestically manufactured frames
  • Inclusion of TAVR under public insurance pilot projects in major provinces

Growth Outlook of Nitinol Heart Valve Frames in Japan

Japan Nitinol Heart Valve Frames Market, By Frame Design, Market Share (%) Analysis, 2025 2025 Share (%)
Open-Cell 44.4%
Closed-Cell 32.2%
Hybrid 23.4%

Japan’s nitinol heart valve frames market is projected to grow at a CAGR of 3.5% from 2025 to 2035. The market is expanding steadily due to the country’s rapidly aging population, high prevalence of aortic stenosis, and widespread adoption of transcatheter aortic valve replacement (TAVR). Japan has a strong hospital-based healthcare system, and government-approved reimbursement for TAVR procedures under the National Health Insurance (NHI) significantly enhances affordability and access. Additionally, collaboration between domestic manufacturers and global firms is accelerating innovation and local clinical adoption.

University hospitals and large cardiovascular centers are the primary end users, but regional hospitals are seeing rising adoption due to government-led decentralization of structural heart programs.

  • Japan approximately holds around 1.8% in the global sales
  • Open-Cell holds major share by frame design type in Japan
  • Japan’s nitinol heart valve frames market is projected to grow at a CAGR of 3.5%

Growth Outlook of Nitinol Heart Valve Frames in South Korea

South Korea Nitinol Heart Valve Frames Market, By End User, Market Share (%) Analysis, 2025 2025 Share (%)
Hospitals 74.0%
Specialty Clinics 18.7%
Ambulatory Surgical Centers 7.3%

South Korea’s nitinol heart valve frames market is projected to grow at a CAGR of 5.9% from 2025 to 2035, positioning it among the fastest-growing Asian markets. Growth is fueled by a rapidly aging population, early government adoption of structural heart programs, and strong investments in public-private hospital collaborations. South Korea’s national health insurance covers TAVR procedures for high-risk patients, and newer-generation nitinol frames are increasingly being adopted in leading cardiovascular centers.

While tertiary hospitals continue to dominate usage, regional cardiac centers are seeing rising procedural volumes due to technology standardization and interventional cardiology training programs.
  • Hospitals dominate the market in South Korea by end user type holds significant share of 74.0% in the year 2025
  • South Korea’s nitinol heart valve frames market is projected to grow at a CAGR of 5.9%
  • South Korea globally holds approximately 1.2% share.

Competitive Landscape

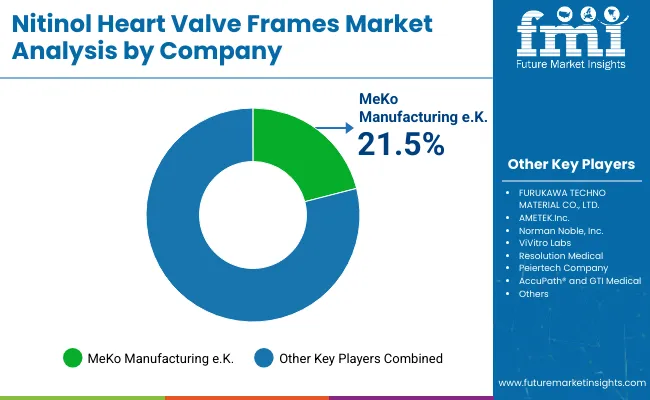
Nitinol Heart Valve Frames Market By Company

Key Players Global Value Share (%) 2025
MeKo Manufacturing e.K. 21.5%
Other Players 78.5%

The nitinol heart valve frames market is moderately consolidated, with a mix of global contract manufacturers, precision engineering firms, and niche suppliers supporting transcatheter valve system OEMs. MeKo Manufacturing e.K. holds the leading market share at 21.5%, driven by its specialization in laser-cutting and electro polishing of nitinol stents and valve frames, deep collaborations with Tier 1 device manufacturers, and superior quality validation protocols. The company’s competitive edge lies in its precision microfabrication technologies, vertical integration, and reputation for delivering high-reliability components for Class III cardiovascular implants.

Mid-sized players like FURUKAWA TECHNO MATERIAL CO., LTD., AMETEK Inc., and Norman Noble, Inc. are recognized for their innovation in high-nickel alloy processing, nitinol tubing, and multi-axis micromachining capabilities. These firms often serve as Tier 2/3 suppliers in co-development partnerships with global valve system leaders, offering flexibility in prototyping, scale-up, and multi-continent regulatory compliance.

Specialty providers including ViVitro Labs, Resolution Medical, Peiertech, and AccuPath® serve highly specific roles across R&D testing, preclinical validation, and custom-form nitinol device fabrication. These companies focus on agility, offering rapid design iterations, niche regulatory pathways (e.g., for mitral or tricuspid use cases), and regional contract manufacturing in support of early-stage and emerging valve system developers.

As the market evolves, competitive differentiation is shifting from standard fabrication toward IP-backed customization, integration with next-generation delivery systems, and support for bicuspid and redo-TAVR indications. Leaders are investing in closed-loop manufacturing analytics, materials traceability, and long-term fatigue data capture, essential for meeting the growing demand for lifetime durability in younger, low-risk patient populations.

Key Developments

  • In July 2025 Edwards Lifesciences received CE approval for their Sapien M3 transfemoral transcatheter mitral valve replacement (TMVR) system, which uses a nitinol implant to anchor the valve implant in a patient’s heart.
  • In May 2025, the Boston Scientific Corp. begins the start of patient enrollment in the ORION clinical trial, a study designed for the company’s EPIC™ Self-Expanding Nitinol Stent System for the treatment of iliac artery disease.

Scope of Report

Item Value
Quantitative Units USD 1,174.5 million
Frame Design Open-Cell, Closed-Cell and Hybrid
Application Aortic Valve Replacement and Mitral / Tricuspid Valve
End User Hospitals, Independent Cardiac Catheterization Labs and Ambulatory Surgical Centers
Regions Covered North America, Latin America, Western & Eastern Europe, East Asia, South Asia & Pacific, Middle East & Africa
Countries Covered United States, Brazil, China, India, Germany, France, United Kingdom etc.
Key Companies Profiled MeKo Manufacturing e.K., FURUKAWA TECHNO MATERIAL CO., LTD., AMETEK.Inc, Norman Noble, Inc., ViVitro Labs, Resolution Medical, Peiertech Company, AccuPath® and GTI Medical
Additional Attributes Dollar sales by application and regions, a doption trends of frameless/self-expanding Nitinol valve technologies, Demand in bioprosthetic valve innovation and Growth across transcatheter aortic valve replacement (TAVR) and next-gen mitral/pulmonary valve devices

Key Segmentation

By Frame Design:

  • Open-Cell
  • Closed-Cell
  • Hybrid

By Application:

  • Aortic Valve Replacement
  • Mitral / Tricuspid Valve

By End User:

  • Hospitals
  • Independent Cardiac Catheterization Labs
  • Ambulatory Surgical Centers

By Region:

  • North America
  • Latin America
  • East Asia
  • South Asia
  • Western Europe
  • Eastern Europe
  • Middle East & Africa

Table of Content

  • Executive Summary
    • Global Market Outlook
    • Demand-side Trends
    • Supply-side Trends
    • Technology Roadmap Analysis
    • Analysis and Recommendations
  • Market Overview
    • Market Coverage / Taxonomy
    • Market Definition / Scope / Limitations
  • Market Background
    • Market Dynamics
      • Drivers
      • Restraints
      • Opportunity
      • Trends
    • Scenario Forecast
      • Demand in Optimistic Scenario
      • Demand in Likely Scenario
      • Demand in Conservative Scenario
    • Opportunity Map Analysis
    • Product Life Cycle Analysis
    • Supply Chain Analysis
      • Supply Side Participants and their Roles
        • Producers
        • Mid-Level Participants (Traders/ Agents/ Brokers)
        • Wholesalers and Distributors
      • Value Added and Value Created at Node in the Supply Chain
      • List of Raw Material Suppliers
      • List of Existing and Potential Buyer’s
    • Investment Feasibility Matrix
    • Value Chain Analysis
      • Profit Margin Analysis
      • Wholesalers and Distributors
      • Retailers
    • PESTLE and Porter’s Analysis
    • Regulatory Landscape
      • By Key Regions
      • By Key Countries
    • Regional Parent Market Outlook
  • Global Market Analysis 2020 to 2024 and Forecast, 2025 to 2035
    • Historical Market Size Value (USD Million) & Volume (Units) Analysis, 2020 to 2024
    • Current and Future Market Size Value (USD Million) & Volume (Units) Projections, 2025 to 2035
      • Y-o-Y Growth Trend Analysis
      • Absolute $ Opportunity Analysis
  • Global Market Analysis 2020 to 2024 and Forecast 2025 to 2035, By Frame Design
    • Introduction / Key Findings
    • Historical Market Size Value (USD Million) & Volume (Units) Analysis By Frame Design, 2020 to 2024
    • Current and Future Market Size Value (USD Million) & Volume (Units) Analysis and Forecast By Frame Design, 2025 to 2035
      • Open-Cell
      • Closed-Cell
      • Hybrid
    • Y-o-Y Growth Trend Analysis By Frame Design, 2020 to 2024
    • Absolute $ Opportunity Analysis By Frame Design, 2025 to 2035
  • Global Market Analysis 2020 to 2024 and Forecast 2025 to 2035, By Application
    • Introduction / Key Findings
    • Historical Market Size Value (USD Million) & Volume (Units) Analysis By Application, 2020 to 2024
    • Current and Future Market Size Value (USD Million) & Volume (Units) Analysis and Forecast By Application, 2025 to 2035
      • Aortic Valve Replacement
      • Mitral / Tricuspid Valve
    • Y-o-Y Growth Trend Analysis By Application, 2020 to 2024
    • Absolute $ Opportunity Analysis By Application, 2025 to 2035
  • Global Market Analysis 2020 to 2024 and Forecast 2025 to 2035, By End User
    • Introduction / Key Findings
    • Historical Market Size Value (USD Million) & Volume (Units) Analysis By End User, 2020 to 2024
    • Current and Future Market Size Value (USD Million) & Volume (Units) Analysis and Forecast By End User, 2025 to 2035
      • Hospitals
      • Independent Cardiac Catheterization Labs
      • Ambulatory Surgical Centers
    • Y-o-Y Growth Trend Analysis By End User, 2020 to 2024
    • Absolute $ Opportunity Analysis By End User, 2025 to 2035
  • Global Market Analysis 2020 to 2024 and Forecast 2025 to 2035, By Region
    • Introduction
    • Historical Market Size Value (USD Million) & Volume (Units) Analysis By Region, 2020 to 2024
    • Current Market Size Value (USD Million) & Volume (Units) Analysis and Forecast By Region, 2025 to 2035
      • North America
      • Latin America
      • East Asia
      • South Asia
      • Western Europe
      • Eastern Europe
      • Middle East & Africa
    • Market Attractiveness Analysis By Region
  • North America Market Analysis 2020 to 2024 and Forecast 2025 to 2035, By Country
    • Historical Market Size Value (USD Million) & Volume (Units) Trend Analysis By Market Taxonomy, 2020 to 2024
    • Market Size Value (USD Million) & Volume (Units) Forecast By Market Taxonomy, 2025 to 2035
      • By Country
        • USA
        • Canada
        • Mexico
      • By Frame Design
      • By Application
      • By End User
    • Market Attractiveness Analysis
      • By Country
      • By Frame Design
      • By Application
      • By End User
    • Key Takeaways
  • Latin America Market Analysis 2020 to 2024 and Forecast 2025 to 2035, By Country
    • Historical Market Size Value (USD Million) & Volume (Units) Trend Analysis By Market Taxonomy, 2020 to 2024
    • Market Size Value (USD Million) & Volume (Units) Forecast By Market Taxonomy, 2025 to 2035
      • By Country
        • Brazil
        • Argentina
        • Rest of Latin America
      • By Frame Design
      • By Application
      • By End User
    • Market Attractiveness Analysis
      • By Country
      • By Frame Design
      • By Application
      • By End User
    • Key Takeaways
  • East Asia Market Analysis 2020 to 2024 and Forecast 2025 to 2035, By Country
    • Historical Market Size Value (USD Million) & Volume (Units) Trend Analysis By Market Taxonomy, 2020 to 2024
    • Market Size Value (USD Million) & Volume (Units) Forecast By Market Taxonomy, 2025 to 2035
      • By Country
        • China
        • Japan
        • South Korea
      • By Frame Design
      • By Application
      • By End User
    • Market Attractiveness Analysis
      • By Country
      • By Frame Design
      • By Application
      • By End User
    • Key Takeaways
  • South Asia Market Analysis 2020 to 2024 and Forecast 2025 to 2035, By Country
    • Historical Market Size Value (USD Million) & Volume (Units) Trend Analysis By Market Taxonomy, 2020 to 2024
    • Market Size Value (USD Million) & Volume (Units) Forecast By Market Taxonomy, 2025 to 2035
      • By Country
        • India
        • ASEAN Countries
        • Australia & New Zealand
        • Rest of South Asia
      • By Frame Design
      • By Application
      • By End User
    • Market Attractiveness Analysis
      • By Country
      • By Frame Design
      • By Application
      • By End User
    • Key Takeaways
  • Western Europe Market Analysis 2020 to 2024 and Forecast 2025 to 2035, By Country
    • Historical Market Size Value (USD Million) & Volume (Units) Trend Analysis By Market Taxonomy, 2020 to 2024
    • Market Size Value (USD Million) & Volume (Units) Forecast By Market Taxonomy, 2025 to 2035
      • By Country
        • Germany
        • UK
        • France
        • Italy
        • Spain
        • BENELUX
        • Nordic Countries
        • Rest of Western Europe
      • By Frame Design
      • By Application
      • By End User
    • Market Attractiveness Analysis
      • By Country
      • By Frame Design
      • By Application
      • By End User
    • Key Takeaways
  • Eastern Europe Market Analysis 2020 to 2024 and Forecast 2025 to 2035, By Country
    • Historical Market Size Value (USD Million) & Volume (Units) Trend Analysis By Market Taxonomy, 2020 to 2024
    • Market Size Value (USD Million) & Volume (Units) Forecast By Market Taxonomy, 2025 to 2035
      • By Country
        • Russia
        • Hungary
        • Poland
        • Rest of Eastern Europe
      • By Frame Design
      • By Application
      • By End User
    • Market Attractiveness Analysis
      • By Country
      • By Frame Design
      • By Application
      • By End User
    • Key Takeaways
  • Middle East & Africa Market Analysis 2020 to 2024 and Forecast 2025 to 2035, By Country
    • Historical Market Size Value (USD Million) & Volume (Units) Trend Analysis By Market Taxonomy, 2020 to 2024
    • Market Size Value (USD Million) & Volume (Units) Forecast By Market Taxonomy, 2025 to 2035
      • By Country
        • Saudi Arabia
        • Other GCC Countries
        • Türkiye
        • South Africa
        • Rest of MEA
      • By Frame Design
      • By Application
      • By End User
    • Market Attractiveness Analysis
      • By Country
      • By Frame Design
      • By Application
      • By End User
    • Key Takeaways
  • Key Countries Market Analysis
    • USA
      • Pricing Analysis
      • Market Share Analysis, 2024
        • By Frame Design
        • By Application
        • By End User
    • Brazil
      • Pricing Analysis
      • Market Share Analysis, 2024
        • By Frame Design
        • By Application
        • By End User
    • China
      • Pricing Analysis
      • Market Share Analysis, 2024
        • By Frame Design
        • By Application
        • By End User
    • India
      • Pricing Analysis
      • Market Share Analysis, 2024
        • By Frame Design
        • By Application
        • By End User
    • Europe
      • Pricing Analysis
      • Market Share Analysis, 2024
        • By Frame Design
        • By Application
        • By End User
    • Germany
      • Pricing Analysis
      • Market Share Analysis, 2024
        • By Frame Design
        • By Application
        • By End User
    • France
      • Pricing Analysis
      • Market Share Analysis, 2024
        • By Frame Design
        • By Application
        • By End User
    • UK
      • Pricing Analysis
      • Market Share Analysis, 2024
        • By Frame Design
        • By Application
        • By End User
  • Market Structure Analysis
    • Competition Dashboard
    • Competition Benchmarking
    • Market Share Analysis of Top Players
      • By Regional
      • By Frame Design
      • By Application
      • By End User
  • Competition Analysis
    • Competition Deep Dive
      • MeKo Manufacturing e.K.
        • Overview
        • Product Portfolio
        • Profitability by Market Segments (Product/Age /Sales Channel/Region)
        • Sales Footprint
        • Strategy Overview
          • Marketing Strategy
          • Product Strategy
          • Channel Strategy
      • FURUKAWA TECHNO MATERIAL CO., LTD.
        • Overview
        • Product Portfolio
        • Profitability by Market Segments (Product/Age /Sales Channel/Region)
        • Sales Footprint
        • Strategy Overview
          • Marketing Strategy
          • Product Strategy
          • Channel Strategy
      • AMETEK.Inc
        • Overview
        • Product Portfolio
        • Profitability by Market Segments (Product/Age /Sales Channel/Region)
        • Sales Footprint
        • Strategy Overview
          • Marketing Strategy
          • Product Strategy
          • Channel Strategy
      • Norman Noble, Inc.
        • Overview
        • Product Portfolio
        • Profitability by Market Segments (Product/Age /Sales Channel/Region)
        • Sales Footprint
        • Strategy Overview
          • Marketing Strategy
          • Product Strategy
          • Channel Strategy
      • ViVitro Labs
        • Overview
        • Product Portfolio
        • Profitability by Market Segments (Product/Age /Sales Channel/Region)
        • Sales Footprint
        • Strategy Overview
          • Marketing Strategy
          • Product Strategy
          • Channel Strategy
      • Resolution Medical
        • Overview
        • Product Portfolio
        • Profitability by Market Segments (Product/Age /Sales Channel/Region)
        • Sales Footprint
        • Strategy Overview
          • Marketing Strategy
          • Product Strategy
          • Channel Strategy
      • Peiertech Company
        • Overview
        • Product Portfolio
        • Profitability by Market Segments (Product/Age /Sales Channel/Region)
        • Sales Footprint
        • Strategy Overview
          • Marketing Strategy
          • Product Strategy
          • Channel Strategy
      • AccuPath®
        • Overview
        • Product Portfolio
        • Profitability by Market Segments (Product/Age /Sales Channel/Region)
        • Sales Footprint
        • Strategy Overview
          • Marketing Strategy
          • Product Strategy
          • Channel Strategy
      • GTI Medical
        • Overview
        • Product Portfolio
        • Profitability by Market Segments (Product/Age /Sales Channel/Region)
        • Sales Footprint
        • Strategy Overview
          • Marketing Strategy
          • Product Strategy
          • Channel Strategy
  • Assumptions & Acronyms Used
  • Research Methodology

List of Tables

  • Table 1: Global Market Value (USD Million) Forecast by Region, 2020-2035
  • Table 2: Global Market Volume (Units) Forecast by Region, 2020-2035
  • Table 3: Global Market Value (USD Million) Forecast by Frame Design, 2020-2035
  • Table 4: Global Market Volume (Units) Forecast by Frame Design, 2020-2035
  • Table 5: Global Market Value (USD Million) Forecast by Application, 2020-2035
  • Table 6: Global Market Volume (Units) Forecast by Application, 2020-2035
  • Table 7: Global Market Value (USD Million) Forecast by End User, 2020-2035
  • Table 8: Global Market Volume (Units) Forecast by End User, 2020-2035
  • Table 9: North America Market Value (USD Million) Forecast by Country, 2020-2035
  • Table 10: North America Market Volume (Units) Forecast by Country, 2020-2035
  • Table 11: North America Market Value (USD Million) Forecast by Frame Design, 2020-2035
  • Table 12: North America Market Volume (Units) Forecast by Frame Design, 2020-2035
  • Table 13: North America Market Value (USD Million) Forecast by Application, 2020-2035
  • Table 14: North America Market Volume (Units) Forecast by Application, 2020-2035
  • Table 15: North America Market Value (USD Million) Forecast by End User, 2020-2035
  • Table 16: North America Market Volume (Units) Forecast by End User, 2020-2035
  • Table 17: Latin America Market Value (USD Million) Forecast by Country, 2020-2035
  • Table 18: Latin America Market Volume (Units) Forecast by Country, 2020-2035
  • Table 19: Latin America Market Value (USD Million) Forecast by Frame Design, 2020-2035
  • Table 20: Latin America Market Volume (Units) Forecast by Frame Design, 2020-2035
  • Table 21: Latin America Market Value (USD Million) Forecast by Application, 2020-2035
  • Table 22: Latin America Market Volume (Units) Forecast by Application, 2020-2035
  • Table 23: Latin America Market Value (USD Million) Forecast by End User, 2020-2035
  • Table 24: Latin America Market Volume (Units) Forecast by End User, 2020-2035
  • Table 25: East Asia Market Value (USD Million) Forecast by Country, 2020-2035
  • Table 26: East Asia Market Volume (Units) Forecast by Country, 2020-2035
  • Table 27: East Asia Market Value (USD Million) Forecast by Frame Design, 2020-2035
  • Table 28: East Asia Market Volume (Units) Forecast by Frame Design, 2020-2035
  • Table 29: East Asia Market Value (USD Million) Forecast by Application, 2020-2035
  • Table 30: East Asia Market Volume (Units) Forecast by Application, 2020-2035
  • Table 31: East Asia Market Value (USD Million) Forecast by End User, 2020-2035
  • Table 32: East Asia Market Volume (Units) Forecast by End User, 2020-2035
  • Table 33: South Asia Market Value (USD Million) Forecast by Country, 2020-2035
  • Table 34: South Asia Market Volume (Units) Forecast by Country, 2020-2035
  • Table 35: South Asia Market Value (USD Million) Forecast by Frame Design, 2020-2035
  • Table 36: South Asia Market Volume (Units) Forecast by Frame Design, 2020-2035
  • Table 37: South Asia Market Value (USD Million) Forecast by Application, 2020-2035
  • Table 38: South Asia Market Volume (Units) Forecast by Application, 2020-2035
  • Table 39: South Asia Market Value (USD Million) Forecast by End User, 2020-2035
  • Table 40: South Asia Market Volume (Units) Forecast by End User, 2020-2035
  • Table 41: Western Europe Market Value (USD Million) Forecast by Country, 2020-2035
  • Table 42: Western Europe Market Volume (Units) Forecast by Country, 2020-2035
  • Table 43: Western Europe Market Value (USD Million) Forecast by Frame Design, 2020-2035
  • Table 44: Western Europe Market Volume (Units) Forecast by Frame Design, 2020-2035
  • Table 45: Western Europe Market Value (USD Million) Forecast by Application, 2020-2035
  • Table 46: Western Europe Market Volume (Units) Forecast by Application, 2020-2035
  • Table 47: Western Europe Market Value (USD Million) Forecast by End User, 2020-2035
  • Table 48: Western Europe Market Volume (Units) Forecast by End User, 2020-2035
  • Table 49: Eastern Europe Market Value (USD Million) Forecast by Country, 2020-2035
  • Table 50: Eastern Europe Market Volume (Units) Forecast by Country, 2020-2035
  • Table 51: Eastern Europe Market Value (USD Million) Forecast by Frame Design, 2020-2035
  • Table 52: Eastern Europe Market Volume (Units) Forecast by Frame Design, 2020-2035
  • Table 53: Eastern Europe Market Value (USD Million) Forecast by Application, 2020-2035
  • Table 54: Eastern Europe Market Volume (Units) Forecast by Application, 2020-2035
  • Table 55: Eastern Europe Market Value (USD Million) Forecast by End User, 2020-2035
  • Table 56: Eastern Europe Market Volume (Units) Forecast by End User, 2020-2035
  • Table 57: Middle East & Africa Market Value (USD Million) Forecast by Country, 2020-2035
  • Table 58: Middle East & Africa Market Volume (Units) Forecast by Country, 2020-2035
  • Table 59: Middle East & Africa Market Value (USD Million) Forecast by Frame Design, 2020-2035
  • Table 60: Middle East & Africa Market Volume (Units) Forecast by Frame Design, 2020-2035
  • Table 61: Middle East & Africa Market Value (USD Million) Forecast by Application, 2020-2035
  • Table 62: Middle East & Africa Market Volume (Units) Forecast by Application, 2020-2035
  • Table 63: Middle East & Africa Market Value (USD Million) Forecast by End User, 2020-2035
  • Table 64: Middle East & Africa Market Volume (Units) Forecast by End User, 2020-2035

List of Figures

  • Figure 1: Global Market Value (USD Million) by Frame Design, 2025-2035
  • Figure 2: Global Market Value (USD Million) by Application, 2025-2035
  • Figure 3: Global Market Value (USD Million) by End User, 2025-2035
  • Figure 4: Global Market Value (USD Million) by Region, 2025-2035
  • Figure 5: Global Market Value (USD Million) Analysis by Region, 2020-2035
  • Figure 6: Global Market Volume (Units) Analysis by Region, 2020-2035
  • Figure 7: Global Market Value Share (%) and BPS Analysis by Region, 2025-2035
  • Figure 8: Global Market Y-o-Y Growth (%) Projections by Region, 2025-2035
  • Figure 9: Global Market Value (USD Million) Analysis by Frame Design, 2020-2035
  • Figure 10: Global Market Volume (Units) Analysis by Frame Design, 2020-2035
  • Figure 11: Global Market Value Share (%) and BPS Analysis by Frame Design, 2025-2035
  • Figure 12: Global Market Y-o-Y Growth (%) Projections by Frame Design, 2025-2035
  • Figure 13: Global Market Value (USD Million) Analysis by Application, 2020-2035
  • Figure 14: Global Market Volume (Units) Analysis by Application, 2020-2035
  • Figure 15: Global Market Value Share (%) and BPS Analysis by Application, 2025-2035
  • Figure 16: Global Market Y-o-Y Growth (%) Projections by Application, 2025-2035
  • Figure 17: Global Market Value (USD Million) Analysis by End User, 2020-2035
  • Figure 18: Global Market Volume (Units) Analysis by End User, 2020-2035
  • Figure 19: Global Market Value Share (%) and BPS Analysis by End User, 2025-2035
  • Figure 20: Global Market Y-o-Y Growth (%) Projections by End User, 2025-2035
  • Figure 21: Global Market Attractiveness by Frame Design, 2025-2035
  • Figure 22: Global Market Attractiveness by Application, 2025-2035
  • Figure 23: Global Market Attractiveness by End User, 2025-2035
  • Figure 24: Global Market Attractiveness by Region, 2025-2035
  • Figure 25: North America Market Value (USD Million) by Frame Design, 2025-2035
  • Figure 26: North America Market Value (USD Million) by Application, 2025-2035
  • Figure 27: North America Market Value (USD Million) by End User, 2025-2035
  • Figure 28: North America Market Value (USD Million) by Country, 2025-2035
  • Figure 29: North America Market Value (USD Million) Analysis by Country, 2020-2035
  • Figure 30: North America Market Volume (Units) Analysis by Country, 2020-2035
  • Figure 31: North America Market Value Share (%) and BPS Analysis by Country, 2025-2035
  • Figure 32: North America Market Y-o-Y Growth (%) Projections by Country, 2025-2035
  • Figure 33: North America Market Value (USD Million) Analysis by Frame Design, 2020-2035
  • Figure 34: North America Market Volume (Units) Analysis by Frame Design, 2020-2035
  • Figure 35: North America Market Value Share (%) and BPS Analysis by Frame Design, 2025-2035
  • Figure 36: North America Market Y-o-Y Growth (%) Projections by Frame Design, 2025-2035
  • Figure 37: North America Market Value (USD Million) Analysis by Application, 2020-2035
  • Figure 38: North America Market Volume (Units) Analysis by Application, 2020-2035
  • Figure 39: North America Market Value Share (%) and BPS Analysis by Application, 2025-2035
  • Figure 40: North America Market Y-o-Y Growth (%) Projections by Application, 2025-2035
  • Figure 41: North America Market Value (USD Million) Analysis by End User, 2020-2035
  • Figure 42: North America Market Volume (Units) Analysis by End User, 2020-2035
  • Figure 43: North America Market Value Share (%) and BPS Analysis by End User, 2025-2035
  • Figure 44: North America Market Y-o-Y Growth (%) Projections by End User, 2025-2035
  • Figure 45: North America Market Attractiveness by Frame Design, 2025-2035
  • Figure 46: North America Market Attractiveness by Application, 2025-2035
  • Figure 47: North America Market Attractiveness by End User, 2025-2035
  • Figure 48: North America Market Attractiveness by Country, 2025-2035
  • Figure 49: Latin America Market Value (USD Million) by Frame Design, 2025-2035
  • Figure 50: Latin America Market Value (USD Million) by Application, 2025-2035
  • Figure 51: Latin America Market Value (USD Million) by End User, 2025-2035
  • Figure 52: Latin America Market Value (USD Million) by Country, 2025-2035
  • Figure 53: Latin America Market Value (USD Million) Analysis by Country, 2020-2035
  • Figure 54: Latin America Market Volume (Units) Analysis by Country, 2020-2035
  • Figure 55: Latin America Market Value Share (%) and BPS Analysis by Country, 2025-2035
  • Figure 56: Latin America Market Y-o-Y Growth (%) Projections by Country, 2025-2035
  • Figure 57: Latin America Market Value (USD Million) Analysis by Frame Design, 2020-2035
  • Figure 58: Latin America Market Volume (Units) Analysis by Frame Design, 2020-2035
  • Figure 59: Latin America Market Value Share (%) and BPS Analysis by Frame Design, 2025-2035
  • Figure 60: Latin America Market Y-o-Y Growth (%) Projections by Frame Design, 2025-2035
  • Figure 61: Latin America Market Value (USD Million) Analysis by Application, 2020-2035
  • Figure 62: Latin America Market Volume (Units) Analysis by Application, 2020-2035
  • Figure 63: Latin America Market Value Share (%) and BPS Analysis by Application, 2025-2035
  • Figure 64: Latin America Market Y-o-Y Growth (%) Projections by Application, 2025-2035
  • Figure 65: Latin America Market Value (USD Million) Analysis by End User, 2020-2035
  • Figure 66: Latin America Market Volume (Units) Analysis by End User, 2020-2035
  • Figure 67: Latin America Market Value Share (%) and BPS Analysis by End User, 2025-2035
  • Figure 68: Latin America Market Y-o-Y Growth (%) Projections by End User, 2025-2035
  • Figure 69: Latin America Market Attractiveness by Frame Design, 2025-2035
  • Figure 70: Latin America Market Attractiveness by Application, 2025-2035
  • Figure 71: Latin America Market Attractiveness by End User, 2025-2035
  • Figure 72: Latin America Market Attractiveness by Country, 2025-2035
  • Figure 73: East Asia Market Value (USD Million) by Frame Design, 2025-2035
  • Figure 74: East Asia Market Value (USD Million) by Application, 2025-2035
  • Figure 75: East Asia Market Value (USD Million) by End User, 2025-2035
  • Figure 76: East Asia Market Value (USD Million) by Country, 2025-2035
  • Figure 77: East Asia Market Value (USD Million) Analysis by Country, 2020-2035
  • Figure 78: East Asia Market Volume (Units) Analysis by Country, 2020-2035
  • Figure 79: East Asia Market Value Share (%) and BPS Analysis by Country, 2025-2035
  • Figure 80: East Asia Market Y-o-Y Growth (%) Projections by Country, 2025-2035
  • Figure 81: East Asia Market Value (USD Million) Analysis by Frame Design, 2020-2035
  • Figure 82: East Asia Market Volume (Units) Analysis by Frame Design, 2020-2035
  • Figure 83: East Asia Market Value Share (%) and BPS Analysis by Frame Design, 2025-2035
  • Figure 84: East Asia Market Y-o-Y Growth (%) Projections by Frame Design, 2025-2035
  • Figure 85: East Asia Market Value (USD Million) Analysis by Application, 2020-2035
  • Figure 86: East Asia Market Volume (Units) Analysis by Application, 2020-2035
  • Figure 87: East Asia Market Value Share (%) and BPS Analysis by Application, 2025-2035
  • Figure 88: East Asia Market Y-o-Y Growth (%) Projections by Application, 2025-2035
  • Figure 89: East Asia Market Value (USD Million) Analysis by End User, 2020-2035
  • Figure 90: East Asia Market Volume (Units) Analysis by End User, 2020-2035
  • Figure 91: East Asia Market Value Share (%) and BPS Analysis by End User, 2025-2035
  • Figure 92: East Asia Market Y-o-Y Growth (%) Projections by End User, 2025-2035
  • Figure 93: East Asia Market Attractiveness by Frame Design, 2025-2035
  • Figure 94: East Asia Market Attractiveness by Application, 2025-2035
  • Figure 95: East Asia Market Attractiveness by End User, 2025-2035
  • Figure 96: East Asia Market Attractiveness by Country, 2025-2035
  • Figure 97: South Asia Market Value (USD Million) by Frame Design, 2025-2035
  • Figure 98: South Asia Market Value (USD Million) by Application, 2025-2035
  • Figure 99: South Asia Market Value (USD Million) by End User, 2025-2035
  • Figure 100: South Asia Market Value (USD Million) by Country, 2025-2035
  • Figure 101: South Asia Market Value (USD Million) Analysis by Country, 2020-2035
  • Figure 102: South Asia Market Volume (Units) Analysis by Country, 2020-2035
  • Figure 103: South Asia Market Value Share (%) and BPS Analysis by Country, 2025-2035
  • Figure 104: South Asia Market Y-o-Y Growth (%) Projections by Country, 2025-2035
  • Figure 105: South Asia Market Value (USD Million) Analysis by Frame Design, 2020-2035
  • Figure 106: South Asia Market Volume (Units) Analysis by Frame Design, 2020-2035
  • Figure 107: South Asia Market Value Share (%) and BPS Analysis by Frame Design, 2025-2035
  • Figure 108: South Asia Market Y-o-Y Growth (%) Projections by Frame Design, 2025-2035
  • Figure 109: South Asia Market Value (USD Million) Analysis by Application, 2020-2035
  • Figure 110: South Asia Market Volume (Units) Analysis by Application, 2020-2035
  • Figure 111: South Asia Market Value Share (%) and BPS Analysis by Application, 2025-2035
  • Figure 112: South Asia Market Y-o-Y Growth (%) Projections by Application, 2025-2035
  • Figure 113: South Asia Market Value (USD Million) Analysis by End User, 2020-2035
  • Figure 114: South Asia Market Volume (Units) Analysis by End User, 2020-2035
  • Figure 115: South Asia Market Value Share (%) and BPS Analysis by End User, 2025-2035
  • Figure 116: South Asia Market Y-o-Y Growth (%) Projections by End User, 2025-2035
  • Figure 117: South Asia Market Attractiveness by Frame Design, 2025-2035
  • Figure 118: South Asia Market Attractiveness by Application, 2025-2035
  • Figure 119: South Asia Market Attractiveness by End User, 2025-2035
  • Figure 120: South Asia Market Attractiveness by Country, 2025-2035
  • Figure 121: Western Europe Market Value (USD Million) by Frame Design, 2025-2035
  • Figure 122: Western Europe Market Value (USD Million) by Application, 2025-2035
  • Figure 123: Western Europe Market Value (USD Million) by End User, 2025-2035
  • Figure 124: Western Europe Market Value (USD Million) by Country, 2025-2035
  • Figure 125: Western Europe Market Value (USD Million) Analysis by Country, 2020-2035
  • Figure 126: Western Europe Market Volume (Units) Analysis by Country, 2020-2035
  • Figure 127: Western Europe Market Value Share (%) and BPS Analysis by Country, 2025-2035
  • Figure 128: Western Europe Market Y-o-Y Growth (%) Projections by Country, 2025-2035
  • Figure 129: Western Europe Market Value (USD Million) Analysis by Frame Design, 2020-2035
  • Figure 130: Western Europe Market Volume (Units) Analysis by Frame Design, 2020-2035
  • Figure 131: Western Europe Market Value Share (%) and BPS Analysis by Frame Design, 2025-2035
  • Figure 132: Western Europe Market Y-o-Y Growth (%) Projections by Frame Design, 2025-2035
  • Figure 133: Western Europe Market Value (USD Million) Analysis by Application, 2020-2035
  • Figure 134: Western Europe Market Volume (Units) Analysis by Application, 2020-2035
  • Figure 135: Western Europe Market Value Share (%) and BPS Analysis by Application, 2025-2035
  • Figure 136: Western Europe Market Y-o-Y Growth (%) Projections by Application, 2025-2035
  • Figure 137: Western Europe Market Value (USD Million) Analysis by End User, 2020-2035
  • Figure 138: Western Europe Market Volume (Units) Analysis by End User, 2020-2035
  • Figure 139: Western Europe Market Value Share (%) and BPS Analysis by End User, 2025-2035
  • Figure 140: Western Europe Market Y-o-Y Growth (%) Projections by End User, 2025-2035
  • Figure 141: Western Europe Market Attractiveness by Frame Design, 2025-2035
  • Figure 142: Western Europe Market Attractiveness by Application, 2025-2035
  • Figure 143: Western Europe Market Attractiveness by End User, 2025-2035
  • Figure 144: Western Europe Market Attractiveness by Country, 2025-2035
  • Figure 145: Eastern Europe Market Value (USD Million) by Frame Design, 2025-2035
  • Figure 146: Eastern Europe Market Value (USD Million) by Application, 2025-2035
  • Figure 147: Eastern Europe Market Value (USD Million) by End User, 2025-2035
  • Figure 148: Eastern Europe Market Value (USD Million) by Country, 2025-2035
  • Figure 149: Eastern Europe Market Value (USD Million) Analysis by Country, 2020-2035
  • Figure 150: Eastern Europe Market Volume (Units) Analysis by Country, 2020-2035
  • Figure 151: Eastern Europe Market Value Share (%) and BPS Analysis by Country, 2025-2035
  • Figure 152: Eastern Europe Market Y-o-Y Growth (%) Projections by Country, 2025-2035
  • Figure 153: Eastern Europe Market Value (USD Million) Analysis by Frame Design, 2020-2035
  • Figure 154: Eastern Europe Market Volume (Units) Analysis by Frame Design, 2020-2035
  • Figure 155: Eastern Europe Market Value Share (%) and BPS Analysis by Frame Design, 2025-2035
  • Figure 156: Eastern Europe Market Y-o-Y Growth (%) Projections by Frame Design, 2025-2035
  • Figure 157: Eastern Europe Market Value (USD Million) Analysis by Application, 2020-2035
  • Figure 158: Eastern Europe Market Volume (Units) Analysis by Application, 2020-2035
  • Figure 159: Eastern Europe Market Value Share (%) and BPS Analysis by Application, 2025-2035
  • Figure 160: Eastern Europe Market Y-o-Y Growth (%) Projections by Application, 2025-2035
  • Figure 161: Eastern Europe Market Value (USD Million) Analysis by End User, 2020-2035
  • Figure 162: Eastern Europe Market Volume (Units) Analysis by End User, 2020-2035
  • Figure 163: Eastern Europe Market Value Share (%) and BPS Analysis by End User, 2025-2035
  • Figure 164: Eastern Europe Market Y-o-Y Growth (%) Projections by End User, 2025-2035
  • Figure 165: Eastern Europe Market Attractiveness by Frame Design, 2025-2035
  • Figure 166: Eastern Europe Market Attractiveness by Application, 2025-2035
  • Figure 167: Eastern Europe Market Attractiveness by End User, 2025-2035
  • Figure 168: Eastern Europe Market Attractiveness by Country, 2025-2035
  • Figure 169: Middle East & Africa Market Value (USD Million) by Frame Design, 2025-2035
  • Figure 170: Middle East & Africa Market Value (USD Million) by Application, 2025-2035
  • Figure 171: Middle East & Africa Market Value (USD Million) by End User, 2025-2035
  • Figure 172: Middle East & Africa Market Value (USD Million) by Country, 2025-2035
  • Figure 173: Middle East & Africa Market Value (USD Million) Analysis by Country, 2020-2035
  • Figure 174: Middle East & Africa Market Volume (Units) Analysis by Country, 2020-2035
  • Figure 175: Middle East & Africa Market Value Share (%) and BPS Analysis by Country, 2025-2035
  • Figure 176: Middle East & Africa Market Y-o-Y Growth (%) Projections by Country, 2025-2035
  • Figure 177: Middle East & Africa Market Value (USD Million) Analysis by Frame Design, 2020-2035
  • Figure 178: Middle East & Africa Market Volume (Units) Analysis by Frame Design, 2020-2035
  • Figure 179: Middle East & Africa Market Value Share (%) and BPS Analysis by Frame Design, 2025-2035
  • Figure 180: Middle East & Africa Market Y-o-Y Growth (%) Projections by Frame Design, 2025-2035
  • Figure 181: Middle East & Africa Market Value (USD Million) Analysis by Application, 2020-2035
  • Figure 182: Middle East & Africa Market Volume (Units) Analysis by Application, 2020-2035
  • Figure 183: Middle East & Africa Market Value Share (%) and BPS Analysis by Application, 2025-2035
  • Figure 184: Middle East & Africa Market Y-o-Y Growth (%) Projections by Application, 2025-2035
  • Figure 185: Middle East & Africa Market Value (USD Million) Analysis by End User, 2020-2035
  • Figure 186: Middle East & Africa Market Volume (Units) Analysis by End User, 2020-2035
  • Figure 187: Middle East & Africa Market Value Share (%) and BPS Analysis by End User, 2025-2035
  • Figure 188: Middle East & Africa Market Y-o-Y Growth (%) Projections by End User, 2025-2035
  • Figure 189: Middle East & Africa Market Attractiveness by Frame Design, 2025-2035
  • Figure 190: Middle East & Africa Market Attractiveness by Application, 2025-2035
  • Figure 191: Middle East & Africa Market Attractiveness by End User, 2025-2035
  • Figure 192: Middle East & Africa Market Attractiveness by Country, 2025-2035

Frequently Asked Questions

How big is the nitinol heart valve frames market in 2025?

The global nitinol heart valve frame is estimated to be valued at USD 756.3 million in 2025.

What will be the size of the nitinol heart valve frames market in 2035?

The market size for the nitinol heart valve frames market is projected to reach approximately USD 1,174.5 million by 2035.

How much will the nitinol heart valve frames market grow between 2025 and 2035?

The nitinol heart valve frames market is expected to grow at a CAGR of 4.5% between 2025 and 2035.

What are the key frame design formats in the nitinol heart valve frames market?

The key frame designs in the nitinol heart valve frames market include open-cell, closed cell and hybrid.

Which end user segment will contribute a significant share in the nitinol heart valve frames market in 2025?

In terms of end user, the hospitals segment is projected to command the highest share at 73.3% in the Nitinol heart valve frames market in 2025.

Explore Similar Insights

Future Market Insights

Nitinol Heart Valve Frames Market