Bicycle Frames Market Size, Share, and Forecast Outlook 2025 to 2035

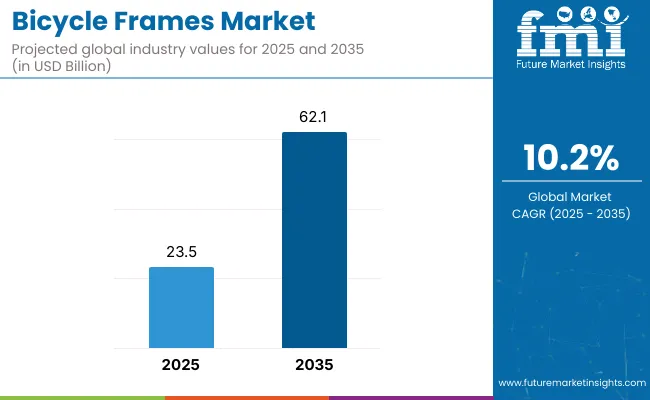
The bicycle frames market is valued at USD 23.5 billion in 2025 and is projected to reach about USD 62.1 billion by 2035, advancing at a compound annual growth rate of 10.2%. The multiplying factor for this period is approximately 2.6x, meaning the market in 2035 will be over two and a half times the 2025 base.
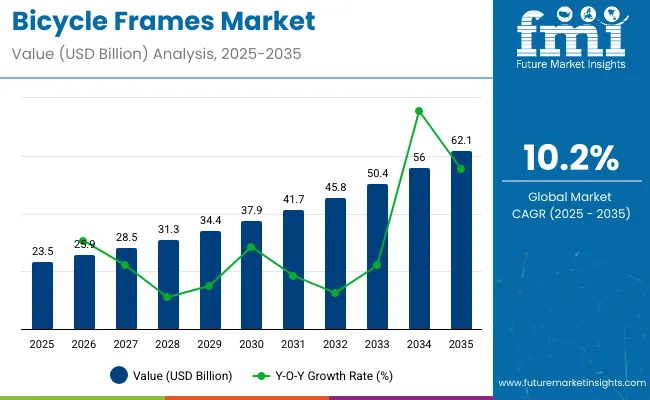
Bicycle Frames Market 1

Quick Stats of Bicycle Frames Market

  • Bicycle Frames Market Size (2025): USD 23.5 billion
  • Projected Bicycle Frames Market Size (2035): USD 62.1 billion
  • CAGR of Bicycle Frames Market (2025 to 2035): 10.2%
  • Leading Segment (2025): Mountain Bicycle (based on popularity trends)
  • Key Growth Regions: North America, Europe, Asia Pacific
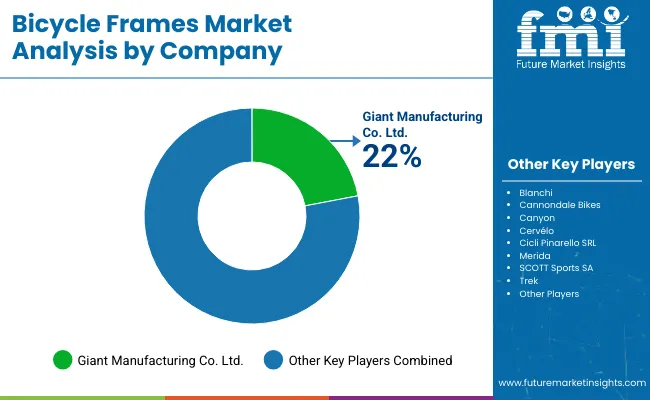
  • Top Key Player: Giant Manufacturing Co. Ltd., holding 22% industry share

Bicycle Frames Market

Metric Value
Market Estimated Value in (2025E) USD 23.5 billion
Market Forecast Value in (2035F) USD 62.1 billion
Forecast CAGR (2025 to 2035) 10.2%

An analysis of elasticity of growth in relation to macroeconomic indicators shows a strong linkage between consumer purchasing power, urban mobility trends, and health-focused lifestyles.

During periods of economic expansion, higher disposable incomes and greater investment in recreational activities significantly increase demand for premium and lightweight frames, particularly carbon fiber and aluminum variants. Rising fuel costs and urban congestion also act as macroeconomic drivers that enhance market elasticity, pushing consumers toward bicycles as an affordable and sustainable mobility option.

In contrast, economic slowdowns may reduce discretionary spending, temporarily softening growth in premium segments, although entry-level and mid-range frames tend to remain resilient due to their affordability. Health awareness campaigns, infrastructure investment in cycling lanes, and government incentives for eco-friendly transport further enhance elasticity by amplifying demand regardless of short-term fluctuations. This close interaction with macroeconomic indicators underscores the bicycle frames market’s responsiveness and long-term growth potential.

The market sits within several interconnected parent industries. Bicycle manufacturing contributes close to 40%, as frame design and production form the backbone of the cycling industry. Metals and alloys industry accounts for about 25%, supplying aluminum, steel, and titanium widely used in frame building. Composite materials sector represents nearly 15%, driven by the adoption of carbon fiber and advanced polymers for high-performance bikes. Sports and fitness equipment market holds around 12%, where cycling aligns with lifestyle and recreational demand. Logistics and aftermarket services carry close to 8%, covering distribution, repairs, and customization support.

The market is advancing with new materials, design innovations, and manufacturing methods. Carbon fiber and hybrid composites are increasingly used to improve stiffness-to-weight ratios in high-performance and racing models. Aluminum alloys remain dominant in mid-range bikes due to affordability and durability, while titanium is carving a niche in premium custom frames.

Automation and 3D printing are streamlining prototyping and enabling complex geometries that were previously unattainable. Sustainability goals are encouraging the use of recyclable materials and eco-friendly coatings. Partnerships between frame manufacturers and bike brands are driving lightweight, aerodynamic, and ergonomic frame designs tailored to both professionals and recreational riders.

Top Bicycle Frames Market Dynamics

The bicycle frames market is valued at USD 23.5 billion in 2025 and is projected to reach USD 62.1 billion by 2035, expanding at a CAGR of 10.2%. Asia Pacific contributes more than 40% of total demand, while Europe and North America are strong in premium and e-bike segments. Aluminum frames dominate volume sales, carbon fiber is expanding in high-performance categories, and titanium maintains a stable position in niche endurance markets. Rising replacement rates, growing health awareness, and e-bike adoption continue to reinforce steady frame demand worldwide.

Driving Force Rising Fitness Participation and Material Transition

Fitness awareness and cycling adoption are fueling frame demand, with urban ridership adding millions of new consumers each year. Aluminum frames represent nearly 36% of global market share, offering affordability and up to 25% weight reduction compared to steel. Carbon fiber adoption is advancing at above 11% annually, benefiting competitive road, gravel, and mountain segments. Titanium frames account for under 5% but maintain resale value and durability. In Europe, nearly 37 million regular cyclists drive recurring frame sales, with replacement cycles averaging 5 years. These factors sustain consistent revenue growth, particularly in mid- to premium-level bicycles where material innovation enhances riding efficiency.

Growth Avenue Expansion of E-Bikes and Aftermarket Sales

E-bikes account for over 23% of global bicycle sales in 2025, directly impacting demand for specialized frames designed to handle higher torque and integrated batteries. Europe sold nearly 6.5 million e-bikes last year, strengthening the regional aftermarket and OEM segments. Reinforced aluminum alloys and composite frames dominate e-bike builds, creating new revenue streams for suppliers. Aftermarket replacement is valued above USD 8.5 billion annually, supported by customization trends and recurring upgrades. Online platforms already capture more than 21% of frame sales, posting double-digit growth as brands adopt direct-to-consumer models. This shift strengthens both aftermarket potential and profitability for global manufacturers.

Emerging Trend Advanced Manufacturing and Customization Growth

Digital manufacturing methods are transforming production cycles. 3D printing and automated fiber placement reduce prototyping time by 55% and cut scrap by more than 15%. Recycled aluminum now represents close to 16% of total frame output, reducing energy costs by nearly 12% per unit. Custom geometry programs account for about 11% of premium frame sales, allowing riders to optimize fit and ride performance. Modular frame platforms extend lifespan by supporting part upgrades rather than full replacements. These advancements align with rising demand for personalized and efficient bicycles, providing manufacturers with scalable solutions that balance innovation, cost, and consumer preference.

Market Challenge High Material Costs and Supply Chain Pressures

Carbon fiber frames average between USD 2,200 and USD 6,800 in premium categories, creating affordability barriers for mid-income buyers. Titanium, while only 3% of market share, averages USD 3,600 per frame, confining it to niche segments. Aluminum prices have increased nearly 12% in the last three years, straining manufacturer margins. Supply chain bottlenecks extend carbon composite lead times from 3 months to more than 6 months, delaying production schedules. Smaller brands lack economies of scale, making them more vulnerable to fluctuations in raw material costs and logistics expenses. These challenges increase overall retail prices by 9-13% across global markets.

Analyzing Bicycle Frames Market by Top Investment Segments

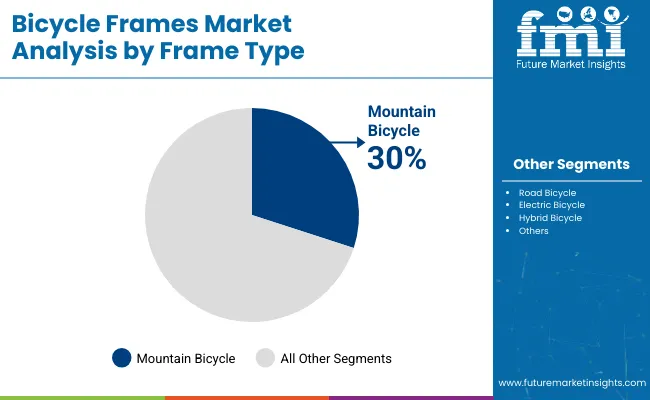
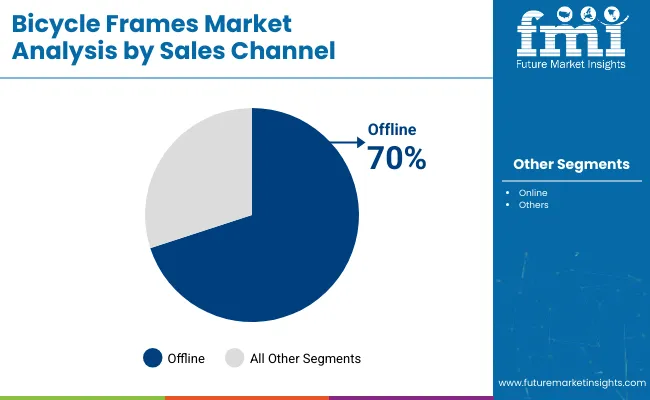
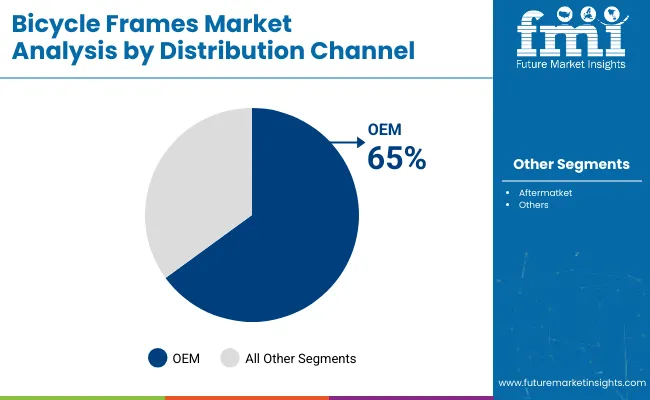
The bicycle frames market is driven by material, frame type, sales channel, and distribution channel. Aluminium leads with 40% share, carbon fiber 25%, steel 20%, titanium 10%, and others 5%. Mountain bicycles hold 30% share, followed by road 25%, electric 20%, and hybrid 15%. Offline sales dominate at 70%, online at 30%. OEM distribution captures 65%, aftermarket 35%. Understanding these segments helps manufacturers prioritize production, optimize supply chains, and target marketing campaigns efficiently, while ensuring alignment with evolving consumer preferences across premium and mass market segments.
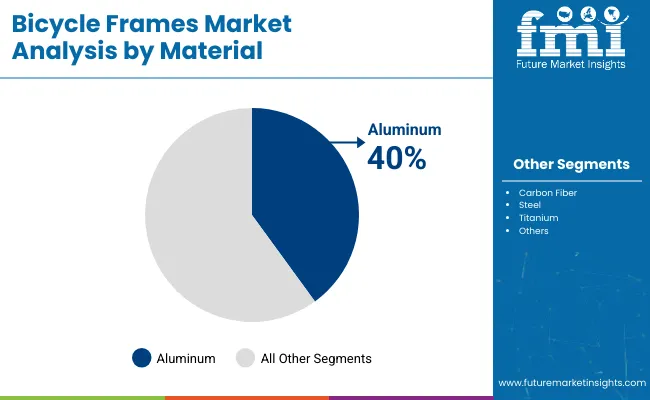
Aluminium Dominates Material Investment with 40% Share

Bicycle Frames Market By Material

Aluminium remains the preferred choice for bicycle frames due to lightweight construction and high corrosion resistance, accounting for 40% of material use. Carbon fiber holds 25%, valued for stiffness and competitive racing performance. Steel captures 20%, commonly used for durability and budget-friendly models. Titanium frames cover 10%, targeting premium users, while other materials represent 5% for specialized designs. Material selection impacts production techniques, costs, and end-user pricing. Manufacturers balance aluminium for mass production while reserving carbon fiber and titanium for niche applications, ensuring a mix of affordability and performance across the market.
  • Aluminium reduces weight and enhances frame longevity
  • Carbon fiber offers stiffness ideal for racing bicycles
  • Steel provides durability and affordability in standard models

Mountain Bicycles Lead Frame Type at 30%

Bicycle Frames Market By Frame Type

Mountain bicycles dominate frame type with 30% share due to off-road performance and versatility. Road bicycles follow at 25%, preferred for speed and long-distance riding. Electric bicycles account for 20%, reflecting urban mobility and recreational use, while hybrid bicycles hold 15%, blending features from multiple categories. Frame design influences geometry, suspension, and rider comfort, guiding production and marketing efforts. Brands adjust inventory according to consumer demand for each type, balancing high-volume mountain and road bikes with growth in electric and hybrid models, responding to both sport-focused and casual cycling trends.
  • Mountain frames designed for rough terrain and endurance
  • Road frames optimized for aerodynamic performance and speed
  • Hybrid models merge comfort and multi-purpose functionality

Offline Channels Drive 70% of Sales Revenue

Bicycle Frames Market By Sales Channel

Offline sales dominate at 70%, allowing in-store experiences, test rides, and personalized fittings. Retailers benefit from direct interaction with customers and immediate purchase decisions. Online channels contribute 30%, facilitating convenience shopping and broad geographic reach. Sales channel choice impacts marketing strategies, promotional campaigns, and inventory distribution. Strong offline presence ensures brand visibility and consumer trust, while online platforms support supplementary sales, seasonal promotions, and wider accessibility. Companies leverage offline dominance for brand engagement events and workshops to improve customer retention and loyalty.
  • In-store experience encourages trial and purchase decisions
  • Offline retail allows demonstrations and personalized fittings
  • Online channels expand reach and provide convenience-based shopping

OEM Distribution Leads with 65% Share

Bicycle Frames Market By Distribution Channel

OEM distribution holds 65% share, supplying frames directly to manufacturers or brands, ensuring consistent quality and production efficiency. Aftermarket covers 35%, supporting repairs, upgrades, and accessories. OEM channels reduce intermediary costs and standardize product offerings, while aftermarket ensures continued customer engagement post-purchase. Distribution strategies affect logistics, supplier partnerships, and pricing models. Brands monitor the split to balance new production and parts availability, optimize delivery timelines, and meet market demand effectively. Strategic distribution planning helps maintain profitability while catering to both mass-market and premium segments.
  • OEM channels streamline production and reduce costs
  • Aftermarket supports repairs, upgrades, and extended lifecycle
  • Distribution planning ensures timely delivery and inventory management

Top Countries Manufacturing, Expanding, and Advancing the Bicycle Frames Market

Country Wise Bicycle Frames Market

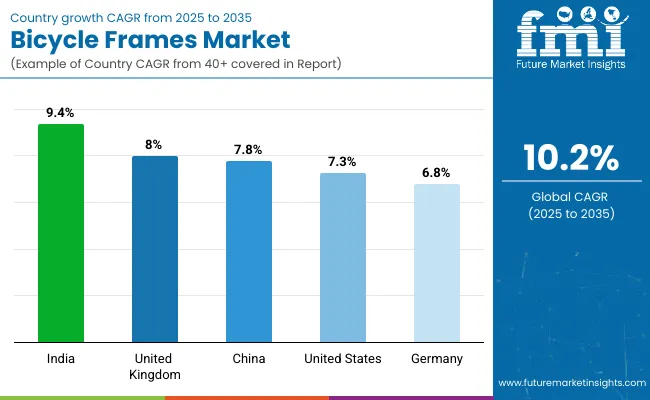
The global bicycle frames market is increasing at a CAGR of 10.2% from 2025 to 2035. India records 9.4%, −8% below the global rate, primarily due to rising domestic cycling demand supported by BRICS and ASEAN-linked urban mobility initiatives. China follows at 7.8%, −24% under the global CAGR, reflecting its large-scale BRICS-oriented production focused on exports rather than domestic consumption. The United Kingdom stands at 8%, −22% below the global average, with growth limited by a mature market and moderate adoption of premium bicycle segments. The United States posts 7.3%, −28% compared with the global rate, influenced by OECD-focused technological improvements but slower expansion in commuter cycling. Germany records 6.8%, −33% under the global CAGR, constrained by saturation in high-end bicycle demand and steady, incremental production. Overall, BRICS nations like India and China are leading expansion, while OECD markets are progressing steadily with technology-driven and niche-focused growth.

Growth Analysis of Bicycle Frames Market in China

The bicycle frames market in China is likely to grow at a CAGR of 7.8%, below the global 10.2%. Growth is driven by expanding e-bike manufacturing, integration of lightweight alloys, and rising exports to Europe and North America. Despite a strong domestic production base, the CAGR remains lower than global averages due to market maturity and saturation in urban cycling segments. By 2030, China is expected to account for nearly 28% of global revenue, with steel and aluminum frames continuing to dominate the market.

  • Aluminum frame production projected to grow 6.5% annually
  • E-bike frame segment expected to represent 40% of revenue by 2030
  • Export volume to Europe forecast to rise 5.5% annually

Bicycle Frames Market Growth Outlook in India

India is expanding at a CAGR of 9.4%, slightly below the global 10.2%. Rapid adoption of sports bicycles, increasing interest in health-focused lifestyles, and local manufacturing expansions contribute to growth. By 2030, India is expected to capture 12% of the global market. Growth is concentrated in aluminum and carbon fiber frames, with domestic brands collaborating with international players to improve quality and design. The slightly lower CAGR reflects infrastructure and supply chain limitations affecting production scaling.

  • Aluminum and carbon fiber frames expected to grow 10% annually
  • Domestic bicycle brands projected to account for 60% of market share by 2030
  • Sports bicycle sales forecast to expand 11% annually

Future Outlook for Bicycle Frames Market in Germany

The market in Germany is projected to grow at a CAGR of 6.8%, below the global 10.2%. Growth is supported by rising demand for e-bikes and high-performance frames for competitive cycling. However, established market saturation and limited expansion opportunities keep CAGR lower than global averages. By 2030, Germany is expected to hold 10% of the European bicycle frame market, with carbon fiber frames gaining prominence among professional cyclists. Government initiatives for cycling-friendly infrastructure contribute indirectly to demand.

  • Carbon fiber frame adoption expected to increase 8% annually
  • E-bike frame production projected to grow 6% per year
  • High-performance competitive cycling frames forecast to cover 35% of revenue

Growth Analysis of Bicycle Frames Market in the United States

The United States market is expanding at a CAGR of 7.3%, below the global 10.2%. Growth is largely fueled by rising popularity of mountain bikes and e-bikes, with aluminum frames dominating the production mix. By 2030, the US market is projected to represent 15% of global revenue. Market maturity and high competition contribute to the slower CAGR. Focus on lightweight and customizable frames drives the premium segment, while overall market growth remains steady.

  • Mountain bike frame segment projected to grow 8% annually
  • E-bike frames expected to cover 30% of total production by 2030
  • Lightweight and customizable frames forecast to expand 7.5% annually

Future Outlook for Bicycle Frames Market in the United Kingdom

The United Kingdom is growing at a CAGR of 8%, below the global 10.2%. Growth is supported by increasing recreational cycling and investments in urban cycling infrastructure. By 2030, the UK market is expected to account for 7% of global revenue. Carbon fiber and aluminum frames are driving premium segment demand, while steel frames remain popular for budget-friendly bicycles. Market expansion is moderate due to limited domestic manufacturing and reliance on imports.
  • Recreational bicycle frame sales projected to grow 9% annually
  • Carbon fiber and aluminum frames expected to cover 50% of premium market
  • Import reliance forecast to reduce local manufacturing CAGR by 1.5%

Leading Bicycle Frames Manufacturers, Suppliers, Distributors

Bicycle Frames Market By Company

Industry Leader - Giant Manufacturing Co. Ltd. - 22%

The bicycle frames market is shaped by established brands that continue to focus on product development, material research, and distribution expansion to strengthen their positions. Giant Manufacturing Co. Ltd. has maintained a strong presence by investing in lightweight alloy and carbon fiber frames while extending its partnerships with global distributors. Trekfocus on high-performance models and has introduced advanced frame designs to target professional racing as well as consumer segments. Cannondale Bikes continues to develop innovative frame geometries and collaborates with professional cycling teams to boost visibility. Cervélo and Cicli Pinarello SRL remain strong in the premium segment, with a focus on aerodynamic designs and sponsorship of competitive cycling events.

Emerging strategies also include diversification across price categories and regional expansion. Merida and SCOTT Sports SA are focusing on mid-range and performance-oriented frames while expanding their dealer networks in Asia and Europe. Canyon has gained attention through direct-to-consumer sales models that reduce costs and improve accessibility to advanced frame designs. Bianchi, known for its heritage in cycling, continues to blend tradition with modern design by releasing limited edition frames for enthusiasts. These strategies, including product launches, R&D efforts, and team partnerships, highlight how both established and emerging companies are shaping the bicycle frames market.

Recent Industry News

  • In March 2024, Gaint Manufacturing launched the G-Force E-Trail, an electric mountain bike with an alloy frame and 140mm travel suspension for versatile off-road performance.
  • In February 2024, Trek introduced the E-Caliber, an electric cross-country bike with a lightweight alloy frame, agile geometry, and 100mm travel suspension for efficient XC trail handling.

Leading Players

  • Giant Manufacturing Co. Ltd.
  • Trek
  • Merida
  • SCOTT Sports SA
  • Cannondale Bikes
  • Canyon
  • Cervélo
  • CicliPinarello SRL
  • Bianchi

Report Scope

Report Attributes Details
Market Size (2025) USD 23.5 billion
Projected Market Size (2035) USD 62.1 billion
CAGR (2025 to 2035) 10.2%
Base Year for Estimation 2024
Historical Period 2020 to 2024
Projection Period 2025 to 2035
Quantitative Units USD billion for value
Material Segments Analyzed Aluminum, Steel, Carbon Fiber, Titanium, Others
Frame Type Segments Analyzed Mountain Bicycle, Hybrid Bicycle, Electric Bicycle, Road Bicycle, Others
Sales Channels Online, Offline
Distribution Channels OEM, Aftermarket
Regions Covered North America, Europe, Asia Pacific, Latin America, Middle East and Africa
Countries Covered United States, Canada, Germany, France, Italy, United Kingdom, China, Japan, India, Brazil, Mexico, UAE, South Africa, others
Key Players Influencing the Market Giant Manufacturing Co. Ltd., Trek, Merida, SCOTT Sports SA, Cannondale Bikes, Canyon, Cervélo , Cicli Pinarello SRL, Bianchi
Additional Attributes Dollar sales by frame material and bicycle type, demand dynamics across road bikes, mountain bikes, and e-bikes, regional adoption trends across Asia-Pacific, Europe, and North America, innovation in carbon fiber composites, lightweight alloys, and aerodynamic designs, environmental impact of material recyclability and production waste, emerging use cases in connected bikes, custom 3D-printed frames, high-performance sports cycling

Bicycle Frames Market Analyzed by Key Investment Segments 

By Material:

  • Aluminum
  • Steel
  • Carbon Fiber
  • Titanium
  • Others

By Frame Type:

  • Mountain Bicycle
  • Hybrid Bicycle
  • Electric Bicycle
  • Road Bicycle
  • Others

By Sales Channel:

  • Online
  • Offline

By Distribution Channel:

  • OEM
  • Aftermarket

By Region:

  • North America
  • Europe
  • Asia Pacific
  • Latin America
  • Middle East and Africa

Table of Content

  1. Executive Summary
    • Global Market Outlook
    • Demand-side Trends
    • Supply-side Trends
    • Technology Roadmap Analysis
    • Analysis and Recommendations
  2. Market Overview
    • Market Coverage / Taxonomy
    • Market Definition / Scope / Limitations
  3. Market Background
    • Market Dynamics
      • Drivers
      • Restraints
      • Opportunity
      • Trends
    • Scenario Forecast
      • Demand in Optimistic Scenario
      • Demand in Likely Scenario
      • Demand in Conservative Scenario
    • Opportunity Map Analysis
    • Product Life Cycle Analysis
    • Supply Chain Analysis
      • Supply Side Participants and their Roles
        • Producers
        • Mid-Level Participants (Traders/ Agents/ Brokers)
        • Wholesalers and Distributors
      • Value Added and Value Created at Node in the Supply Chain
      • List of Raw Material Suppliers
      • List of Existing and Potential Buyer’s
    • Investment Feasibility Matrix
    • Value Chain Analysis
      • Profit Margin Analysis
      • Wholesalers and Distributors
      • Retailers
    • PESTLE and Porter’s Analysis
    • Regulatory Landscape
      • By Key Regions
      • By Key Countries
    • Regional Parent Market Outlook
    • Production and Consumption Statistics
    • Import and Export Statistics
  4. Global Market Analysis 2020 to 2024 and Forecast, 2025 to 2035
    • Historical Market Size Value (USD Billion) & Volume (Thousand Units) Analysis, 2020 to 2024
    • Current and Future Market Size Value (USD Billion) & Volume (Thousand Units) Projections, 2025 to 2035
      • Y-o-Y Growth Trend Analysis
      • Absolute $ Opportunity Analysis
  5. Global Market Pricing Analysis 2020 to 2024 and Forecast 2025 to 2035
  6. Global Market Analysis 2020 to 2024 and Forecast 2025 to 2035, By Material
    • Introduction / Key Findings
    • Historical Market Size Value (USD Billion) & Volume (Thousand Units) Analysis By Material, 2020 to 2024
    • Current and Future Market Size Value (USD Billion) & Volume (Thousand Units) Analysis and Forecast By Material, 2025 to 2035
      • Aluminum
      • Carbon Fiber
      • Steel
      • Titanium
      • Others
    • Y-o-Y Growth Trend Analysis By Material, 2020 to 2024
    • Absolute $ Opportunity Analysis By Material, 2025 to 2035
  7. Global Market Analysis 2020 to 2024 and Forecast 2025 to 2035, By Frame Type
    • Introduction / Key Findings
    • Historical Market Size Value (USD Billion) & Volume (Thousand Units) Analysis By Frame Type, 2020 to 2024
    • Current and Future Market Size Value (USD Billion) & Volume (Thousand Units) Analysis and Forecast By Frame Type, 2025 to 2035
      • Mountain Bicycle
      • Road Bicycle
      • Electric Bicycle
      • Hybrid Bicycle
      • Others
    • Y-o-Y Growth Trend Analysis By Frame Type, 2020 to 2024
    • Absolute $ Opportunity Analysis By Frame Type, 2025 to 2035
  8. Global Market Analysis 2020 to 2024 and Forecast 2025 to 2035, By Sales Channel
    • Introduction / Key Findings
    • Historical Market Size Value (USD Billion) & Volume (Thousand Units) Analysis By Sales Channel, 2020 to 2024
    • Current and Future Market Size Value (USD Billion) & Volume (Thousand Units) Analysis and Forecast By Sales Channel, 2025 to 2035
      • Offline
      • Online
    • Y-o-Y Growth Trend Analysis By Sales Channel, 2020 to 2024
    • Absolute $ Opportunity Analysis By Sales Channel, 2025 to 2035
  9. Global Market Analysis 2020 to 2024 and Forecast 2025 to 2035, By Distribution Channel
    • Introduction / Key Findings
    • Historical Market Size Value (USD Billion) & Volume (Thousand Units) Analysis By Distribution Channel, 2020 to 2024
    • Current and Future Market Size Value (USD Billion) & Volume (Thousand Units) Analysis and Forecast By Distribution Channel, 2025 to 2035
      • OEM
      • Aftermarket
    • Y-o-Y Growth Trend Analysis By Distribution Channel, 2020 to 2024
    • Absolute $ Opportunity Analysis By Distribution Channel, 2025 to 2035
  10. Global Market Analysis 2020 to 2024 and Forecast 2025 to 2035, By Region
    • Introduction
    • Historical Market Size Value (USD Billion) & Volume (Thousand Units) Analysis By Region, 2020 to 2024
    • Current Market Size Value (USD Billion) & Volume (Thousand Units) Analysis and Forecast By Region, 2025 to 2035
      • North America
      • Latin America
      • Western Europe
      • Eastern Europe
      • East Asia
      • South Asia & Pacific
      • Middle East and Africa
    • Market Attractiveness Analysis By Region
  11. North America Market Analysis 2020 to 2024 and Forecast 2025 to 2035, By Country
    • Historical Market Size Value (USD Billion) & Volume (Thousand Units) Trend Analysis By Market Taxonomy, 2020 to 2024
    • Market Size Value (USD Billion) & Volume (Thousand Units) Forecast By Market Taxonomy, 2025 to 2035
      • By Country
        • USA
        • Canada
        • Mexico
      • By Material
      • By Frame Type
      • By Sales Channel
      • By Distribution Channel
    • Market Attractiveness Analysis
      • By Country
      • By Material
      • By Frame Type
      • By Sales Channel
      • By Distribution Channel
    • Key Takeaways
  12. Latin America Market Analysis 2020 to 2024 and Forecast 2025 to 2035, By Country
    • Historical Market Size Value (USD Billion) & Volume (Thousand Units) Trend Analysis By Market Taxonomy, 2020 to 2024
    • Market Size Value (USD Billion) & Volume (Thousand Units) Forecast By Market Taxonomy, 2025 to 2035
      • By Country
        • Brazil
        • Argentina
        • Rest of LATAM
      • By Material
      • By Frame Type
      • By Sales Channel
      • By Distribution Channel
    • Market Attractiveness Analysis
      • By Country
      • By Material
      • By Frame Type
      • By Sales Channel
      • By Distribution Channel
    • Key Takeaways
  13. Western Europe Market Analysis 2020 to 2024 and Forecast 2025 to 2035, By Country
    • Historical Market Size Value (USD Billion) & Volume (Thousand Units) Trend Analysis By Market Taxonomy, 2020 to 2024
    • Market Size Value (USD Billion) & Volume (Thousand Units) Forecast By Market Taxonomy, 2025 to 2035
      • By Country
        • Germany
        • Italy
        • France
        • UK
        • Spain
        • BENELUX
        • Nordic
        • Rest of W.Europe
      • By Material
      • By Frame Type
      • By Sales Channel
      • By Distribution Channel
    • Market Attractiveness Analysis
      • By Country
      • By Material
      • By Frame Type
      • By Sales Channel
      • By Distribution Channel
    • Key Takeaways
  14. Eastern Europe Market Analysis 2020 to 2024 and Forecast 2025 to 2035, By Country
    • Historical Market Size Value (USD Billion) & Volume (Thousand Units) Trend Analysis By Market Taxonomy, 2020 to 2024
    • Market Size Value (USD Billion) & Volume (Thousand Units) Forecast By Market Taxonomy, 2025 to 2035
      • By Country
        • Russia
        • Hungary
        • Poland
        • Balkan & Baltics
        • Rest of E. Europe
      • By Material
      • By Frame Type
      • By Sales Channel
      • By Distribution Channel
    • Market Attractiveness Analysis
      • By Country
      • By Material
      • By Frame Type
      • By Sales Channel
      • By Distribution Channel
    • Key Takeaways
  15. East Asia Market Analysis 2020 to 2024 and Forecast 2025 to 2035, By Country
    • Historical Market Size Value (USD Billion) & Volume (Thousand Units) Trend Analysis By Market Taxonomy, 2020 to 2024
    • Market Size Value (USD Billion) & Volume (Thousand Units) Forecast By Market Taxonomy, 2025 to 2035
      • By Country
        • China
        • Japan
        • South Korea
      • By Material
      • By Frame Type
      • By Sales Channel
      • By Distribution Channel
    • Market Attractiveness Analysis
      • By Country
      • By Material
      • By Frame Type
      • By Sales Channel
      • By Distribution Channel
    • Key Takeaways
  16. South Asia & Pacific Market Analysis 2020 to 2024 and Forecast 2025 to 2035, By Country
    • Historical Market Size Value (USD Billion) & Volume (Thousand Units) Trend Analysis By Market Taxonomy, 2020 to 2024
    • Market Size Value (USD Billion) & Volume (Thousand Units) Forecast By Market Taxonomy, 2025 to 2035
      • By Country
        • India
        • Australia & New Zealand
        • ASEAN
        • Rest of SAP
      • By Material
      • By Frame Type
      • By Sales Channel
      • By Distribution Channel
    • Market Attractiveness Analysis
      • By Country
      • By Material
      • By Frame Type
      • By Sales Channel
      • By Distribution Channel
    • Key Takeaways
  17. Middle East and Africa Market Analysis 2020 to 2024 and Forecast 2025 to 2035, By Country
    • Historical Market Size Value (USD Billion) & Volume (Thousand Units) Trend Analysis By Market Taxonomy, 2020 to 2024
    • Market Size Value (USD Billion) & Volume (Thousand Units) Forecast By Market Taxonomy, 2025 to 2035
      • By Country
        • GCC Countries
        • Northern Africa
        • South Africa
        • Turkiye
        • Rest of MEA
      • By Material
      • By Frame Type
      • By Sales Channel
      • By Distribution Channel
    • Market Attractiveness Analysis
      • By Country
      • By Material
      • By Frame Type
      • By Sales Channel
      • By Distribution Channel
    • Key Takeaways
  18. Key Countries Market Analysis
    • USA
      • Pricing Analysis
      • Market Share Analysis, 2024
        • By Material
        • By Frame Type
        • By Sales Channel
        • By Distribution Channel
    • Canada
      • Pricing Analysis
      • Market Share Analysis, 2024
        • By Material
        • By Frame Type
        • By Sales Channel
        • By Distribution Channel
    • Brazil
      • Pricing Analysis
      • Market Share Analysis, 2024
        • By Material
        • By Frame Type
        • By Sales Channel
        • By Distribution Channel
    • Mexico
      • Pricing Analysis
      • Market Share Analysis, 2024
        • By Material
        • By Frame Type
        • By Sales Channel
        • By Distribution Channel
    • Argentina
      • Pricing Analysis
      • Market Share Analysis, 2024
        • By Material
        • By Frame Type
        • By Sales Channel
        • By Distribution Channel
  19. Market Structure Analysis
    • Competition Dashboard
    • Competition Benchmarking
    • Market Share Analysis of Top Players
      • By Regional
      • By Material
      • By Frame Type
      • By Sales Channel
      • By Distribution Channel
  20. Competition Analysis
    • Competition Deep Dive
      • Giant Manufacturing Co. Ltd.
        • Overview
        • Product Portfolio
        • Profitability by Market Segments (Product/Age /Sales Channel/Region)
        • Sales Footprint
        • Strategy Overview
          • Marketing Strategy
          • Product Strategy
          • Channel Strategy
      • Blanchi
        • Overview
        • Product Portfolio
        • Profitability by Market Segments (Product/Age /Sales Channel/Region)
        • Sales Footprint
        • Strategy Overview
          • Marketing Strategy
          • Product Strategy
          • Channel Strategy
      • Cannondale Bikes
        • Overview
        • Product Portfolio
        • Profitability by Market Segments (Product/Age /Sales Channel/Region)
        • Sales Footprint
        • Strategy Overview
          • Marketing Strategy
          • Product Strategy
          • Channel Strategy
      • Canyon
        • Overview
        • Product Portfolio
        • Profitability by Market Segments (Product/Age /Sales Channel/Region)
        • Sales Footprint
        • Strategy Overview
          • Marketing Strategy
          • Product Strategy
          • Channel Strategy
      • Cervélo
        • Overview
        • Product Portfolio
        • Profitability by Market Segments (Product/Age /Sales Channel/Region)
        • Sales Footprint
        • Strategy Overview
          • Marketing Strategy
          • Product Strategy
          • Channel Strategy
      • Cicli Pinarello SRL
        • Overview
        • Product Portfolio
        • Profitability by Market Segments (Product/Age /Sales Channel/Region)
        • Sales Footprint
        • Strategy Overview
          • Marketing Strategy
          • Product Strategy
          • Channel Strategy
      • Merida
        • Overview
        • Product Portfolio
        • Profitability by Market Segments (Product/Age /Sales Channel/Region)
        • Sales Footprint
        • Strategy Overview
          • Marketing Strategy
          • Product Strategy
          • Channel Strategy
      • SCOTT Sports SA
        • Overview
        • Product Portfolio
        • Profitability by Market Segments (Product/Age /Sales Channel/Region)
        • Sales Footprint
        • Strategy Overview
          • Marketing Strategy
          • Product Strategy
          • Channel Strategy
      • Trek
        • Overview
        • Product Portfolio
        • Profitability by Market Segments (Product/Age /Sales Channel/Region)
        • Sales Footprint
        • Strategy Overview
          • Marketing Strategy
          • Product Strategy
          • Channel Strategy
  21. Assumptions & Acronyms Used
  22. Research Methodology

List of Tables

  • Table 1: Global Market Value (USD Billion) Forecast by Region, 2020-2035
  • Table 2: Global Market Volume (Thousand Units) Forecast by Region, 2020-2035
  • Table 3: Global Market Value (USD Billion) Forecast by Material, 2020-2035
  • Table 4: Global Market Volume (Thousand Units) Forecast by Material, 2020-2035
  • Table 5: Global Market Value (USD Billion) Forecast by Frame Type, 2020-2035
  • Table 6: Global Market Volume (Thousand Units) Forecast by Frame Type, 2020-2035
  • Table 7: Global Market Value (USD Billion) Forecast by Sales Channel, 2020-2035
  • Table 8: Global Market Volume (Thousand Units) Forecast by Sales Channel, 2020-2035
  • Table 9: Global Market Value (USD Billion) Forecast by Distribution Channel, 2020-2035
  • Table 10: Global Market Volume (Thousand Units) Forecast by Distribution Channel, 2020-2035
  • Table 11: North America Market Value (USD Billion) Forecast by Country, 2020-2035
  • Table 12: North America Market Volume (Thousand Units) Forecast by Country, 2020-2035
  • Table 13: North America Market Value (USD Billion) Forecast by Material, 2020-2035
  • Table 14: North America Market Volume (Thousand Units) Forecast by Material, 2020-2035
  • Table 15: North America Market Value (USD Billion) Forecast by Frame Type, 2020-2035
  • Table 16: North America Market Volume (Thousand Units) Forecast by Frame Type, 2020-2035
  • Table 17: North America Market Value (USD Billion) Forecast by Sales Channel, 2020-2035
  • Table 18: North America Market Volume (Thousand Units) Forecast by Sales Channel, 2020-2035
  • Table 19: North America Market Value (USD Billion) Forecast by Distribution Channel, 2020-2035
  • Table 20: North America Market Volume (Thousand Units) Forecast by Distribution Channel, 2020-2035
  • Table 21: Latin America Market Value (USD Billion) Forecast by Country, 2020-2035
  • Table 22: Latin America Market Volume (Thousand Units) Forecast by Country, 2020-2035
  • Table 23: Latin America Market Value (USD Billion) Forecast by Material, 2020-2035
  • Table 24: Latin America Market Volume (Thousand Units) Forecast by Material, 2020-2035
  • Table 25: Latin America Market Value (USD Billion) Forecast by Frame Type, 2020-2035
  • Table 26: Latin America Market Volume (Thousand Units) Forecast by Frame Type, 2020-2035
  • Table 27: Latin America Market Value (USD Billion) Forecast by Sales Channel, 2020-2035
  • Table 28: Latin America Market Volume (Thousand Units) Forecast by Sales Channel, 2020-2035
  • Table 29: Latin America Market Value (USD Billion) Forecast by Distribution Channel, 2020-2035
  • Table 30: Latin America Market Volume (Thousand Units) Forecast by Distribution Channel, 2020-2035
  • Table 31: Western Europe Market Value (USD Billion) Forecast by Country, 2020-2035
  • Table 32: Western Europe Market Volume (Thousand Units) Forecast by Country, 2020-2035
  • Table 33: Western Europe Market Value (USD Billion) Forecast by Material, 2020-2035
  • Table 34: Western Europe Market Volume (Thousand Units) Forecast by Material, 2020-2035
  • Table 35: Western Europe Market Value (USD Billion) Forecast by Frame Type, 2020-2035
  • Table 36: Western Europe Market Volume (Thousand Units) Forecast by Frame Type, 2020-2035
  • Table 37: Western Europe Market Value (USD Billion) Forecast by Sales Channel, 2020-2035
  • Table 38: Western Europe Market Volume (Thousand Units) Forecast by Sales Channel, 2020-2035
  • Table 39: Western Europe Market Value (USD Billion) Forecast by Distribution Channel, 2020-2035
  • Table 40: Western Europe Market Volume (Thousand Units) Forecast by Distribution Channel, 2020-2035
  • Table 41: Eastern Europe Market Value (USD Billion) Forecast by Country, 2020-2035
  • Table 42: Eastern Europe Market Volume (Thousand Units) Forecast by Country, 2020-2035
  • Table 43: Eastern Europe Market Value (USD Billion) Forecast by Material, 2020-2035
  • Table 44: Eastern Europe Market Volume (Thousand Units) Forecast by Material, 2020-2035
  • Table 45: Eastern Europe Market Value (USD Billion) Forecast by Frame Type, 2020-2035
  • Table 46: Eastern Europe Market Volume (Thousand Units) Forecast by Frame Type, 2020-2035
  • Table 47: Eastern Europe Market Value (USD Billion) Forecast by Sales Channel, 2020-2035
  • Table 48: Eastern Europe Market Volume (Thousand Units) Forecast by Sales Channel, 2020-2035
  • Table 49: Eastern Europe Market Value (USD Billion) Forecast by Distribution Channel, 2020-2035
  • Table 50: Eastern Europe Market Volume (Thousand Units) Forecast by Distribution Channel, 2020-2035
  • Table 51: East Asia Market Value (USD Billion) Forecast by Country, 2020-2035
  • Table 52: East Asia Market Volume (Thousand Units) Forecast by Country, 2020-2035
  • Table 53: East Asia Market Value (USD Billion) Forecast by Material, 2020-2035
  • Table 54: East Asia Market Volume (Thousand Units) Forecast by Material, 2020-2035
  • Table 55: East Asia Market Value (USD Billion) Forecast by Frame Type, 2020-2035
  • Table 56: East Asia Market Volume (Thousand Units) Forecast by Frame Type, 2020-2035
  • Table 57: East Asia Market Value (USD Billion) Forecast by Sales Channel, 2020-2035
  • Table 58: East Asia Market Volume (Thousand Units) Forecast by Sales Channel, 2020-2035
  • Table 59: East Asia Market Value (USD Billion) Forecast by Distribution Channel, 2020-2035
  • Table 60: East Asia Market Volume (Thousand Units) Forecast by Distribution Channel, 2020-2035
  • Table 61: South Asia & Pacific Market Value (USD Billion) Forecast by Country, 2020-2035
  • Table 62: South Asia & Pacific Market Volume (Thousand Units) Forecast by Country, 2020-2035
  • Table 63: South Asia & Pacific Market Value (USD Billion) Forecast by Material, 2020-2035
  • Table 64: South Asia & Pacific Market Volume (Thousand Units) Forecast by Material, 2020-2035
  • Table 65: South Asia & Pacific Market Value (USD Billion) Forecast by Frame Type, 2020-2035
  • Table 66: South Asia & Pacific Market Volume (Thousand Units) Forecast by Frame Type, 2020-2035
  • Table 67: South Asia & Pacific Market Value (USD Billion) Forecast by Sales Channel, 2020-2035
  • Table 68: South Asia & Pacific Market Volume (Thousand Units) Forecast by Sales Channel, 2020-2035
  • Table 69: South Asia & Pacific Market Value (USD Billion) Forecast by Distribution Channel, 2020-2035
  • Table 70: South Asia & Pacific Market Volume (Thousand Units) Forecast by Distribution Channel, 2020-2035
  • Table 71: Middle East and Africa Market Value (USD Billion) Forecast by Country, 2020-2035
  • Table 72: Middle East and Africa Market Volume (Thousand Units) Forecast by Country, 2020-2035
  • Table 73: Middle East and Africa Market Value (USD Billion) Forecast by Material, 2020-2035
  • Table 74: Middle East and Africa Market Volume (Thousand Units) Forecast by Material, 2020-2035
  • Table 75: Middle East and Africa Market Value (USD Billion) Forecast by Frame Type, 2020-2035
  • Table 76: Middle East and Africa Market Volume (Thousand Units) Forecast by Frame Type, 2020-2035
  • Table 77: Middle East and Africa Market Value (USD Billion) Forecast by Sales Channel, 2020-2035
  • Table 78: Middle East and Africa Market Volume (Thousand Units) Forecast by Sales Channel, 2020-2035
  • Table 79: Middle East and Africa Market Value (USD Billion) Forecast by Distribution Channel, 2020-2035
  • Table 80: Middle East and Africa Market Volume (Thousand Units) Forecast by Distribution Channel, 2020-2035

List of Figures

  • Figure 1: Global Market Volume (Thousand Units) Forecast 2020-2035
  • Figure 2: Global Market Pricing Analysis
  • Figure 3: Global Market Value (USD Billion) Forecast 2020-2035
  • Figure 4: Global Market Value Share and BPS Analysis by Material, 2025 and 2035
  • Figure 5: Global Market Y-o-Y Growth Comparison by Material, 2025-2035
  • Figure 6: Global Market Attractiveness Analysis by Material
  • Figure 7: Global Market Value Share and BPS Analysis by Frame Type, 2025 and 2035
  • Figure 8: Global Market Y-o-Y Growth Comparison by Frame Type, 2025-2035
  • Figure 9: Global Market Attractiveness Analysis by Frame Type
  • Figure 10: Global Market Value Share and BPS Analysis by Sales Channel, 2025 and 2035
  • Figure 11: Global Market Y-o-Y Growth Comparison by Sales Channel, 2025-2035
  • Figure 12: Global Market Attractiveness Analysis by Sales Channel
  • Figure 13: Global Market Value Share and BPS Analysis by Distribution Channel, 2025 and 2035
  • Figure 14: Global Market Y-o-Y Growth Comparison by Distribution Channel, 2025-2035
  • Figure 15: Global Market Attractiveness Analysis by Distribution Channel
  • Figure 16: Global Market Value (USD Billion) Share and BPS Analysis by Region, 2025 and 2035
  • Figure 17: Global Market Y-o-Y Growth Comparison by Region, 2025-2035
  • Figure 18: Global Market Attractiveness Analysis by Region
  • Figure 19: North America Market Incremental $ Opportunity, 2025-2035
  • Figure 20: Latin America Market Incremental $ Opportunity, 2025-2035
  • Figure 21: Western Europe Market Incremental $ Opportunity, 2025-2035
  • Figure 22: Eastern Europe Market Incremental $ Opportunity, 2025-2035
  • Figure 23: East Asia Market Incremental $ Opportunity, 2025-2035
  • Figure 24: South Asia & Pacific Market Incremental $ Opportunity, 2025-2035
  • Figure 25: Middle East and Africa Market Incremental $ Opportunity, 2025-2035
  • Figure 26: North America Market Value Share and BPS Analysis by Country, 2025 and 2035
  • Figure 27: North America Market Value Share and BPS Analysis by Material, 2025 and 2035
  • Figure 28: North America Market Y-o-Y Growth Comparison by Material, 2025-2035
  • Figure 29: North America Market Attractiveness Analysis by Material
  • Figure 30: North America Market Value Share and BPS Analysis by Frame Type, 2025 and 2035
  • Figure 31: North America Market Y-o-Y Growth Comparison by Frame Type, 2025-2035
  • Figure 32: North America Market Attractiveness Analysis by Frame Type
  • Figure 33: North America Market Value Share and BPS Analysis by Sales Channel, 2025 and 2035
  • Figure 34: North America Market Y-o-Y Growth Comparison by Sales Channel, 2025-2035
  • Figure 35: North America Market Attractiveness Analysis by Sales Channel
  • Figure 36: North America Market Value Share and BPS Analysis by Distribution Channel, 2025 and 2035
  • Figure 37: North America Market Y-o-Y Growth Comparison by Distribution Channel, 2025-2035
  • Figure 38: North America Market Attractiveness Analysis by Distribution Channel
  • Figure 39: Latin America Market Value Share and BPS Analysis by Country, 2025 and 2035
  • Figure 40: Latin America Market Value Share and BPS Analysis by Material, 2025 and 2035
  • Figure 41: Latin America Market Y-o-Y Growth Comparison by Material, 2025-2035
  • Figure 42: Latin America Market Attractiveness Analysis by Material
  • Figure 43: Latin America Market Value Share and BPS Analysis by Frame Type, 2025 and 2035
  • Figure 44: Latin America Market Y-o-Y Growth Comparison by Frame Type, 2025-2035
  • Figure 45: Latin America Market Attractiveness Analysis by Frame Type
  • Figure 46: Latin America Market Value Share and BPS Analysis by Sales Channel, 2025 and 2035
  • Figure 47: Latin America Market Y-o-Y Growth Comparison by Sales Channel, 2025-2035
  • Figure 48: Latin America Market Attractiveness Analysis by Sales Channel
  • Figure 49: Latin America Market Value Share and BPS Analysis by Distribution Channel, 2025 and 2035
  • Figure 50: Latin America Market Y-o-Y Growth Comparison by Distribution Channel, 2025-2035
  • Figure 51: Latin America Market Attractiveness Analysis by Distribution Channel
  • Figure 52: Western Europe Market Value Share and BPS Analysis by Country, 2025 and 2035
  • Figure 53: Western Europe Market Value Share and BPS Analysis by Material, 2025 and 2035
  • Figure 54: Western Europe Market Y-o-Y Growth Comparison by Material, 2025-2035
  • Figure 55: Western Europe Market Attractiveness Analysis by Material
  • Figure 56: Western Europe Market Value Share and BPS Analysis by Frame Type, 2025 and 2035
  • Figure 57: Western Europe Market Y-o-Y Growth Comparison by Frame Type, 2025-2035
  • Figure 58: Western Europe Market Attractiveness Analysis by Frame Type
  • Figure 59: Western Europe Market Value Share and BPS Analysis by Sales Channel, 2025 and 2035
  • Figure 60: Western Europe Market Y-o-Y Growth Comparison by Sales Channel, 2025-2035
  • Figure 61: Western Europe Market Attractiveness Analysis by Sales Channel
  • Figure 62: Western Europe Market Value Share and BPS Analysis by Distribution Channel, 2025 and 2035
  • Figure 63: Western Europe Market Y-o-Y Growth Comparison by Distribution Channel, 2025-2035
  • Figure 64: Western Europe Market Attractiveness Analysis by Distribution Channel
  • Figure 65: Eastern Europe Market Value Share and BPS Analysis by Country, 2025 and 2035
  • Figure 66: Eastern Europe Market Value Share and BPS Analysis by Material, 2025 and 2035
  • Figure 67: Eastern Europe Market Y-o-Y Growth Comparison by Material, 2025-2035
  • Figure 68: Eastern Europe Market Attractiveness Analysis by Material
  • Figure 69: Eastern Europe Market Value Share and BPS Analysis by Frame Type, 2025 and 2035
  • Figure 70: Eastern Europe Market Y-o-Y Growth Comparison by Frame Type, 2025-2035
  • Figure 71: Eastern Europe Market Attractiveness Analysis by Frame Type
  • Figure 72: Eastern Europe Market Value Share and BPS Analysis by Sales Channel, 2025 and 2035
  • Figure 73: Eastern Europe Market Y-o-Y Growth Comparison by Sales Channel, 2025-2035
  • Figure 74: Eastern Europe Market Attractiveness Analysis by Sales Channel
  • Figure 75: Eastern Europe Market Value Share and BPS Analysis by Distribution Channel, 2025 and 2035
  • Figure 76: Eastern Europe Market Y-o-Y Growth Comparison by Distribution Channel, 2025-2035
  • Figure 77: Eastern Europe Market Attractiveness Analysis by Distribution Channel
  • Figure 78: East Asia Market Value Share and BPS Analysis by Country, 2025 and 2035
  • Figure 79: East Asia Market Value Share and BPS Analysis by Material, 2025 and 2035
  • Figure 80: East Asia Market Y-o-Y Growth Comparison by Material, 2025-2035
  • Figure 81: East Asia Market Attractiveness Analysis by Material
  • Figure 82: East Asia Market Value Share and BPS Analysis by Frame Type, 2025 and 2035
  • Figure 83: East Asia Market Y-o-Y Growth Comparison by Frame Type, 2025-2035
  • Figure 84: East Asia Market Attractiveness Analysis by Frame Type
  • Figure 85: East Asia Market Value Share and BPS Analysis by Sales Channel, 2025 and 2035
  • Figure 86: East Asia Market Y-o-Y Growth Comparison by Sales Channel, 2025-2035
  • Figure 87: East Asia Market Attractiveness Analysis by Sales Channel
  • Figure 88: East Asia Market Value Share and BPS Analysis by Distribution Channel, 2025 and 2035
  • Figure 89: East Asia Market Y-o-Y Growth Comparison by Distribution Channel, 2025-2035
  • Figure 90: East Asia Market Attractiveness Analysis by Distribution Channel
  • Figure 91: South Asia & Pacific Market Value Share and BPS Analysis by Country, 2025 and 2035
  • Figure 92: South Asia & Pacific Market Value Share and BPS Analysis by Material, 2025 and 2035
  • Figure 93: South Asia & Pacific Market Y-o-Y Growth Comparison by Material, 2025-2035
  • Figure 94: South Asia & Pacific Market Attractiveness Analysis by Material
  • Figure 95: South Asia & Pacific Market Value Share and BPS Analysis by Frame Type, 2025 and 2035
  • Figure 96: South Asia & Pacific Market Y-o-Y Growth Comparison by Frame Type, 2025-2035
  • Figure 97: South Asia & Pacific Market Attractiveness Analysis by Frame Type
  • Figure 98: South Asia & Pacific Market Value Share and BPS Analysis by Sales Channel, 2025 and 2035
  • Figure 99: South Asia & Pacific Market Y-o-Y Growth Comparison by Sales Channel, 2025-2035
  • Figure 100: South Asia & Pacific Market Attractiveness Analysis by Sales Channel
  • Figure 101: South Asia & Pacific Market Value Share and BPS Analysis by Distribution Channel, 2025 and 2035
  • Figure 102: South Asia & Pacific Market Y-o-Y Growth Comparison by Distribution Channel, 2025-2035
  • Figure 103: South Asia & Pacific Market Attractiveness Analysis by Distribution Channel
  • Figure 104: Middle East and Africa Market Value Share and BPS Analysis by Country, 2025 and 2035
  • Figure 105: Middle East and Africa Market Value Share and BPS Analysis by Material, 2025 and 2035
  • Figure 106: Middle East and Africa Market Y-o-Y Growth Comparison by Material, 2025-2035
  • Figure 107: Middle East and Africa Market Attractiveness Analysis by Material
  • Figure 108: Middle East and Africa Market Value Share and BPS Analysis by Frame Type, 2025 and 2035
  • Figure 109: Middle East and Africa Market Y-o-Y Growth Comparison by Frame Type, 2025-2035
  • Figure 110: Middle East and Africa Market Attractiveness Analysis by Frame Type
  • Figure 111: Middle East and Africa Market Value Share and BPS Analysis by Sales Channel, 2025 and 2035
  • Figure 112: Middle East and Africa Market Y-o-Y Growth Comparison by Sales Channel, 2025-2035
  • Figure 113: Middle East and Africa Market Attractiveness Analysis by Sales Channel
  • Figure 114: Middle East and Africa Market Value Share and BPS Analysis by Distribution Channel, 2025 and 2035
  • Figure 115: Middle East and Africa Market Y-o-Y Growth Comparison by Distribution Channel, 2025-2035
  • Figure 116: Middle East and Africa Market Attractiveness Analysis by Distribution Channel
  • Figure 117: Global Market - Tier Structure Analysis
  • Figure 118: Global Market - Company Share Analysis

Frequently Asked Questions

What is the projected bicycle frames market size by 2035?

The market is expected to reach USD 62.1 billion by 2035.

What is the CAGR of the bicycle frames market from 2025 to 2035?

The market is growing at a CAGR of 10.2% during this period.

Which material segment holds the largest market share in 2025?

Aluminum leads with an estimated 35% share.

Which frame type is most popular in the bicycle frames market?

Mountain Bicycles are the leading type, estimated at 40% share.

Who is the leading player in the bicycle frames market?

Giant Manufacturing Co. Ltd. leads with 22% market share.

Explore Similar Insights

Future Market Insights

Bicycle Frames Market

Chat With

MaRIA

Hi There, I am MaRIA, Your Market Research Intelligence Assistant. How may I help you?