The nylon monofilament mesh filter bags market is valued at USD 114.0 million in 2025 and is expected to reach USD 183.9 million by 2035, with a CAGR of 4.9%. From 2021 to 2025, the market grows from USD 89.7 million to USD 114.0 million, passing through intermediate values of USD 94.1 million, 98.7 million, 103.6 million, and 108.6 million.
This early growth phase is relatively steady, as the demand for nylon monofilament mesh filter bags is driven by industries such as water treatment, food and beverage filtration, and pharmaceuticals. The market’s growth is influenced by macroeconomic factors like industrial output, regulations on water quality, and the growing need for efficient filtration solutions.
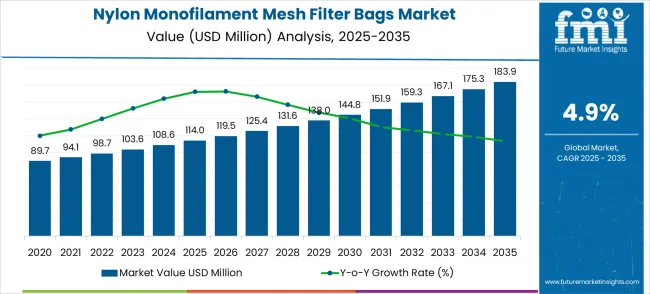
Between 2026 and 2030, the market continues expanding from USD 114.0 million to USD 151.9 million, with intermediate values of USD 119.5 million, 125.4 million, 131.6 million, and 138.0 million. At this stage, the market’s elasticity becomes more evident as it reflects macroeconomic indicators like GDP growth, industrial expansion, and technological advancements in filtration systems.
A growing focus on environmental responsibility and stringent regulations on water and air quality contribute to a higher demand for filtration products, further driving market growth. The market also experiences price fluctuations due to raw material costs and global economic conditions. By 2030, the market will reach USD 159.3 million, and from 2031 to 2035, the market will continue to rise, reaching USD 183.9 million, supported by ongoing industrial needs and regulatory compliance.
The filtration market contributes about 40-45%, driven by the increasing need for high-quality, durable filter bags in various industries, including water treatment, pharmaceuticals, and chemicals, where precise filtration is crucial for product quality and operational efficiency.
The chemical processing market adds roughly 20-25%, as nylon monofilament mesh filter bags are commonly used in filtering chemicals, solvents, and other substances, requiring resistance to harsh conditions such as high temperatures and corrosive environments.
The water treatment market contributes around 15-18%, with nylon monofilament mesh filter bags being widely used in water filtration processes to remove particulate matter from both industrial wastewater and potable water.
The food and beverage market accounts for approximately 10-12%, as these filter bags are employed in filtering liquids such as oils, juices, and beer, where product purity and filtration precision are essential. The pharmaceutical market contributes about 8-10%, driven by the demand for highly precise filtration to ensure the quality and sterility of drugs and biologics in pharmaceutical manufacturing.
| Metric | Value |
|---|---|
| Market Value (2025) | USD 114.0 million |
| Market Value (2035) | USD 184 million |
| CAGR (2025-2035) | 5% |
Market expansion is being supported by the increasing demand for cost-effective filtration solutions in industrial applications and the corresponding need for reusable filter media that provides consistent performance across multiple cleaning cycles.
Modern industrial processes rely on precise particle removal capabilities to ensure product quality and equipment protection from contamination. Even minor filtration inefficiencies can result in significant production losses, making reliable mesh filter solutions essential for maintaining operational efficiency and product specifications.
The growing complexity of chemical processing operations and increasing focus on environmental responsibility are driving demand for advanced nylon monofilament mesh filter bags from industrial facilities with appropriate filtration capabilities and technical expertise.
Manufacturing companies increasingly require filtration solutions that combine high flow rates with effective particle retention while minimizing waste generation. Regulatory requirements for process efficiency and environmental compliance are establishing standardized filtration procedures that require specialized mesh filter systems and trained maintenance personnel.
The nylon monofilament mesh filter bags market (USD 114.0M → 183.9M by 2035, CAGR ~5%) is being driven by industrial coatings, ink formulations, water treatment expansion, and chemical processing. Collectively, targeted micron-size customization, end-use specialization, and regional supply chain strategies unlock USD 65-75M in incremental revenue opportunities by 2035 (aligned with the ~USD 69.9M total market expansion).
The market is segmented by micron size, end-use industry, and region. By micron size, the market is divided into 10μm, 25μm, 50μm, and others. By end-use industry, the market is categorized into coatings, inks, chemicals, water treatment, and others. Regionally, the market is divided into North America, Europe, Asia Pacific, Latin America, South Asia & Pacific, and Middle East & Africa.
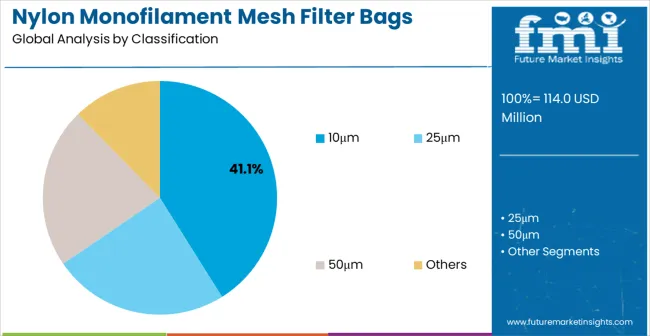
The 10μm segment is projected to account for 41.1% of the nylon monofilament mesh filter bags market in 2025. This leading share is supported by the widespread application of fine filtration requirements in pharmaceutical, electronics, and high-precision chemical processing applications. 10μm mesh filters provide optimal performance for removing fine particles while maintaining high flow rates and minimal pressure drop.
The segment benefits from established filtration protocols and comprehensive equipment compatibility across multiple industrial applications. Pharmaceutical manufacturing facilities rely heavily on 10μm filtration for sterile processing and injectable drug production, where even microscopic contaminants can compromise product safety and regulatory compliance.
The dominance of 10μm mesh systems reflects the increasing sophistication of industrial processes and growing quality standards across manufacturing sectors. Advanced chemical processing operations, including catalyst preparation and specialty polymer production, depend on precise particle removal to prevent equipment damage and maintain product consistency. Food and beverage industries also contribute to this segment through applications requiring fine filtration for beverage clarification and ingredient processing.
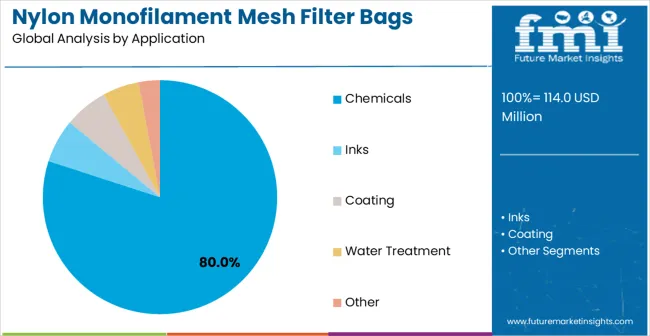
Chemical processing applications are projected to contribute 80% of the market in 2025, representing the primary driver of nylon monofilament mesh filter bag demand. These applications encompass polymer processing, petrochemicals, specialty chemicals, and various industrial chemical production processes that require reliable particle removal capabilities.
The segment is supported by growing demand for chemical process optimization and the critical role of filtration in maintaining product purity and equipment protection. Polymer manufacturers utilize mesh filtration for removing catalyst residues and impurities during polymerization processes, ensuring consistent molecular weight distribution and product quality.
The chemical industry's preference for nylon monofilament mesh stems from its exceptional chemical resistance and ability to withstand aggressive solvents, acids, and caustic solutions commonly encountered in chemical processing environments.
Paint and coating manufacturers rely on mesh filtration to remove gel particles and foreign matter that could cause surface defects or application problems. Specialty chemical producers, including those manufacturing pharmaceutical intermediates and electronic chemicals, require precise filtration to meet stringent purity standards and regulatory requirements.
The nylon monofilament mesh filter bags market is advancing steadily due to increasing industrial production activities and growing recognition of cost-effective filtration solutions for process optimization. The market faces challenges including competition from alternative filter media, need for regular cleaning and maintenance, and varying filtration requirements across different industrial applications. Quality standardization efforts and performance improvement programs continue to influence product development and market expansion patterns.
The growing adoption of advanced nylon materials with enhanced chemical resistance and improved durability is enabling longer service life and broader application compatibility for mesh filter bags. Modern manufacturing processes incorporating precision weaving techniques provide consistent mesh openings and superior filtration performance for demanding industrial applications. Advanced material formulations support improved temperature resistance and chemical compatibility while maintaining the cost-effectiveness and reusability advantages of nylon mesh filtration systems.
The growing focus on environmental responsibility and waste reduction is driving demand for reusable mesh filter systems that minimize disposal needs while maintaining high filtration efficiency. Industrial facilities are increasingly adopting mesh filtration solutions as part of their circular economy initiatives, helping to reduce operational costs and environmental impact. These systems are particularly valuable for companies looking to optimize resource utilization while ensuring compliance with environmental regulations and advancing their corporate eco-conscious goals.
| Country | CAGR (2025 to 2035) |
|---|---|
| China | 6.6% |
| India | 6.1% |
| Germany | 5.6% |
| Brazil | 5.1% |
| United States | 4.7% |
| United Kingdom | 4.2% |
| Japan | 3.7% |
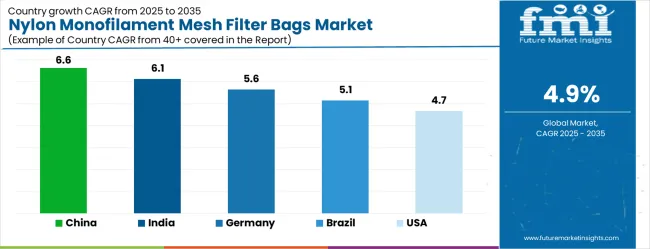
The nylon monofilament mesh filter bags market is experiencing steady growth across key global markets, with China leading at a 6.6% CAGR through 2035, driven by massive industrial expansion, growing chemical processing capabilities, and increasing adoption of advanced filtration technologies. India follows at 6.1%, supported by expanding manufacturing sector and increasing recognition of mesh filtration benefits for industrial applications. Germany demonstrates solid growth at 5.6%, emphasizing advanced manufacturing processes and precision filtration requirements in chemical and pharmaceutical industries.
Brazil maintains consistent expansion at 5.1%, driven by growing industrial production and chemical processing sector development. The United States shows stable growth at 4.7%, focusing on technological innovation and process optimization in established industrial markets. The United Kingdom records 4.2% growth, concentrating on pharmaceutical and specialty chemical applications. Japan exhibits 3.7% growth, demonstrating focus on high-precision manufacturing and advanced filtration technologies.
The report covers an in-depth analysis of 40+ countries with top-performing countries highlighted below
The nylon monofilament mesh filter bags market in China is projected to exhibit the highest growth rate with a CAGR of 6.6% through 2035, driven by rapid industrial development and massive investments in chemical processing infrastructure across the country. The government's commitment to manufacturing sector modernization and industrial efficiency improvement is creating significant demand for advanced filtration solutions.
Major chemical companies and manufacturing facilities are establishing comprehensive filtration systems to support growing production requirements and quality standards. China's industrial modernization programs are supporting development of domestic mesh filter manufacturing capabilities and comprehensive technical expertise that enhance local production capacity and reduce equipment costs across urban and rural industrial regions.
Revenue from nylon monofilament mesh filter bags in India is projected to expand at a CAGR of 6.1%, supported by government investments in manufacturing infrastructure and increasing recognition of advanced filtration importance for industrial competitiveness and product quality.
The country's expanding chemical processing sector and growing pharmaceutical industry are driving demand for sophisticated mesh filtration systems. Manufacturing companies and chemical processors are gradually establishing comprehensive filtration capabilities to serve domestic and export markets. India's industrial development programs are creating opportunities for international technology partnerships and domestic capability building in advanced filtration systems. The growing emphasis on manufacturing excellence and product quality improvement is supporting investments in mesh filtration technologies.
Demand for nylon monofilament mesh filter bags in Germany is anticipated to grow at a CAGR of 5.6%, supported by the country's leadership in advanced manufacturing technology and comprehensive industrial process optimization programs. German manufacturing facilities and chemical processors are implementing advanced mesh filtration systems that integrate with sophisticated quality control and process automation systems.
The market is characterized by emphasis on technological innovation, precision filtration capabilities, and comprehensive manufacturing efficiency optimization. Germany's industrial technology investments are prioritizing next-generation filtration solutions that demonstrate superior performance and reliability while supporting comprehensive manufacturing optimization and quality assurance programs.
The nylon monofilament mesh filter bags market in Brazil is projected to grow at a CAGR of 5.1%, driven by increasing investments in industrial infrastructure and growing recognition of mesh filtration importance for manufacturing competitiveness and environmental compliance.
The country's expanding chemical processing sector and developing manufacturing capabilities are creating demand for comprehensive filtration systems. Industrial facilities and chemical processors are developing advanced filtration capabilities to support domestic production and international market access. Brazil's industrial development initiatives are facilitating adoption of international filtration technologies and establishment of domestic technical expertise for industrial applications. Government programs for manufacturing sector development and environmental protection are creating opportunities for systematic mesh filtration deployment.
Demand for nylon monofilament mesh filter bags in the United States is expected to expand at a CAGR of 4.7%, driven by continuous process optimization efforts and comprehensive industrial efficiency improvement programs across mature manufacturing sectors. American manufacturing facilities, chemical processors, and water treatment companies are establishing advanced mesh filtration capabilities to support competitive manufacturing and regulatory compliance requirements.
The market benefits from significant research investments and technological innovation in filtration system development. United States industrial innovation programs are creating opportunities for advanced mesh filtration technology development and comprehensive system optimization across different industrial applications.
Demand for nylon monofilament mesh filter bags in the United Kingdom is growing at a CAGR of 4.2%, supported by extensive pharmaceutical manufacturing and specialty chemical production activities requiring high-precision filtration capabilities. British manufacturing facilities and research institutions are implementing specialized mesh filtration systems for pharmaceutical, biotechnology, and specialty chemical applications.
The market is characterized by emphasis on regulatory compliance, quality assurance, and comprehensive process validation requirements. United Kingdom industrial innovation investments are prioritizing pharmaceutical and specialty chemical filtration applications that support comprehensive quality control and regulatory compliance programs. Government initiatives for advanced manufacturing and biotechnology development are establishing systematic filtration capabilities for high-value manufacturing and research applications.
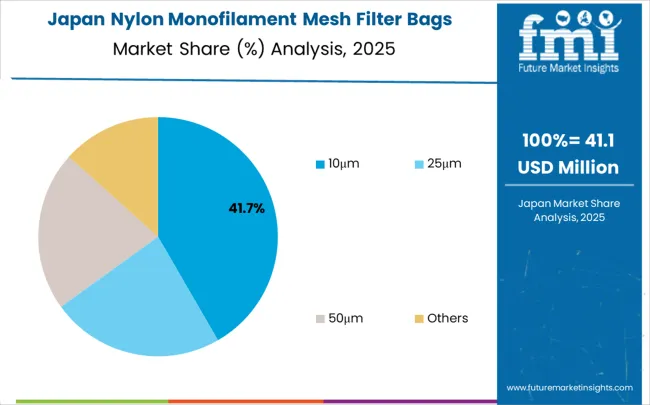
Revenue from nylon monofilament mesh filter bags in Japan is expanding at a CAGR of 3.7%, driven by advanced manufacturing capabilities and comprehensive quality control requirements for precision industrial applications. Japanese manufacturing facilities and technology companies are implementing precision mesh filtration systems for electronics, automotive, and high-technology manufacturing applications. The market benefits from technological innovation and systematic approach to manufacturing excellence and quality assurance.
Japan's advanced manufacturing programs are creating opportunities for domestic filtration technology development and international collaboration in precision filtration systems. Government investments in manufacturing technology and quality improvement are supporting systematic deployment of advanced mesh filtration technologies for comprehensive quality control and manufacturing optimization across diverse industrial applications.
The nylon monofilament mesh filter bags market in Europe is projected to grow from USD 34.2 million in 2025 to USD 52.7 million by 2035, registering a CAGR of 4.4% over the forecast period. Germany is expected to maintain its leadership with 28.7% market share in 2025, supported by its extensive chemical processing industry and advanced manufacturing infrastructure.
The United Kingdom is projected to hold 19.3% market share, driven by pharmaceutical manufacturing and specialty chemical production activities. France will contribute 16.2% of the regional market, supported by automotive and industrial coating applications. Italy accounts for 12.8% of the market, driven by textile and chemical processing applications. The Netherlands represents 8.4% of the regional market, while the Rest of Europe collectively accounts for 14.6% of the European nylon monofilament mesh filter bags market.
The nylon monofilament mesh filter bags market is defined by competition among specialized filtration companies, industrial equipment manufacturers, and process technology providers. Companies are investing in advanced mesh weaving technologies, material science innovations, quality control systems, and technical support services to deliver reliable, cost-effective, and high-performance filtration solutions. Strategic partnerships, product innovation, and geographic expansion are central to strengthening market positions and customer relationships.
Parker Hannifin, United States-based, offers comprehensive mesh filtration systems with emphasis on industrial reliability, technical performance, and comprehensive customer support for diverse process applications. Eaton, operating globally, provides advanced filtration solutions integrated with industrial process optimization and system reliability services. Pentair delivers technologically sophisticated mesh filter systems with standardized quality procedures and comprehensive technical documentation. 3M emphasizes innovation-driven filtration solutions with specialized technical support for demanding industrial applications.
Sefar AG, Switzerland, offers specialized mesh filtration expertise with precision manufacturing capabilities and comprehensive technical reliability across global markets. AJR Filtration provides advanced filter systems integrated into comprehensive industrial filtration operations. Amazon Filters Ltd. delivers comprehensive filtration solutions, standardized procedures, and service reliability across regional and international networks. Filtration Group, Knight Corporation, Strainrite Companies, Inc., Allied Filter Systems Ltd., Harmsco Filtration Products, Industrial Filter Manufacturing (IFM), and Farrleey offer specialized mesh filtration capabilities, advanced manufacturing technologies, and comprehensive technical support for diverse industrial filtration applications.
| Item | Value |
|---|---|
| Quantitative Units (2025) | USD 114.0 million |
| Micron Size | 10μm, 25μm, 50μm, Others |
| End-Use Industry | Coatings, Inks, Chemicals, Water Treatment, Other |
| Regions Covered | North America, Europe, East Asia, South Asia & Pacific, Latin America, Middle East & Africa |
| Countries Covered | United States, Canada, United Kingdom, Germany, France, China, Japan, South Korea, India, Brazil, Australia and 40+ countries |
| Key Companies Profiled | Parker Hannifin, Eaton, Pentair, 3M, Sefar, AJR Filtration, Amazon Filters, Ltd., Filtration Group, Knight Corporation, Strainrite Companies, Allied Filter SystemsLtd., Harmsco Filtration Products, Industrial Filter Manufacturing (IFM), Farrleey |
| Additional Attributes | Dollar sales by micron size, end-use industry, and regional markets, demand trends across North America, Europe, and Asia-Pacific, competitive landscape with established filtration companies and emerging technology providers, customer preferences for reusable versus disposable filter solutions, integration with advanced manufacturing processes and quality control systems, innovations in nylon material formulations and mesh weaving technologies, and adoption of specialized filtration solutions |
The global lane control signals market is estimated to be valued at USD 859.2 million in 2025.
The market size for the lane control signals market is projected to reach USD 1,212.0 million by 2035.
The lane control signals market is expected to grow at a 3.5% CAGR between 2025 and 2035.
The key product types in lane control signals market are LED signs and reflective material signs.
In terms of application, urban roads segment to command 70.0% share in the lane control signals market in 2025.


Our Research Products

The "Full Research Suite" delivers actionable market intel, deep dives on markets or technologies, so clients act faster, cut risk, and unlock growth.

The Leaderboard benchmarks and ranks top vendors, classifying them as Established Leaders, Leading Challengers, or Disruptors & Challengers.

Locates where complements amplify value and substitutes erode it, forecasting net impact by horizon

We deliver granular, decision-grade intel: market sizing, 5-year forecasts, pricing, adoption, usage, revenue, and operational KPIs—plus competitor tracking, regulation, and value chains—across 60 countries broadly.

Spot the shifts before they hit your P&L. We track inflection points, adoption curves, pricing moves, and ecosystem plays to show where demand is heading, why it is changing, and what to do next across high-growth markets and disruptive tech

Real-time reads of user behavior. We track shifting priorities, perceptions of today’s and next-gen services, and provider experience, then pace how fast tech moves from trial to adoption, blending buyer, consumer, and channel inputs with social signals (#WhySwitch, #UX).

Partner with our analyst team to build a custom report designed around your business priorities. From analysing market trends to assessing competitors or crafting bespoke datasets, we tailor insights to your needs.
Supplier Intelligence
Discovery & Profiling
Capacity & Footprint
Performance & Risk
Compliance & Governance
Commercial Readiness
Who Supplies Whom
Scorecards & Shortlists
Playbooks & Docs
Category Intelligence
Definition & Scope
Demand & Use Cases
Cost Drivers
Market Structure
Supply Chain Map
Trade & Policy
Operating Norms
Deliverables
Buyer Intelligence
Account Basics
Spend & Scope
Procurement Model
Vendor Requirements
Terms & Policies
Entry Strategy
Pain Points & Triggers
Outputs
Pricing Analysis
Benchmarks
Trends
Should-Cost
Indexation
Landed Cost
Commercial Terms
Deliverables
Brand Analysis
Positioning & Value Prop
Share & Presence
Customer Evidence
Go-to-Market
Digital & Reputation
Compliance & Trust
KPIs & Gaps
Outputs
Full Research Suite comprises of:
Market outlook & trends analysis
Interviews & case studies
Strategic recommendations
Vendor profiles & capabilities analysis
5-year forecasts
8 regions and 60+ country-level data splits
Market segment data splits
12 months of continuous data updates
DELIVERED AS:
PDF EXCEL ONLINE
Monofilament Mesh Filter Bags Market Size and Share Forecast Outlook 2025 to 2035
Homopolymer Acrylic Filter Bags Market Size and Share Forecast Outlook 2025 to 2035
Nylon Acid Dye Fixing Agent Market Size and Share Forecast Outlook 2025 to 2035
Filter Bag Market Size and Share Forecast Outlook 2025 to 2035
Nylon Coated Tape Measure Market Size and Share Forecast Outlook 2025 to 2035
Nylon Webbing Market Size and Share Forecast Outlook 2025 to 2035
Filter Press Solutions Market Size and Share Forecast Outlook 2025 to 2035
Nylon Film Market Size and Share Forecast Outlook 2025 to 2035
Mesh Bag Market Size and Share Forecast Outlook 2025 to 2035
Mesh Fabric Market Size and Share Forecast Outlook 2025 to 2035
Filter Integrity Test Systems Market Size and Share Forecast Outlook 2025 to 2035
Mesh Nebulizer for Kids Market Size and Share Forecast Outlook 2025 to 2035
Filter Coatings Market Size and Share Forecast Outlook 2025 to 2035
Nylon-6 and Nylon-66 Market Analysis & Forecast by Product Type, Application and Region through 2035
Mesh Tarpaulin Sheets Market Size and Share Forecast Outlook 2025 to 2035
Nylon-6 Market Trends and Forecast 2025 to 2035
Understanding Market Share Trends in Mesh Bags
Industry Share Analysis for Filter Paper Companies
Filter Paper Market Trends – Growth, Demand & Forecast through 2035
Monofilament Market Growth – Trends & Forecast 2024-2034

Thank you!
You will receive an email from our Business Development Manager. Please be sure to check your SPAM/JUNK folder too.
Chat With
MaRIA