The mesh bag industry is set for a decade-long growth trajectory, expanding from USD 3.8 billion in 2025 to USD 6.2 billion by 2035, reflecting a CAGR of 5.0%. Between 2025 and 2030, the market will grow from USD 3.8 billion to approximately USD 4.9 billion, adding USD 1.1 billion, or 46% of the total forecast growth for the decade. This phase will be marked by the rapid adoption of durable mesh materials, driven by increasing demand for ventilated packaging solutions, particularly in agriculture and retail sectors. As the need for reusable packaging grows, enhanced material capabilities and automated production systems will shift from premium options to standard expectations. The adoption of breathable, reusable packaging will gain momentum, supporting operational efficiency across industries.
From 2030 to 2035, the market will continue to expand, growing from USD 4.9 billion to USD 6.2 billion, contributing USD 1.3 billion, or 54% of the decade's growth. This period will be characterized by mass adoption of advanced mesh technologies and the integration of mesh bags with supply chain management platforms. Seamless compatibility with existing distribution infrastructure will become essential. The market will experience a fundamental shift in how packaging facilities approach breathable storage and material management. Demand for specialized mesh bags with improved durability, ventilation, and efficiency will drive innovation across various material types and application segments, positioning the industry for long-term success.
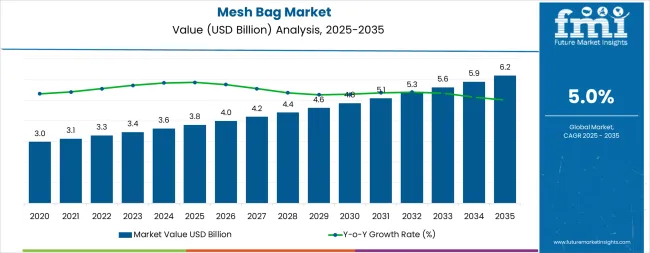
The mesh bag market demonstrates distinct growth phases with varying market characteristics and competitive dynamics. Between 2025 and 2030, the market progresses through its technology adoption phase, expanding from USD 3.8 billion to USD 4.9 billion with steady annual increments averaging 5.0% growth. This period showcases the transition from basic mesh materials to advanced polymer-based systems with enhanced durability and integrated ventilation features becoming mainstream characteristics.
The 2025-2030 phase adds USD 1.1 billion to market value, representing 46% of total decade expansion. Market maturation factors include standardization of mesh specifications, declining component costs for specialized equipment, and increasing industrial awareness of breathable packaging benefits reaching 92-95% operational effectiveness in produce storage applications. Competitive landscape evolution during this period features established packaging companies expanding their mesh bag portfolios while specialty manufacturers focus on advanced material development and enhanced breathability capabilities.
From 2030 to 2035, market dynamics shift toward advanced material integration and global packaging expansion, with growth continuing from USD 4.9 billion to USD 6.2 billion, adding USD 1.3 billion or 54% of total expansion. This phase transition centers on composite mesh systems, integration with automated sorting networks, and deployment across diverse agricultural and industrial scenarios, becoming standard rather than specialized applications. The competitive environment matures with focus shifting from basic ventilation capability to comprehensive material optimization systems and integration with supply chain monitoring platforms.
| Metric | Value |
|---|---|
| Market Value (2025) | USD 3.8 billion |
| Market Forecast (2035) | USD 6.2 billion |
| Growth Rate | 5.0% CAGR |
| Leading Technology | Nylon Material Type |
| Primary Application | Agriculture & Produce Segment |
The market demonstrates strong fundamentals with nylon mesh systems capturing a dominant share through advanced durability features and material optimization. Agriculture & produce applications drive primary demand, supported by increasing ventilated packaging development and storage requirement needs. Geographic expansion remains concentrated in emerging markets with expanding agricultural infrastructure, while developed economies show steady adoption rates driven by reusable packaging initiatives and retail modernization standards.
Market expansion rests on three fundamental shifts driving adoption across the agricultural and retail sectors. 1. Ventilation mandates create compelling operational advantages through mesh bags that provide continuous airflow without product deterioration, enabling farmers to meet storage requirements while maintaining produce freshness and reducing spoilage costs. 2. Reusability acceleration advances as facilities worldwide seek durable materials that complement traditional single-use packaging methods, enabling precise ventilation control and extended product life that align with operational efficiency standards. 3. Cost optimization drives adoption from agricultural operations and retail facilities requiring effective packaging solutions that minimize replacement frequency while maintaining operational productivity during storage and distribution operations.
However, growth faces headwinds from durability concerns that vary across regions regarding the longevity of mesh materials and cleaning infrastructure, which may limit adoption in cost-sensitive markets. Technical limitations also persist regarding material capabilities and operational conditions that may reduce effectiveness in heavy-load or challenging transportation environments, which affect strength performance and material consistency.
The mesh bag market will expand from USD 3.8B in 2025 to USD 6.2B by 2035, adding USD 2.4B in new value. Growth opportunities cluster around advanced nylon materials, agriculture & produce applications, retail demand, and reusable packaging integration.
Primary Classification: The market segments by material type into nylon, polyethylene, polypropylene, and cotton, representing the evolution from basic mesh materials to specialized breathable solutions for comprehensive packaging optimization.
Secondary Classification: Application segmentation divides the market into agriculture & produce, retail & consumer goods, industrial & construction, and others, reflecting distinct requirements for operational performance, ventilation compliance, and material efficiency standards.
Regional Classification: Geographic distribution covers North America, Latin America, Western Europe, Eastern Europe, East Asia, South Asia Pacific, and Middle East & Africa, with emerging markets leading adoption while developed economies show steady growth patterns driven by reusable packaging programs.
The segmentation structure reveals technology progression from standard mesh materials toward specialized breathable systems with enhanced performance and durability capabilities, while application diversity spans from agricultural facilities to retail operations requiring precise airflow and strength control solutions.
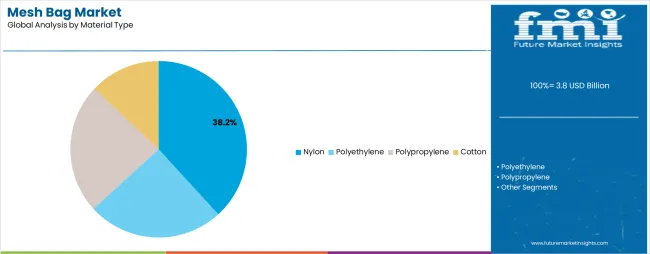
Market Position: Nylon mesh systems command the leading position in the mesh bag market with 38.2% share and 5.6% CAGR through advanced durability features, including superior tear resistance, operational flexibility, and material optimization that enable agricultural operators to achieve optimal produce storage across diverse farming and distribution environments.
Value Drivers: The segment benefits from farmer preference for durable packaging systems that provide extended lifespan, reusability, and load-bearing capacity without requiring frequent replacement. Advanced weaving features enable consistent ventilation, strength reliability, and integration with existing handling infrastructure, where durability and material efficiency represent critical operational requirements.
Competitive Advantages: Nylon mesh systems differentiate through proven operational stability, consistent breathability characteristics, and integration with automated filling systems that enhance production effectiveness while maintaining optimal quality standards for diverse agricultural and retail applications.
Key market characteristics:
Polyethylene mesh systems maintain a 29.4% market share in the mesh bag market due to their cost-effective properties and operational advantages. These systems appeal to facilities requiring reliable packaging characteristics with competitive pricing for standard agricultural and industrial applications. Market growth is driven by agricultural expansion, emphasizing economical packaging solutions and operational efficiency through optimized material designs.
Polypropylene captures 22.6% market share through versatile packaging requirements in produce storage facilities, industrial applications, and construction operations. These facilities demand flexible mesh systems capable of operating in diverse environments while providing effective ventilation and operational efficiency.
Cotton accounts for 9.8% market share through specialized natural fiber requirements in organic produce operations, eco-conscious retail, and consumer goods applications requiring biodegradable material capabilities for operational performance and environmental compliance.
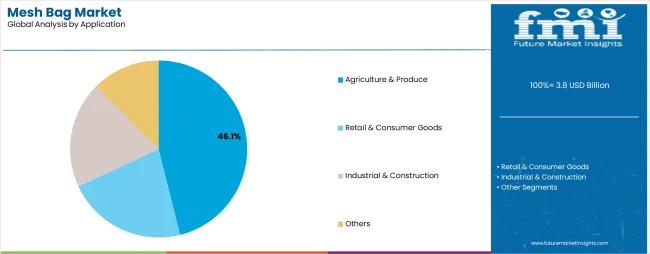
Market Context: Agriculture & Produce applications demonstrate market leadership in the mesh bag market with 46.1% share and 5.3% CAGR due to widespread adoption of breathable packaging systems and increasing focus on produce preservation, extended shelf life, and storage optimization applications that maximize freshness while maintaining agricultural standards.
Appeal Factors: Agricultural operators prioritize material reliability, ventilation optimization, and integration with existing distribution infrastructure that enables coordinated freshness control across multiple storage operations. The segment benefits from substantial agricultural investment and modernization programs that emphasize the acquisition of mesh bag systems for quality control and extended storage life applications.
Growth Drivers: Produce handling trends incorporate mesh bag applications as standard materials for agricultural operations, while farming facility growth increases demand for reliable breathability capabilities that comply with food safety standards and minimize waste complexity.
Market Challenges: Varying agricultural technology standards and storage infrastructure differences may limit material standardization across different facilities or operational scenarios.
Application dynamics include:
Retail & Consumer Goods applications capture 28.7% market share through reusability requirements in grocery retail facilities, consumer packaging operations, and shopping applications. These facilities demand versatile mesh systems capable of operating in retail environments while providing effective product visibility and convenience capabilities.
Industrial & Construction applications account for 17.3% market share, including material handling operations, component storage, and construction site applications requiring durable packaging for operational optimization and product protection.
Other applications account for 7.9% market share, including laundry operations, sports equipment storage, and specialty applications requiring breathable capabilities for operational optimization and product ventilation.
Growth Accelerators: Reusable packaging development drives primary adoption as mesh bags provide durability capabilities that enable agricultural operators to reduce packaging costs without excessive material replacement, supporting farming and retail missions that require extended product life applications. Agricultural demand accelerates market expansion as facilities seek effective systems that minimize spoilage rates while maintaining operational effectiveness during storage and distribution scenarios. Cost optimization spending increases worldwide, creating continued demand for mesh bag systems that complement traditional rigid packaging methods and provide material efficiency in complex agricultural environments.
Growth Inhibitors: Durability concerns vary across regions regarding the longevity of mesh materials and maintenance infrastructure development, which may limit operational flexibility and market penetration in areas with heavy-load requirements or handling challenges. Technical performance limitations persist regarding material capabilities and operational conditions that may reduce effectiveness in extreme weight, challenging environments, or transportation conditions, affecting strength performance and material consistency. Market fragmentation across multiple mesh specifications and quality standards creates compatibility concerns between different material suppliers and existing handling infrastructure.
Market Evolution Patterns: Adoption accelerates in agricultural and retail sectors where reusability requirements justify mesh bag system costs, with geographic concentration in emerging markets transitioning toward mainstream adoption in developed economies driven by environmental initiatives and packaging modernization. Technology development focuses on enhanced tear resistance, improved ventilation consistency, and integration with automated handling systems that optimize material performance and packaging effectiveness. The market could face disruption if alternative reusable technologies or material innovations significantly limit the deployment of traditional mesh materials in agricultural or retail applications.
The mesh bag market demonstrates varied regional dynamics with Growth Leaders including India (5.8% growth rate) and Vietnam (5.5% growth rate) driving expansion through agricultural modernization initiatives and produce handling development. Steady Performers encompass China (5.2% growth rate), Brazil (4.9% growth rate), and United States (4.3% growth rate), benefiting from established agricultural sectors and advanced mesh bag adoption. Emerging Markets feature developing regions where farming initiatives and distribution modernization support consistent growth patterns.
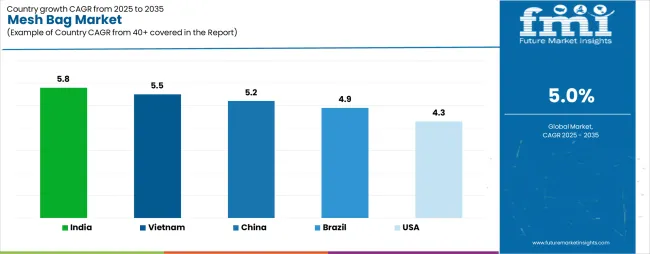
| Country | CAGR (2025-2035) |
|---|---|
| India | 5.8% |
| Vietnam | 5.5% |
| China | 5.2% |
| Brazil | 4.9% |
| United States | 4.3% |
Regional synthesis reveals South Asian markets leading adoption through agricultural expansion and farming development, while East Asian countries maintain steady expansion supported by produce handling technology advancement and distribution standardization requirements. Latin American markets show strong growth driven by agricultural applications and export handling trends.
India establishes fastest market growth through aggressive agricultural modernization programs and comprehensive produce handling development, integrating advanced mesh bags as standard materials in farming and distribution installations. The country's 5.8% growth rate reflects government initiatives promoting agricultural technology and domestic packaging capabilities that mandate the use of advanced breathable systems in produce and agricultural facilities. Growth concentrates in major agricultural regions, including Punjab, Maharashtra, and Uttar Pradesh, where farming technology development showcases integrated mesh bag systems that appeal to agricultural operators seeking advanced storage optimization capabilities and quality management applications.
Indian manufacturers are developing cost-effective mesh bag solutions that combine domestic production advantages with advanced ventilation features, including automated weaving systems and enhanced durability capabilities. Distribution channels through agricultural suppliers and material distributors expand market access, while government support for farming development supports adoption across diverse agricultural and produce segments.
Strategic Market Indicators:
In Mekong Delta, Red River Delta, and Central Highlands, agricultural facilities and produce exporters are implementing advanced mesh bags as standard materials for ventilation optimization and storage applications, driven by increasing export demand and farming modernization programs that emphasize the importance of freshness control capabilities. The market holds a 5.5% growth rate, supported by government agricultural initiatives and produce handling infrastructure development programs that promote advanced mesh bag systems for farming and export facilities. Vietnamese operators are adopting mesh bag systems that provide consistent operational performance and ventilation features, particularly appealing in agricultural regions where produce freshness and durability represent critical export requirements.
Market expansion benefits from growing agricultural technology manufacturing capabilities and international technology transfer agreements that enable domestic production of advanced mesh bag systems for farming and produce applications. Technology adoption follows patterns established in agricultural equipment, where durability and quality drive procurement decisions and operational deployment.
Market Intelligence Brief:
China establishes market leadership through comprehensive agricultural programs and advanced farming infrastructure development, integrating mesh bags across produce and agricultural applications. The country's 5.2% growth rate reflects established agricultural relationships and mature mesh bag technology adoption that supports widespread use of breathable systems in farming and distribution facilities. Growth concentrates in major agricultural provinces, including Shandong, Henan, and Hebei, where agricultural technology showcases mature mesh bag deployment that appeals to farming operators seeking proven ventilation capabilities and operational efficiency applications.
Chinese mesh bag providers leverage established distribution networks and comprehensive service capabilities, including technical programs and quality support that create customer relationships and operational advantages. The market benefits from mature agricultural regulations and packaging standards that mandate mesh bag use while supporting technology advancement and operational optimization.
Market Intelligence Brief:
Brazil establishes agricultural market leadership through comprehensive farming programs and advanced produce infrastructure development, integrating mesh bags across agricultural and export applications. The country's 4.9% growth rate reflects established farming relationships and mature mesh bag technology adoption that supports widespread use of breathable systems in produce and distribution facilities. Growth concentrates in major agricultural states, including São Paulo, Minas Gerais, and Paraná, where farming technology showcases mature mesh bag deployment that appeals to agricultural operators seeking proven ventilation capabilities and operational efficiency applications.
Brazilian mesh bag providers leverage established distribution networks and comprehensive service capabilities, including quality programs and technical support that create customer relationships and operational advantages. The market benefits from mature agricultural regulations and export standards that mandate mesh bag use while supporting technology advancement and operational optimization.
Market Intelligence Brief:
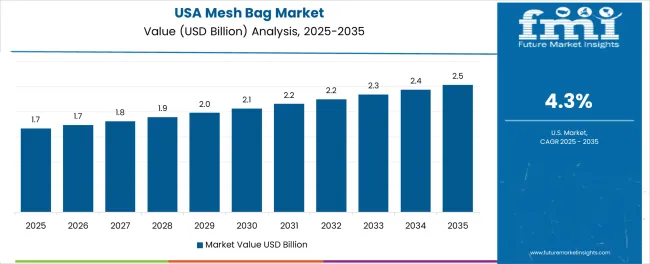
The United States' market growth reflects established agricultural infrastructure and comprehensive farming standards, with mesh bag adoption concentrated in produce distribution and retail applications. The country's 4.3% growth rate benefits from mature agricultural technology infrastructure and established quality control systems that prioritize material consistency and ventilation performance. American operators emphasize durability, reusability characteristics, and compatibility with automated handling platforms, where operational efficiency represents standard requirements.
Market characteristics include high reliance on nylon materials for agricultural applications, integration with distribution management systems, and focus on material strength and long-term ventilation stability. Demand concentrates in California, Florida, and Washington, where agricultural facilities and retail operations implement advanced mesh bag systems for produce storage and quality assurance.
Strategic Market Considerations:
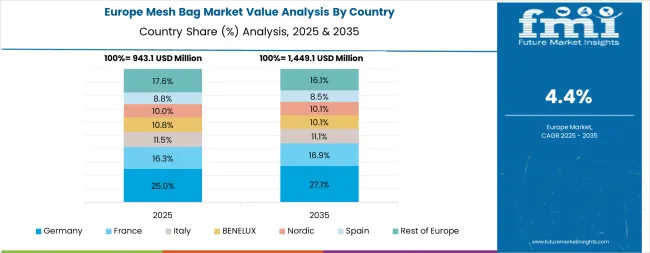
The European mesh bag market is projected to grow from USD 0.9 billion in 2025 to USD 1.4 billion by 2035, registering a CAGR of 4.5% over the forecast period. Germany is expected to maintain its leadership position with a 26.3% market share in 2025, supported by its advanced agricultural technology infrastructure and major produce distribution centers.
France follows with a 23.7% share in 2025, driven by comprehensive farming programs and retail packaging development initiatives. Spain holds a 19.4% share through specialized agricultural applications and export requirements. Italy commands a 16.8% share, while United Kingdom accounts for 10.5% in 2025. The rest of Europe region is anticipated to gain momentum, expanding its collective share from 3.3% to 3.8% by 2035, attributed to increasing agricultural adoption in Nordic countries and emerging farming facilities implementing modernization programs.
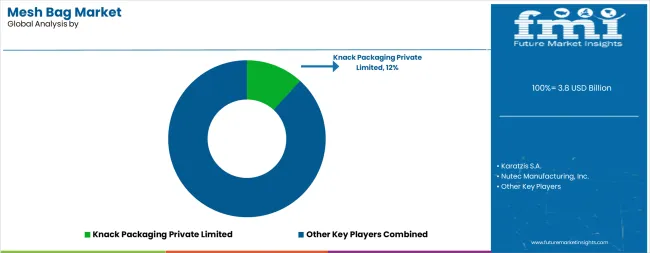
The mesh bag market operates with moderate concentration, featuring approximately 40-50 meaningful participants, where leading companies control roughly 32-36% of the global market share through established agricultural relationships and comprehensive mesh bag portfolios. Competition emphasizes advanced durability capabilities, material reliability, and production integration rather than price-based rivalry.
Market leaders encompass Knack Packaging Private Limited, Karatzis S.A., and Nutec Manufacturing, Inc., which maintain competitive advantages through extensive mesh bag technology expertise, global distributor networks, and comprehensive material integration capabilities that create customer switching costs and support premium pricing. These companies leverage decades of mesh bag technology experience and ongoing research investments to develop advanced breathable systems with precision ventilation control and quality monitoring features.
Technology innovators include Tex-Pro Inc., Agribag International Ltd., and Tufbag Industrial Co. Ltd., which compete through specialized mesh bag technology focus and innovative material interfaces that appeal to agricultural operators seeking advanced ventilation capabilities and operational flexibility. These companies differentiate through rapid technology development cycles and specialized agricultural application focus.
Regional specialists feature companies like Leno Mesh Bags, Mesh Bag Co., and KB Poly Industries, which focus on specific geographic markets and specialized applications, including specialty ventilation and integrated storage solutions. Market dynamics favor participants that combine reliable breathability capabilities with advanced production software, including precision freshness control and automatic quality optimization capabilities. Competitive pressure intensifies as traditional packaging manufacturers expand into mesh systems, while specialized material companies challenge established players through innovative ventilation solutions and cost-effective materials targeting specialized agricultural segments.
| Item | Value |
|---|---|
| Quantitative Units | USD 3.8 billion |
| Material Type | Nylon, Polyethylene, Polypropylene, Cotton |
| Application | Agriculture & Produce, Retail & Consumer Goods, Industrial & Construction, Others |
| Regions Covered | North America, Latin America, Western Europe, Eastern Europe, East Asia, South Asia Pacific, Middle East & Africa |
| Countries Covered | India, Vietnam, China, Brazil, United States, Germany, France, Spain, Italy, United Kingdom, and 25+ additional countries |
| Key Companies Profiled | Knack Packaging Private Limited, Karatzis S.A., Nutec Manufacturing, Inc., Tex-Pro Inc., Agribag International Ltd., Tufbag Industrial Co. Ltd., Leno Mesh Bags, Mesh Bag Co. |
| Additional Attributes | Dollar sales by material type and application categories, regional adoption trends across South Asia Pacific, East Asia, and Latin America, competitive landscape with packaging manufacturers and technical material suppliers, agricultural operator preferences for precision ventilation control and material reliability, integration with handling platforms and quality monitoring systems, innovations in mesh bag technology and breathability enhancement, and development of automated production solutions with enhanced performance and storage optimization capabilities |
The global mesh bag market is estimated to be valued at USD 3.8 billion in 2025.
The market size for the mesh bag market is projected to reach USD 6.2 billion by 2035.
The mesh bag market is expected to grow at a 5.0% CAGR between 2025 and 2035.
The key product types in mesh bag market are nylon, polyethylene, polypropylene and cotton.
In terms of application, agriculture & produce segment to command 46.1% share in the mesh bag market in 2025.


Full Research Suite comprises of:
Market outlook & trends analysis
Interviews & case studies
Strategic recommendations
Vendor profiles & capabilities analysis
5-year forecasts
8 regions and 60+ country-level data splits
Market segment data splits
12 months of continuous data updates
DELIVERED AS:
PDF EXCEL ONLINE
Understanding Market Share Trends in Mesh Bags
Monofilament Mesh Filter Bags Market Size and Share Forecast Outlook 2025 to 2035
Nylon Monofilament Mesh Filter Bags Market Size and Share Forecast Outlook 2025 to 2035
Mesh Fabric Market Size and Share Forecast Outlook 2025 to 2035
Mesh Nebulizer for Kids Market Size and Share Forecast Outlook 2025 to 2035
Mesh Tarpaulin Sheets Market Size and Share Forecast Outlook 2025 to 2035
Foam Mesh Sleeves Market Growth - Demand & Forecast 2025 to 2035
Hernia Mesh Devices Market Size and Share Forecast Outlook 2025 to 2035
Handheld Mesh Nebulizer Market Size and Share Forecast Outlook 2025 to 2035
Wireless Mesh Network Market Size and Share Forecast Outlook 2025 to 2035
Surgical Mesh Market
Screen Printing Mesh Market Size and Share Forecast Outlook 2025 to 2035
Breast Reconstruction Meshes Market Size and Share Forecast Outlook 2025 to 2035
Surgical Polypropylene Mesh Market
Biomaterial In Surgical Mesh Market Size and Share Forecast Outlook 2025 to 2035
Bag in Tube Market Size and Share Forecast Outlook 2025 to 2035
Bagasse Tableware Products Market Size and Share Forecast Outlook 2025 to 2035
Bag Closure Clips Market Size and Share Forecast Outlook 2025 to 2035
Bag-in-box Packaging Market Size and Share Forecast Outlook 2025 to 2035
Bag Making Machine Market Size and Share Forecast Outlook 2025 to 2035

Thank you!
You will receive an email from our Business Development Manager. Please be sure to check your SPAM/JUNK folder too.
Chat With
MaRIA