Reports

- Global Locations -

Headquarters

Future Market Insights, Inc.

Christiana Corporate, 200
Continental Drive, Suite 401,
Newark, Delaware - 19713,
United States

T: +1-845-579-5705

Americas

Future Market Insights, Inc.

616 Corporate Way, Suite 2-9018,
Valley Cottage, NY 10989, United States

T: +1-347-918-3531

MEA

Future Market Insights

1602-6 Jumeirah Bay X2 Tower, Plot No: JLT-PH2-X2A,
Jumeirah Lakes Towers, Dubai,
United Arab Emirates

Europe

Future Market Insights

3rd Floor, 207 Regent Street,
W1B 3HH London
United Kingdom

T: + 44 (0) 20 8123 9659
D: +44 (0) 20 3287 4268

Asia Pacific

Future Market Insights

IndiaLand Global Tech Park, Unit UG-1, Behind Grand HighStreet, Phase 1, Hinjawadi, MH, Pune – 411057, India

Ocular Tuberculosis Therapeutics Market Outlook (2022-2032)

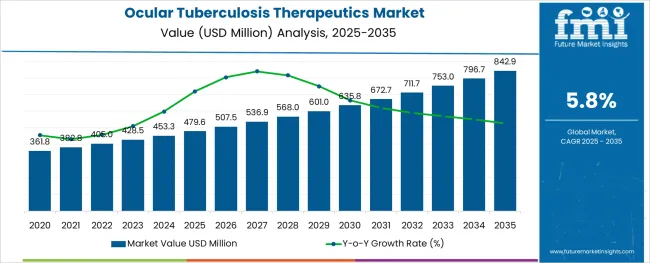
[333 Pages Report] The global ocular tuberculosis therapeutics market is forecasted to be valued at US$ 753.2 million by 2032, up from US$ 405.0 million in 2022 and is advancing at a CAGR of 5.8% during the forecast period.

Report Attribute Details
Ocular Tuberculosis Therapeutics Market Value (2022) US$ 405.0 Million
Ocular Tuberculosis Therapeutics Market Anticipated Value (2032) US$ 753.2 Million
Ocular Tuberculosis Therapeutics Projected Growth Rate (2022-2032) 5.8%

It is identified that ocular tuberculosis is a rare form of tuberculosis that infects various parts of an eye including the lid, cornea, or the surrounding areas. According to the data of WHO, tuberculosis is one of the top ten landing causes of death in the world. Therefore, to minimize the death rate and the number of people affected by ocular tuberculosis, the ocular tuberculosis therapeutics market size is on the rise.

The demand for ocular tuberculosis therapeutics is increasing as there are a large number of cases of secondary ocular tuberculosis due to hematogenous spread from distant sites or by direct invasions from adjacent structures like the cranial cavity or sinus.

Therefore, it is anticipated that the population suffering from ocular tuberculosis are resorting to ocular tuberculosis therapeutics and the market is likely to witness significant growth during the forecast period.

Don't pay for what you don't need

Customize your report by selecting specific countries or regions and save 30%!

What are the Demand Drivers for the Ocular Tuberculosis Therapeutics Market?

When given in the correct dosage, the various combination of drugs leads to the prevention of incidence of ocular tuberculosis, curing the disease. This factor is driving the market for ocular tuberculosis therapeutics.

Moreover, the growth of the ocular tuberculosis therapeutics market can be attributed to the rising demand for improved therapeutics that can treat tuberculosis, including ocular tuberculosis.

Furthermore, combination therapy in the ocular tuberculosis therapeutics market is being highly adopted because of the growing prevalence of multi-drug resistant tuberculosis.

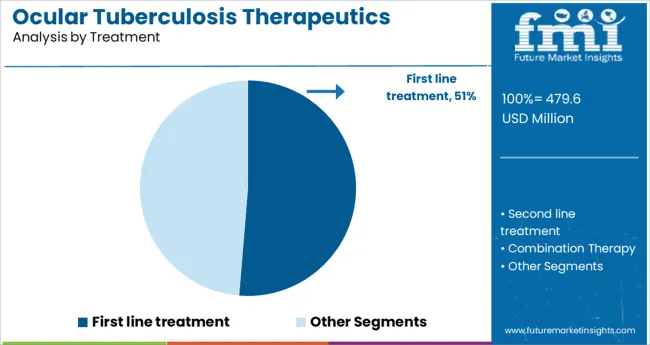
In addition to this, the first-line drugs lie Rifampicin, Ethambutol, Isoniazid, and Pyrazinamide, which are being used at the initial stage of tuberculosis and are having high demand in the therapeutics market. Some second-line drugs in high demand are Fluoroquinolones, Cycloserine, Thioamides, and others. It is anticipated that the demand for these drugs is a key driving factor in the ocular tuberculosis therapeutics market and is likely to boost the demand for the product during the forecast period.

Furthermore, it is projected that the increased funding I clinical research and healthcare by both public and private institutions, along with government organizations, is a major factor leading to the expansion of the ocular tuberculosis therapeutics market.

What are the Driving Challenges in the Ocular Tuberculosis Therapeutics Market?

It is anticipated that there is a lack of medical check-up protocol, which is expected to hinder the growth of the ocular tuberculosis therapeutics market over the upcoming years.

Furthermore, ocular tuberculosis is a very rare condition and is currently undergoing study and research. In regards to this, there is very limited availability of necessary therapeutics or other drugs for the treatment of tuberculosis in the eye. This factor is estimated to curb the growth of the ocular tuberculosis therapeutics market.
Sabyasachi Ghosh
Sabyasachi Ghosh

Principal Consultant

Talk to Analyst

Find your sweet spots for generating winning opportunities in this market.

Regional Analysis

How is the Performance of the North America Ocular Tuberculosis Therapeutics Market?

North America is projected to hold the largest market share of the ocular tuberculosis therapeutics market. It is currently accountable for 36.0% of the total market share for the ocular tuberculosis therapeutics market.

This expansion and growth in the North American regions can be attributed to the increasing number of developments in the healthcare industry.

It is also anticipated that the North American region has a growing demand for better and advanced tuberculosis therapies, which is driving the expansion of the market size of the ocular tuberculosis therapeutics market.

What is the Growth Outlook for the Europe Ocular Tuberculosis Therapeutics Market?

The European region has a potential growth outlook for the ocular tuberculosis therapeutics market. It is currently accountable for 27.9% of the total market share of the ocular tuberculosis therapeutics market.

The growing demand for ocular tuberculosis therapeutics in this region is due to the increasing population of this region, coupled with rising disposable income, which is driving the populace to undergo therapies that cure ocular tuberculosis faster.

In addition to that, there are research grants offered by various organizations in this region in ocular tuberculosis therapeutics to bring in more product developments.

Start-up Ecosystem

How are New Entrants Revolutionizing the Ocular Tuberculosis Therapeutics Market?

The start-up ecosystem in the ocular tuberculosis therapeutics market is intense with frequent innovations being made. Start-ups in the ocular tuberculosis therapeutics market are focusing on improvising the therapeutics for faster cure delivery to the patients.

Indian start-up Everwell has developed HealthTech technologies for patient adherence. The start-up’s digital adherence technology, 99DOTS, uses low-cost packaging with hidden codes to encourage patients to take their medications daily. It requires the patient to register daily adherence by communicating the hidden code via a toll-free call, SMS, or other channels.

Quartis, is a South Korean startup developing a novel TB vaccine. The start-up’s subunit vaccine, QTP101, target multiple antigens associated with virulence and latency.

Swedish start-up Astrego offers in-vitro diagnostics solutions to tackle antimicrobial resistance. The start-up’s PA-100 system uses a desktop instrument and specific panels for rapid screening. The auto-mated solution provides personalized antibiotic prescriptions for tuberculosis, as well as urinary tract infections, respiratory conditions, and sepsis.
Get the data you need at a Fraction of the cost

Personalize your report by choosing insights you need
and save 40%!

Competitive Landscape

Who are some of the Key Market Players in the Ocular Tuberculosis Therapeutics Market?

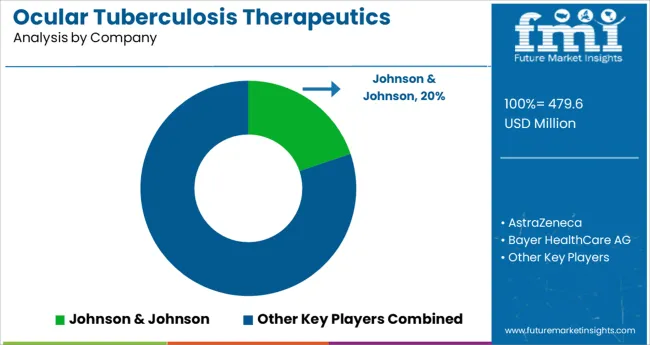
Some of the ocular tuberculosis therapeutics market participants are AstraZeneca, Bayer HealthCare AG, Biological E, BioVersys, Cadila Pharmaceuticals, Concept Pharmaceuticals Ltd., Infectex, Johnson & Johnson, Labatec-Pharma SA, Lupin Pharmaceuticals Inc., Macleods Pharmaceuticals Ltd., Maneesh Pharmaceuticals, Novartis, Otsuka Novel Products, Pfizer, Pharmasyntez, Sandoz, Sanofi, Sequella, Inc., and Themis Medicare Ltd.

The key players in the market are involving themselves in the development of improvised therapeutics. They are receiving raised initiatives by the government for the promotion of research and development activities for bringing advanced solutions for ocular tuberculosis and fast-cure range of therapeutics in the global ocular tuberculosis therapeutics market

Key Developments in the Ocular Tuberculosis Therapeutics Market

Some key developments in the ocular tuberculosis therapeutics market are:

  • In June 2017, Dr Soumyava Basu received a grant of US$ 46,638 from the Department of Health Research (DHR) and the Indian Council of Medical Research (ICMR) to conduct a clinical trial on ocular TB research.
  • In April 2017, Cebu City Jail made HIV and tuberculosis testing mandatory for the inmates.

Report Scope

Report Attribute Details
Growth Rate CAGR of 5.8% from 2022 to 2032
Base Year for Estimation 2021
Historical Data 2016 to 2021
Forecast Period 2022 to 2032
Quantitative Units Revenue in USD million and CAGR from 2022-2032
Report Coverage Revenue Forecast, Volume Forecast, Company Ranking, Competitive Landscape, Growth Factors, Trends and Pricing Analysis
Segments Covered
  • Treatment
  • End User
  • Region
Regions Covered
  • North America
  • Latin America
  • Europe
  • East Asia
  • South Asia
  • Oceania
  • Middle East and Africa
Key Countries Profiled
  • USA
  • Canada
  • Brazil
  • Argentina
  • Germany
  • UK
  • France
  • Spain
  • Italy
  • Nordics
  • BENELUX
  • Australia & New Zealand
  • China
  • India
  • ASEAN
  • GCC
  • South Africa
Key Companies Profiled
  • AstraZeneca
  • Bayer HealthCare AG
  • Biological E
  • BioVersys
  • Cadila Pharmaceuticals
  • Concept Pharmaceuticals Ltd.
  • Infectex, Johnson & Johnson
  • Labatec-Pharma SA
  • Lupin Pharmaceuticals Inc.
  • Macleods Pharmaceuticals Ltd.
  • Maneesh Pharmaceuticals
  • Novartis
  • Otsuka Novel Products
  • Pfizer
  • Pharmasyntez
  • Sandoz
  • Sanofi
  • Sequella, Inc.
  • Themis Medicare Ltd.
Customization Available Upon Request

Key Segments in the Ocular Tuberculosis Therapeutics Market

By Treatment Type:

  • First line treatment
  • Rifampicin
  • Isoniazid
  • Ethambutol
  • Pyrazinamide
  • Second line treatment
  • Other

By End-User:

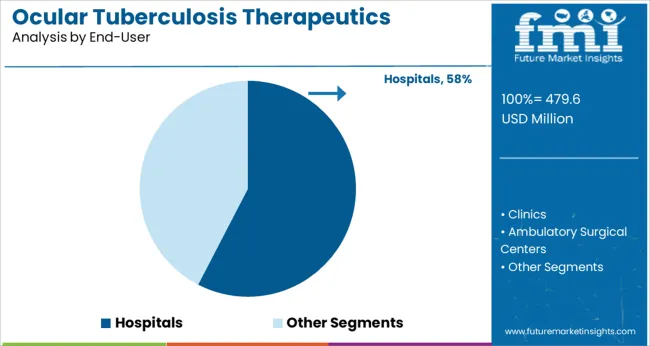
  • Hospital
  • Clinics
  • Ambulatory Surgical Centers

Frequently Asked Questions

What is the Growth Outlook for the Ocular Tuberculosis Therapeutics Market?

The ocular tuberculosis therapeutics market is predicted to advance at a CAGR of 5.8% from 2022 to 2032.

Which Region Leads the Ocular Tuberculosis Therapeutics Market?

The North American region is anticipated to lead the ocular tuberculosis therapeutics market during the forecast period.

How much Growth Potential does the Ocular Tuberculosis Therapeutics Market hold?

The ocular tuberculosis therapeutics market is likely to hold a valuation of US$ 753.2 million by 2032.

Which sector is the Key Contributor to the Ocular Tuberculosis Therapeutics Market?

The healthcare and hospital sector are the key contributors to the ocular tuberculosis therapeutics market.

Table of Content

1. Executive Summary

    1.1. Global Market Outlook

    1.2. Demand-side Trends

    1.3. Supply-side Trends

    1.4. Technology Roadmap Analysis

    1.5. Analysis and Recommendations

2. Market Overview

    2.1. Market Coverage / Taxonomy

    2.2. Market Definition / Scope / Limitations

3. Market Background

    3.1. Market Dynamics

        3.1.1. Drivers

        3.1.2. Restraints

        3.1.3. Opportunity

        3.1.4. Trends

    3.2. Scenario Forecast

        3.2.1. Demand in Optimistic Scenario

        3.2.2. Demand in Likely Scenario

        3.2.3. Demand in Conservative Scenario

    3.3. Opportunity Map Analysis

    3.4. Investment Feasibility Matrix

    3.5. PESTLE and Porter’s Analysis

    3.6. Regulatory Landscape

        3.6.1. By Key Regions

        3.6.2. By Key Countries

    3.7. Regional Parent Market Outlook

4. Global Ocular Tuberculosis Therapeutics Market Analysis 2017-2021 and Forecast, 2022-2032

    4.1. Historical Market Size Value (US$ Mn) Analysis, 2017-2021

    4.2. Current and Future Market Size Value (US$ Mn) Projections, 2022-2032

        4.2.1. Y-o-Y Growth Trend Analysis

        4.2.2. Absolute $ Opportunity Analysis

5. Global Ocular Tuberculosis Therapeutics Market Analysis 2017-2021 and Forecast 2022-2032, By Treatment

    5.1. Introduction / Key Findings

    5.2. Historical Market Size Value (US$ Mn) Analysis By Treatment, 2017-2021

    5.3. Current and Future Market Size Value (US$ Mn) Analysis and Forecast By Treatment, 2022-2032

        5.3.1. First line treatment

            5.3.1.1. Rifampicin

            5.3.1.2. Isoniazide

            5.3.1.3. Ethambutol

            5.3.1.4. Pyrazinamide

        5.3.2. Second line treatment

            5.3.2.1. Flouroquinolones

            5.3.2.2. Aminoglycosides

            5.3.2.3. Cycloserine

            5.3.2.4. Polypeptides

            5.3.2.5. p-Aminosalicylic Acid

            5.3.2.6. Thioamides

        5.3.3. Combination Therapy

    5.4. Y-o-Y Growth Trend Analysis By Treatment, 2017-2021

    5.5. Absolute $ Opportunity Analysis By Treatment, 2022-2032

6. Global Ocular Tuberculosis Therapeutics Market Analysis 2017-2021 and Forecast 2022-2032, By end-user

    6.1. Introduction / Key Findings

    6.2. Historical Market Size Value (US$ Mn) Analysis By end-user, 2017-2021

    6.3. Current and Future Market Size Value (US$ Mn) Analysis and Forecast By end-user, 2022-2032

        6.3.1. Hospital

        6.3.2. Clinics

        6.3.3. Ambulatory Surgical Centers

    6.4. Y-o-Y Growth Trend Analysis By end-user, 2017-2021

    6.5. Absolute $ Opportunity Analysis By end-user, 2022-2032

7. Global Ocular Tuberculosis Therapeutics Market Analysis 2017-2021 and Forecast 2022-2032, By Region

    7.1. Introduction

    7.2. Historical Market Size Value (US$ Mn) Analysis By Region, 2017-2021

    7.3. Current Market Size Value (US$ Mn) Analysis and Forecast By Region, 2022-2032

        7.3.1. North America

        7.3.2. Latin America

        7.3.3. Europe

        7.3.4. Asia Pacific

        7.3.5. MEA

    7.4. Market Attractiveness Analysis By Region

8. North America Ocular Tuberculosis Therapeutics Market Analysis 2017-2021 and Forecast 2022-2032, By Country

    8.1. Historical Market Size Value (US$ Mn) Trend Analysis By Market Taxonomy, 2017-2021

    8.2. Market Size Value (US$ Mn) Forecast By Market Taxonomy, 2022-2032

        8.2.1. By Country

            8.2.1.1. U.S.

            8.2.1.2. Canada

        8.2.2. By Treatment

        8.2.3. By end-user

    8.3. Market Attractiveness Analysis

        8.3.1. By Country

        8.3.2. By Treatment

        8.3.3. By end-user

    8.4. Key Takeaways

9. Latin America Ocular Tuberculosis Therapeutics Market Analysis 2017-2021 and Forecast 2022-2032, By Country

    9.1. Historical Market Size Value (US$ Mn) Trend Analysis By Market Taxonomy, 2017-2021

    9.2. Market Size Value (US$ Mn) Forecast By Market Taxonomy, 2022-2032

        9.2.1. By Country

            9.2.1.1. Brazil

            9.2.1.2. Mexico

            9.2.1.3. Rest of Latin America

        9.2.2. By Treatment

        9.2.3. By end-user

    9.3. Market Attractiveness Analysis

        9.3.1. By Country

        9.3.2. By Treatment

        9.3.3. By end-user

    9.4. Key Takeaways

10. Europe Ocular Tuberculosis Therapeutics Market Analysis 2017-2021 and Forecast 2022-2032, By Country

    10.1. Historical Market Size Value (US$ Mn) Trend Analysis By Market Taxonomy, 2017-2021

    10.2. Market Size Value (US$ Mn) Forecast By Market Taxonomy, 2022-2032

        10.2.1. By Country

            10.2.1.1. Germany

            10.2.1.2. U.K.

            10.2.1.3. France

            10.2.1.4. Spain

            10.2.1.5. Italy

            10.2.1.6. Rest of Europe

        10.2.2. By Treatment

        10.2.3. By end-user

    10.3. Market Attractiveness Analysis

        10.3.1. By Country

        10.3.2. By Treatment

        10.3.3. By end-user

    10.4. Key Takeaways

11. Asia Pacific Ocular Tuberculosis Therapeutics Market Analysis 2017-2021 and Forecast 2022-2032, By Country

    11.1. Historical Market Size Value (US$ Mn) Trend Analysis By Market Taxonomy, 2017-2021

    11.2. Market Size Value (US$ Mn) Forecast By Market Taxonomy, 2022-2032

        11.2.1. By Country

            11.2.1.1. China

            11.2.1.2. Japan

            11.2.1.3. South Korea

            11.2.1.4. Malaysia

            11.2.1.5. Singapore

            11.2.1.6. Australia

            11.2.1.7. New Zealand

            11.2.1.8. Rest of APAC

        11.2.2. By Treatment

        11.2.3. By end-user

    11.3. Market Attractiveness Analysis

        11.3.1. By Country

        11.3.2. By Treatment

        11.3.3. By end-user

    11.4. Key Takeaways

12. MEA Ocular Tuberculosis Therapeutics Market Analysis 2017-2021 and Forecast 2022-2032, By Country

    12.1. Historical Market Size Value (US$ Mn) Trend Analysis By Market Taxonomy, 2017-2021

    12.2. Market Size Value (US$ Mn) Forecast By Market Taxonomy, 2022-2032

        12.2.1. By Country

            12.2.1.1. GCC Countries

            12.2.1.2. South Africa

            12.2.1.3. Israel

            12.2.1.4. Rest of MEA

        12.2.2. By Treatment

        12.2.3. By end-user

    12.3. Market Attractiveness Analysis

        12.3.1. By Country

        12.3.2. By Treatment

        12.3.3. By end-user

    12.4. Key Takeaways

13. Key Countries Ocular Tuberculosis Therapeutics Market Analysis

    13.1. U.S.

        13.1.1. Pricing Analysis

        13.1.2. Market Share Analysis, 2021

            13.1.2.1. By Treatment

            13.1.2.2. By end-user

    13.2. Canada

        13.2.1. Pricing Analysis

        13.2.2. Market Share Analysis, 2021

            13.2.2.1. By Treatment

            13.2.2.2. By end-user

    13.3. Brazil

        13.3.1. Pricing Analysis

        13.3.2. Market Share Analysis, 2021

            13.3.2.1. By Treatment

            13.3.2.2. By end-user

    13.4. Mexico

        13.4.1. Pricing Analysis

        13.4.2. Market Share Analysis, 2021

            13.4.2.1. By Treatment

            13.4.2.2. By end-user

    13.5. Germany

        13.5.1. Pricing Analysis

        13.5.2. Market Share Analysis, 2021

            13.5.2.1. By Treatment

            13.5.2.2. By end-user

    13.6. U.K.

        13.6.1. Pricing Analysis

        13.6.2. Market Share Analysis, 2021

            13.6.2.1. By Treatment

            13.6.2.2. By end-user

    13.7. France

        13.7.1. Pricing Analysis

        13.7.2. Market Share Analysis, 2021

            13.7.2.1. By Treatment

            13.7.2.2. By end-user

    13.8. Spain

        13.8.1. Pricing Analysis

        13.8.2. Market Share Analysis, 2021

            13.8.2.1. By Treatment

            13.8.2.2. By end-user

    13.9. Italy

        13.9.1. Pricing Analysis

        13.9.2. Market Share Analysis, 2021

            13.9.2.1. By Treatment

            13.9.2.2. By end-user

    13.10. China

        13.10.1. Pricing Analysis

        13.10.2. Market Share Analysis, 2021

            13.10.2.1. By Treatment

            13.10.2.2. By end-user

    13.11. Japan

        13.11.1. Pricing Analysis

        13.11.2. Market Share Analysis, 2021

            13.11.2.1. By Treatment

            13.11.2.2. By end-user

    13.12. South Korea

        13.12.1. Pricing Analysis

        13.12.2. Market Share Analysis, 2021

            13.12.2.1. By Treatment

            13.12.2.2. By end-user

    13.13. Malaysia

        13.13.1. Pricing Analysis

        13.13.2. Market Share Analysis, 2021

            13.13.2.1. By Treatment

            13.13.2.2. By end-user

    13.14. Singapore

        13.14.1. Pricing Analysis

        13.14.2. Market Share Analysis, 2021

            13.14.2.1. By Treatment

            13.14.2.2. By end-user

    13.15. Australia

        13.15.1. Pricing Analysis

        13.15.2. Market Share Analysis, 2021

            13.15.2.1. By Treatment

            13.15.2.2. By end-user

    13.16. New Zealand

        13.16.1. Pricing Analysis

        13.16.2. Market Share Analysis, 2021

            13.16.2.1. By Treatment

            13.16.2.2. By end-user

    13.17. GCC Countries

        13.17.1. Pricing Analysis

        13.17.2. Market Share Analysis, 2021

            13.17.2.1. By Treatment

            13.17.2.2. By end-user

    13.18. South Africa

        13.18.1. Pricing Analysis

        13.18.2. Market Share Analysis, 2021

            13.18.2.1. By Treatment

            13.18.2.2. By end-user

    13.19. Israel

        13.19.1. Pricing Analysis

        13.19.2. Market Share Analysis, 2021

            13.19.2.1. By Treatment

            13.19.2.2. By end-user

14. Market Structure Analysis

    14.1. Competition Dashboard

    14.2. Competition Benchmarking

    14.3. Market Share Analysis of Top Players

        14.3.1. By Regional

        14.3.2. By Treatment

        14.3.3. By end-user

15. Competition Analysis

    15.1. Competition Deep Dive

        15.1.1. AstraZeneca

            15.1.1.1. Overview

            15.1.1.2. Product Portfolio

            15.1.1.3. Profitability by Market Segments

            15.1.1.4. Sales Footprint

            15.1.1.5. Strategy Overview

                15.1.1.5.1. Marketing Strategy

        15.1.2. Bayer HealthCare AG

            15.1.2.1. Overview

            15.1.2.2. Product Portfolio

            15.1.2.3. Profitability by Market Segments

            15.1.2.4. Sales Footprint

            15.1.2.5. Strategy Overview

                15.1.2.5.1. Marketing Strategy

        15.1.3. Biological E

            15.1.3.1. Overview

            15.1.3.2. Product Portfolio

            15.1.3.3. Profitability by Market Segments

            15.1.3.4. Sales Footprint

            15.1.3.5. Strategy Overview

                15.1.3.5.1. Marketing Strategy

        15.1.4. BioVersys

            15.1.4.1. Overview

            15.1.4.2. Product Portfolio

            15.1.4.3. Profitability by Market Segments

            15.1.4.4. Sales Footprint

            15.1.4.5. Strategy Overview

                15.1.4.5.1. Marketing Strategy

        15.1.5. Cadila Pharmaceuticals

            15.1.5.1. Overview

            15.1.5.2. Product Portfolio

            15.1.5.3. Profitability by Market Segments

            15.1.5.4. Sales Footprint

            15.1.5.5. Strategy Overview

                15.1.5.5.1. Marketing Strategy

        15.1.6. Concept Pharmaceuticals Ltd.

            15.1.6.1. Overview

            15.1.6.2. Product Portfolio

            15.1.6.3. Profitability by Market Segments

            15.1.6.4. Sales Footprint

            15.1.6.5. Strategy Overview

                15.1.6.5.1. Marketing Strategy

        15.1.7. Infectex, Johnson & Johnson

            15.1.7.1. Overview

            15.1.7.2. Product Portfolio

            15.1.7.3. Profitability by Market Segments

            15.1.7.4. Sales Footprint

            15.1.7.5. Strategy Overview

                15.1.7.5.1. Marketing Strategy

        15.1.8. Labatec-Pharma SA

            15.1.8.1. Overview

            15.1.8.2. Product Portfolio

            15.1.8.3. Profitability by Market Segments

            15.1.8.4. Sales Footprint

            15.1.8.5. Strategy Overview

                15.1.8.5.1. Marketing Strategy

        15.1.9. Lupin Pharmaceuticals Inc.

            15.1.9.1. Overview

            15.1.9.2. Product Portfolio

            15.1.9.3. Profitability by Market Segments

            15.1.9.4. Sales Footprint

            15.1.9.5. Strategy Overview

                15.1.9.5.1. Marketing Strategy

        15.1.10. Macleods Pharmaceuticals Ltd.

            15.1.10.1. Overview

            15.1.10.2. Product Portfolio

            15.1.10.3. Profitability by Market Segments

            15.1.10.4. Sales Footprint

            15.1.10.5. Strategy Overview

                15.1.10.5.1. Marketing Strategy

        15.1.11. Maneesh Pharmaceuticals

            15.1.11.1. Overview

            15.1.11.2. Product Portfolio

            15.1.11.3. Profitability by Market Segments

            15.1.11.4. Sales Footprint

            15.1.11.5. Strategy Overview

                15.1.11.5.1. Marketing Strategy

        15.1.12. Novartis

            15.1.12.1. Overview

            15.1.12.2. Product Portfolio

            15.1.12.3. Profitability by Market Segments

            15.1.12.4. Sales Footprint

            15.1.12.5. Strategy Overview

                15.1.12.5.1. Marketing Strategy

        15.1.13. Otsuka Novel Products

            15.1.13.1. Overview

            15.1.13.2. Product Portfolio

            15.1.13.3. Profitability by Market Segments

            15.1.13.4. Sales Footprint

            15.1.13.5. Strategy Overview

                15.1.13.5.1. Marketing Strategy

        15.1.14. Pfizer

            15.1.14.1. Overview

            15.1.14.2. Product Portfolio

            15.1.14.3. Profitability by Market Segments

            15.1.14.4. Sales Footprint

            15.1.14.5. Strategy Overview

                15.1.14.5.1. Marketing Strategy

        15.1.15. Pharmasyntez

            15.1.15.1. Overview

            15.1.15.2. Product Portfolio

            15.1.15.3. Profitability by Market Segments

            15.1.15.4. Sales Footprint

            15.1.15.5. Strategy Overview

                15.1.15.5.1. Marketing Strategy

        15.1.16. Sandoz

            15.1.16.1. Overview

            15.1.16.2. Product Portfolio

            15.1.16.3. Profitability by Market Segments

            15.1.16.4. Sales Footprint

            15.1.16.5. Strategy Overview

                15.1.16.5.1. Marketing Strategy

        15.1.17. Sanofi

            15.1.17.1. Overview

            15.1.17.2. Product Portfolio

            15.1.17.3. Profitability by Market Segments

            15.1.17.4. Sales Footprint

            15.1.17.5. Strategy Overview

                15.1.17.5.1. Marketing Strategy

        15.1.18. Sequella, Inc.

            15.1.18.1. Overview

            15.1.18.2. Product Portfolio

            15.1.18.3. Profitability by Market Segments

            15.1.18.4. Sales Footprint

            15.1.18.5. Strategy Overview

                15.1.18.5.1. Marketing Strategy

        15.1.19. Themis Medicare Ltd.

            15.1.19.1. Overview

            15.1.19.2. Product Portfolio

            15.1.19.3. Profitability by Market Segments

            15.1.19.4. Sales Footprint

            15.1.19.5. Strategy Overview

                15.1.19.5.1. Marketing Strategy

16. Assumptions & Acronyms Used

17. Research Methodology

Don't pay for what you don't need

Customize your report by selecting specific countries or regions and save 30%!

List of Tables

Table 1: Global Ocular Tuberculosis Therapeutics Market Value (US$ Mn) Forecast by Region, 2017-2032

Table 2: Global Ocular Tuberculosis Therapeutics Market Value (US$ Mn) Forecast by Treatment, 2017-2032

Table 3: Global Ocular Tuberculosis Therapeutics Market Value (US$ Mn) Forecast by end-user, 2017-2032

Table 4: North America Ocular Tuberculosis Therapeutics Market Value (US$ Mn) Forecast by Country, 2017-2032

Table 5: North America Ocular Tuberculosis Therapeutics Market Value (US$ Mn) Forecast by Treatment, 2017-2032

Table 6: North America Ocular Tuberculosis Therapeutics Market Value (US$ Mn) Forecast by end-user, 2017-2032

Table 7: Latin America Ocular Tuberculosis Therapeutics Market Value (US$ Mn) Forecast by Country, 2017-2032

Table 8: Latin America Ocular Tuberculosis Therapeutics Market Value (US$ Mn) Forecast by Treatment, 2017-2032

Table 9: Latin America Ocular Tuberculosis Therapeutics Market Value (US$ Mn) Forecast by end-user, 2017-2032

Table 10: Europe Ocular Tuberculosis Therapeutics Market Value (US$ Mn) Forecast by Country, 2017-2032

Table 11: Europe Ocular Tuberculosis Therapeutics Market Value (US$ Mn) Forecast by Treatment, 2017-2032

Table 12: Europe Ocular Tuberculosis Therapeutics Market Value (US$ Mn) Forecast by end-user, 2017-2032

Table 13: Asia Pacific Ocular Tuberculosis Therapeutics Market Value (US$ Mn) Forecast by Country, 2017-2032

Table 14: Asia Pacific Ocular Tuberculosis Therapeutics Market Value (US$ Mn) Forecast by Treatment, 2017-2032

Table 15: Asia Pacific Ocular Tuberculosis Therapeutics Market Value (US$ Mn) Forecast by end-user, 2017-2032

Table 16: MEA Ocular Tuberculosis Therapeutics Market Value (US$ Mn) Forecast by Country, 2017-2032

Table 17: MEA Ocular Tuberculosis Therapeutics Market Value (US$ Mn) Forecast by Treatment, 2017-2032

Table 18: MEA Ocular Tuberculosis Therapeutics Market Value (US$ Mn) Forecast by end-user, 2017-2032
Sabyasachi Ghosh
Sabyasachi Ghosh

Principal Consultant

Talk to Analyst

Find your sweet spots for generating winning opportunities in this market.

List of Charts

Figure 1: Global Ocular Tuberculosis Therapeutics Market Value (US$ Mn) by Treatment, 2022-2032

Figure 2: Global Ocular Tuberculosis Therapeutics Market Value (US$ Mn) by end-user, 2022-2032

Figure 3: Global Ocular Tuberculosis Therapeutics Market Value (US$ Mn) by Region, 2022-2032

Figure 4: Global Ocular Tuberculosis Therapeutics Market Value (US$ Mn) Analysis by Region, 2017-2032

Figure 5: Global Ocular Tuberculosis Therapeutics Market Value Share (%) and BPS Analysis by Region, 2022-2032

Figure 6: Global Ocular Tuberculosis Therapeutics Market Y-o-Y Growth (%) Projections by Region, 2022-2032

Figure 7: Global Ocular Tuberculosis Therapeutics Market Value (US$ Mn) Analysis by Treatment, 2017-2032

Figure 8: Global Ocular Tuberculosis Therapeutics Market Value Share (%) and BPS Analysis by Treatment, 2022-2032

Figure 9: Global Ocular Tuberculosis Therapeutics Market Y-o-Y Growth (%) Projections by Treatment, 2022-2032

Figure 10: Global Ocular Tuberculosis Therapeutics Market Value (US$ Mn) Analysis by end-user, 2017-2032

Figure 11: Global Ocular Tuberculosis Therapeutics Market Value Share (%) and BPS Analysis by end-user, 2022-2032

Figure 12: Global Ocular Tuberculosis Therapeutics Market Y-o-Y Growth (%) Projections by end-user, 2022-2032

Figure 13: Global Ocular Tuberculosis Therapeutics Market Attractiveness by Treatment, 2022-2032

Figure 14: Global Ocular Tuberculosis Therapeutics Market Attractiveness by end-user, 2022-2032

Figure 15: Global Ocular Tuberculosis Therapeutics Market Attractiveness by Region, 2022-2032

Figure 16: North America Ocular Tuberculosis Therapeutics Market Value (US$ Mn) by Treatment, 2022-2032

Figure 17: North America Ocular Tuberculosis Therapeutics Market Value (US$ Mn) by end-user, 2022-2032

Figure 18: North America Ocular Tuberculosis Therapeutics Market Value (US$ Mn) by Country, 2022-2032

Figure 19: North America Ocular Tuberculosis Therapeutics Market Value (US$ Mn) Analysis by Country, 2017-2032

Figure 20: North America Ocular Tuberculosis Therapeutics Market Value Share (%) and BPS Analysis by Country, 2022-2032

Figure 21: North America Ocular Tuberculosis Therapeutics Market Y-o-Y Growth (%) Projections by Country, 2022-2032

Figure 22: North America Ocular Tuberculosis Therapeutics Market Value (US$ Mn) Analysis by Treatment, 2017-2032

Figure 23: North America Ocular Tuberculosis Therapeutics Market Value Share (%) and BPS Analysis by Treatment, 2022-2032

Figure 24: North America Ocular Tuberculosis Therapeutics Market Y-o-Y Growth (%) Projections by Treatment, 2022-2032

Figure 25: North America Ocular Tuberculosis Therapeutics Market Value (US$ Mn) Analysis by end-user, 2017-2032

Figure 26: North America Ocular Tuberculosis Therapeutics Market Value Share (%) and BPS Analysis by end-user, 2022-2032

Figure 27: North America Ocular Tuberculosis Therapeutics Market Y-o-Y Growth (%) Projections by end-user, 2022-2032

Figure 28: North America Ocular Tuberculosis Therapeutics Market Attractiveness by Treatment, 2022-2032

Figure 29: North America Ocular Tuberculosis Therapeutics Market Attractiveness by end-user, 2022-2032

Figure 30: North America Ocular Tuberculosis Therapeutics Market Attractiveness by Country, 2022-2032

Figure 31: Latin America Ocular Tuberculosis Therapeutics Market Value (US$ Mn) by Treatment, 2022-2032

Figure 32: Latin America Ocular Tuberculosis Therapeutics Market Value (US$ Mn) by end-user, 2022-2032

Figure 33: Latin America Ocular Tuberculosis Therapeutics Market Value (US$ Mn) by Country, 2022-2032

Figure 34: Latin America Ocular Tuberculosis Therapeutics Market Value (US$ Mn) Analysis by Country, 2017-2032

Figure 35: Latin America Ocular Tuberculosis Therapeutics Market Value Share (%) and BPS Analysis by Country, 2022-2032

Figure 36: Latin America Ocular Tuberculosis Therapeutics Market Y-o-Y Growth (%) Projections by Country, 2022-2032

Figure 37: Latin America Ocular Tuberculosis Therapeutics Market Value (US$ Mn) Analysis by Treatment, 2017-2032

Figure 38: Latin America Ocular Tuberculosis Therapeutics Market Value Share (%) and BPS Analysis by Treatment, 2022-2032

Figure 39: Latin America Ocular Tuberculosis Therapeutics Market Y-o-Y Growth (%) Projections by Treatment, 2022-2032

Figure 40: Latin America Ocular Tuberculosis Therapeutics Market Value (US$ Mn) Analysis by end-user, 2017-2032

Figure 41: Latin America Ocular Tuberculosis Therapeutics Market Value Share (%) and BPS Analysis by end-user, 2022-2032

Figure 42: Latin America Ocular Tuberculosis Therapeutics Market Y-o-Y Growth (%) Projections by end-user, 2022-2032

Figure 43: Latin America Ocular Tuberculosis Therapeutics Market Attractiveness by Treatment, 2022-2032

Figure 44: Latin America Ocular Tuberculosis Therapeutics Market Attractiveness by end-user, 2022-2032

Figure 45: Latin America Ocular Tuberculosis Therapeutics Market Attractiveness by Country, 2022-2032

Figure 46: Europe Ocular Tuberculosis Therapeutics Market Value (US$ Mn) by Treatment, 2022-2032

Figure 47: Europe Ocular Tuberculosis Therapeutics Market Value (US$ Mn) by end-user, 2022-2032

Figure 48: Europe Ocular Tuberculosis Therapeutics Market Value (US$ Mn) by Country, 2022-2032

Figure 49: Europe Ocular Tuberculosis Therapeutics Market Value (US$ Mn) Analysis by Country, 2017-2032

Figure 50: Europe Ocular Tuberculosis Therapeutics Market Value Share (%) and BPS Analysis by Country, 2022-2032

Figure 51: Europe Ocular Tuberculosis Therapeutics Market Y-o-Y Growth (%) Projections by Country, 2022-2032

Figure 52: Europe Ocular Tuberculosis Therapeutics Market Value (US$ Mn) Analysis by Treatment, 2017-2032

Figure 53: Europe Ocular Tuberculosis Therapeutics Market Value Share (%) and BPS Analysis by Treatment, 2022-2032

Figure 54: Europe Ocular Tuberculosis Therapeutics Market Y-o-Y Growth (%) Projections by Treatment, 2022-2032

Figure 55: Europe Ocular Tuberculosis Therapeutics Market Value (US$ Mn) Analysis by end-user, 2017-2032

Figure 56: Europe Ocular Tuberculosis Therapeutics Market Value Share (%) and BPS Analysis by end-user, 2022-2032

Figure 57: Europe Ocular Tuberculosis Therapeutics Market Y-o-Y Growth (%) Projections by end-user, 2022-2032

Figure 58: Europe Ocular Tuberculosis Therapeutics Market Attractiveness by Treatment, 2022-2032

Figure 59: Europe Ocular Tuberculosis Therapeutics Market Attractiveness by end-user, 2022-2032

Figure 60: Europe Ocular Tuberculosis Therapeutics Market Attractiveness by Country, 2022-2032

Figure 61: Asia Pacific Ocular Tuberculosis Therapeutics Market Value (US$ Mn) by Treatment, 2022-2032

Figure 62: Asia Pacific Ocular Tuberculosis Therapeutics Market Value (US$ Mn) by end-user, 2022-2032

Figure 63: Asia Pacific Ocular Tuberculosis Therapeutics Market Value (US$ Mn) by Country, 2022-2032

Figure 64: Asia Pacific Ocular Tuberculosis Therapeutics Market Value (US$ Mn) Analysis by Country, 2017-2032

Figure 65: Asia Pacific Ocular Tuberculosis Therapeutics Market Value Share (%) and BPS Analysis by Country, 2022-2032

Figure 66: Asia Pacific Ocular Tuberculosis Therapeutics Market Y-o-Y Growth (%) Projections by Country, 2022-2032

Figure 67: Asia Pacific Ocular Tuberculosis Therapeutics Market Value (US$ Mn) Analysis by Treatment, 2017-2032

Figure 68: Asia Pacific Ocular Tuberculosis Therapeutics Market Value Share (%) and BPS Analysis by Treatment, 2022-2032

Figure 69: Asia Pacific Ocular Tuberculosis Therapeutics Market Y-o-Y Growth (%) Projections by Treatment, 2022-2032

Figure 70: Asia Pacific Ocular Tuberculosis Therapeutics Market Value (US$ Mn) Analysis by end-user, 2017-2032

Figure 71: Asia Pacific Ocular Tuberculosis Therapeutics Market Value Share (%) and BPS Analysis by end-user, 2022-2032

Figure 72: Asia Pacific Ocular Tuberculosis Therapeutics Market Y-o-Y Growth (%) Projections by end-user, 2022-2032

Figure 73: Asia Pacific Ocular Tuberculosis Therapeutics Market Attractiveness by Treatment, 2022-2032

Figure 74: Asia Pacific Ocular Tuberculosis Therapeutics Market Attractiveness by end-user, 2022-2032

Figure 75: Asia Pacific Ocular Tuberculosis Therapeutics Market Attractiveness by Country, 2022-2032

Figure 76: MEA Ocular Tuberculosis Therapeutics Market Value (US$ Mn) by Treatment, 2022-2032

Figure 77: MEA Ocular Tuberculosis Therapeutics Market Value (US$ Mn) by end-user, 2022-2032

Figure 78: MEA Ocular Tuberculosis Therapeutics Market Value (US$ Mn) by Country, 2022-2032

Figure 79: MEA Ocular Tuberculosis Therapeutics Market Value (US$ Mn) Analysis by Country, 2017-2032

Figure 80: MEA Ocular Tuberculosis Therapeutics Market Value Share (%) and BPS Analysis by Country, 2022-2032

Figure 81: MEA Ocular Tuberculosis Therapeutics Market Y-o-Y Growth (%) Projections by Country, 2022-2032

Figure 82: MEA Ocular Tuberculosis Therapeutics Market Value (US$ Mn) Analysis by Treatment, 2017-2032

Figure 83: MEA Ocular Tuberculosis Therapeutics Market Value Share (%) and BPS Analysis by Treatment, 2022-2032

Figure 84: MEA Ocular Tuberculosis Therapeutics Market Y-o-Y Growth (%) Projections by Treatment, 2022-2032

Figure 85: MEA Ocular Tuberculosis Therapeutics Market Value (US$ Mn) Analysis by end-user, 2017-2032

Figure 86: MEA Ocular Tuberculosis Therapeutics Market Value Share (%) and BPS Analysis by end-user, 2022-2032

Figure 87: MEA Ocular Tuberculosis Therapeutics Market Y-o-Y Growth (%) Projections by end-user, 2022-2032

Figure 88: MEA Ocular Tuberculosis Therapeutics Market Attractiveness by Treatment, 2022-2032

Figure 89: MEA Ocular Tuberculosis Therapeutics Market Attractiveness by end-user, 2022-2032

Figure 90: MEA Ocular Tuberculosis Therapeutics Market Attractiveness by Country, 2022-2032

Recommendations

Healthcare

Leukemia Therapeutics Treatment Market

Published : October 2023

Healthcare

Peptide Therapeutics Market

Published : January 2023

Healthcare

Tuberculosis Therapeutics Market

Published : December 2022

Healthcare

Lung Cancer Therapeutics Market

Published : June 2022

Explore Healthcare Insights

View Reports

Ocular Tuberculosis Therapeutics Market